Recent desperate cries for help from French and other European banks raise the question of exactly what type and how much trouble have they managed to get themselves into. The question can be approached from many angles. Here I try to gain insights into the topic by analyzing the cross-border interbank lending network. This is a network that facilitates the flow of much needed liquidity across the sovereign borders within the Eurozone. Due to high interconnectedness, banks in each country affect (and are affected) directly or indirectly (by) the banks in all other countries. Banks of different countries play different roles in this vital network: some are net creditors, others are net debtors. In this post I take on the challenge of contrasting the behavior of the two largest creditors in the system (the banking sectors of France and Germany) who are often blamed for the recklessness in their lending practices.
Inspired by visualization of the network by The New York Times, I use the data on Consolidated Banking Statistics issued in December 2011 by the Bank for International Settlements. The data comprises the claims of banks in a given country filed vis-à-vis banks in other countries as of June 2011. Numbers do not include holdings of sovereign debt. The data is available only for 10 out of 17 Eurozone countries: France, Germany, Italy, Spain, The Netherlands, Austria, Ireland, Belgium, Portugal and Greece. As I am interested in the role of national financial systems in European network I cancelled out the counter-claims across the borders and proceeded with the volume of the net claims of one European country banking sector vis-à-vis others.
The resulting network connects each of the 10 countries to the other nine. Each connection has a direction that reflects the current debt balance of a country’s banks vis-à-vis another country’s banks. I apply simple weighted network analysis to the data in order to dissect the European interbank lending network. The volume of mismatch between the claims vis-à-vis partners is used for weighting the links in the network. To make the methodology clearer consider a hypothetical example. Banks of country A owe 100 Euros to the banks of country B. At the same time, banks of country B owe 40 Euros to banks of country A. Then the mismatch between the countries amounts to 60 Euros which country A owes to country B. This way I determine the direction of each link in our network, or who is the creditor and who is the debtor. In addition to this, I take into account the value of the mismatch in the following way. If country C owes country D 30 Euros, we say that the link between A and B, which we have discussed earlier, is twice stronger than that between C and D.
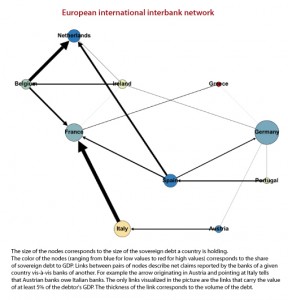
A quick glance at the network visualization on Figure 1 is enough to notice the special role French and German banks are playing in the system. Banks in these two countries are the ones that are exposed the most to the problems in other European countries.
Recognizing that European cross-border interbank lending network is tightly embedded into global interbank lending network I augment the data with the three largest global players: The United Kingdom, The United States and Japan. In what follows I report two sets of results: one – for isolated European interbank lending network (that I call a closed network), the other – for the extended (open) network that includes three large international players. In the latter case, non-Eurozone countries are taken into account in the calculations but are excluded from the presented rankings.
There are a few important characteristics of the network that we can look at. I concentrate on country rankings with respect to statistics describing country’s banks’ access to interbank loans, their importance in facilitating interbank liquidity flow and their overall role as lender’s or receivers of the loans.
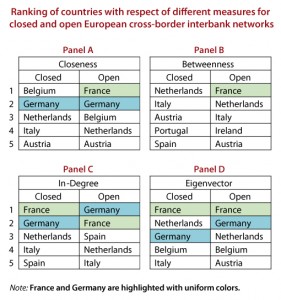
The measure that allows us to rank the countries in our network with respect to their access to loans is closeness centrality. This statistic measures the distance of the country’s banks to the banks of all the other countries in the network. Higher centrality implies shorter distance. This, in its turn, means that banks do not have to go far in search of financial resources. Panel A of Table 1 presents the ranking of the countries with respect to closeness centrality. When the European network is considered in isolation from the rest of the world it is Germany that has the easiest access to liquidity, while France does not appear in first half of the list. However, when European network is regarded as being embedded in global interbank lending network France tops the list leaving Germany at close second. This allows to conclude that French banks go mainly outside the Eurozone for borrowing money, while German banks balance their borrowings between European and non-European banks.
Panel B of Table 1 presents rankings with respect to betweenness centrality, which measures how much control do a country’s banks have over the liquidity flow through the network. This statistic calculates the frequency with which the country appears on the routes that money has to travel from every country to every other country. Higher centrality means that the banking system of the country lies on large number of routs between pairs of other countries. In this respect the closed European network is independent of influence of France and Germany. This points to the fact that banks in the system can reach each other without necessarily going through Germany or even France. The major brokers within the Eurozone seem to be the Dutch banks. Once extra-European links are considered French banks lead the board, while Germany does not appear in top five. France’s top seat in open network implies that it plays the role of a broker between European and non-European banks.
Next measure is the in-degree of the country in the weighted network. This statistic basically measures how important of a creditor a given country is for the other members of the network. Being largest creditors France and Germany swap the places as we move from closed to open network. From here we can conclude that Germany, although being larger creditor than France, has heavier non-European presence. This, clearly, is good for German banks in such turbulent times for Europe. In contrast French banks are more exposed to European risk.
Finally, Eigenvector centrality measures the importance of the country’s banks in the system more accurately. It takes into account not only creditor and debtor positions in the network but also the identity of the countries that a given country has ties with. According to this measure French banks play an absolutely central role in the network under discussion. Germany comes second once we discuss an open network. The difference between France and Germany is driven by the differences in their European/non-European credit ratio as well as by the differences in composition of European credit. The most notable difference is France’s extreme exposure to troubled Italy.
A broader view at Table 1 allows us to make an additional conclusion regarding the behavior of French and German banking systems. From the table it is apparent that going from closed to open network (which adds American, British and Japanese banking systems to the picture) affects positions of France much more than those of Germany. This implies that German banks keep balance in their activity between European and non-European partners. They diversify their risk more efficiently. While French banks put all their eggs in one basket – Europe, which might not be the best strategy to pursue.
All in all, the present analysis shows that the prize for reckless lending goes rather to French than to German banks. They are central in the network by virtually any measure. In visualization in Figure 1 French credit, directly or indirectly, can reach all countries except Germany and Netherlands, while German credit only extends to four countries. And, importantly, that list of four does include Italy.


