France has set up benefits such as RSA income support, PPE in-work negative income tax, CMU universal health care, the minimum pension, housing allowances, and exemptions from social security contributions for low-wage workers. From the other side, it has a tax on large fortunes; social insurance and family contributions apply to the entire wage; and capital income is hit by social security contributions and subject to income tax. France’s wealthy are complaining that taxation is confiscatory, and a few are choosing to become tax exiles.
Despite this, some people argue that the French tax-benefit (or socio-fiscal) system is not very redistributive. This view was recently lent support by a study by Landais, Saez and Piketty: the French tax system is not very progressive and even regressive at the top of the income hierarchy [2]: the richest 0.1% of households are taxed at a very low rate. But redistribution through the tax-benefit system is effected not just through taxes but also through social benefits. We must therefore look at both these aspects to evaluate how redistributive the system is. This is especially true as Landais, Saez and Piketty take into account the VAT paid on consumption financed by social benefits, but not the benefits themselves, meaning that the more a poor household benefits (and spends) from social benefits, the more it seems to lose on redistribution.[3]
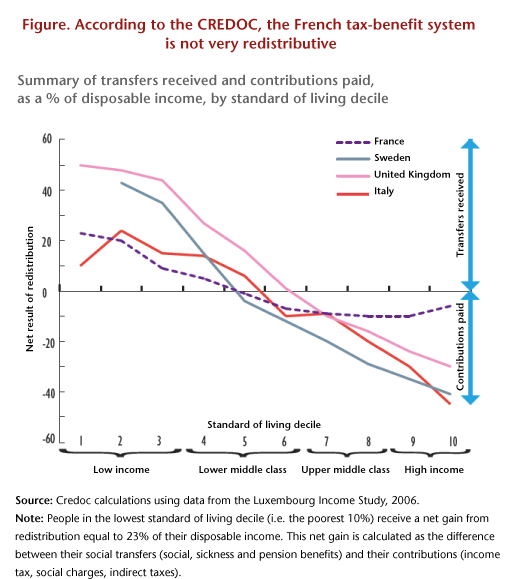
Four researchers from Crédoc, the French Research Center for the Study and Monitoring of Living Standards, have published a study [4] that takes benefits into account. They nevertheless conclude: “The French tax system, taken as a whole, is not very redistributive.” The study uses post-redistribution standard-of-living deciles to review the benefits received and the taxes paid by households (direct taxes, indirect taxes and social contributions) as a percentage of disposable income, and compares France, Italy, the United Kingdom and Sweden. In France, net transfers (levies less benefits) represent only 23% of household disposable income in the first standard-of-living decile (the poorest), against 50% in the United Kingdom (see figure). At the other end of the scale, in France transfers lower the disposable income of the richest households by only 6%, versus 30% in the UK, 40% in Sweden, and 45% in Italy. France is thus considered to have the lowest level of redistribution, with little distributed to poor people and low taxes on the rich.
Yet the French tax-benefit system is considered by international institutions as one of those that minimize inequalities the most. For instance, the OECD (2011) wrote: “Redistribution through taxes and benefits reduces inequality by just over 30% in France, which is well above the OECD average of 25%”.
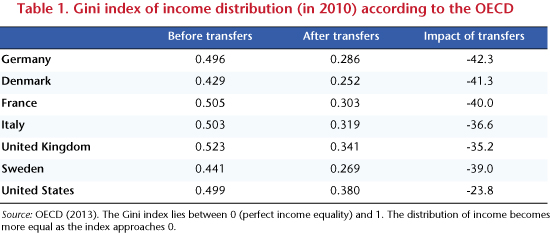
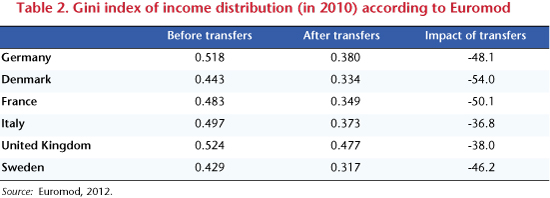
The OECD provides statistics on income inequality (measured by the Gini coefficient) before and after transfers. Of the four countries selected by the Crédoc, it is France where the Gini is reduced the most as a percentage by transfers (Table 1), to an extent equivalent to the level in Sweden, and significantly greater than the reduction in Italy and the UK. Euromod winds up with a substantially similar classification (Table 2).
The Portrait social [Social Portrait] by the INSEE provides a careful summary of how redistributive the French socio-fiscal system is (Cazenave et al., 2012). It seems that inequality is reduced significantly (Table 4) in France: the inter-decile ratio (D10/D1) falls from 17.5 before redistribution to 5.7 afterwards.[5] According to the INSEE, 63% of the reduction in inequality comes from social benefits and 37% from levies, which confirms the need to take benefits into account in order to assess redistribution.
The vision presented by Crédoc of the redistributivity of the French tax-benefit system is thus unusual… and, to put it frankly, wrong.
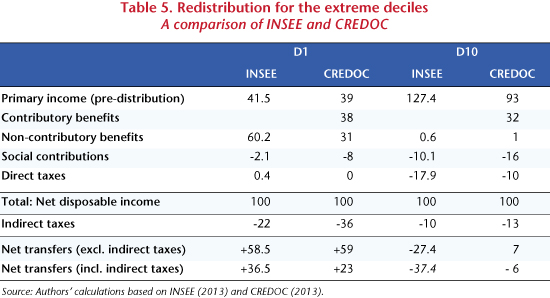
The study is based on data from the Budget des familles [Family budget] survey that is not matched with fiscal data and which is generally considered less reliable than the Euromod survey or than the tax and social security figures used by the INSEE. This may explain some important differences between the Crédoc figures and those of the INSEE: for example, according to the INSEE, non-contributory transfers represent 61% of the disposable income of the poorest 10%, but only 31% according to Crédoc (Table 5).
Like the INSEE, the Crédoc study ignores employer national health insurance contributions (which hit high wages in France, unlike most other countries) and the ISF wealth tax (which exists only in France). Furthermore, it does not distinguish between contributory contributions (which give rights to a pension or unemployment benefits) and non-contributory contributions (such as health insurance or family contributions), which do not give rights. However, low-wage workers are not hit by non-contributory contributions in France, as these are more than offset by exemptions from social security contributions on low wages.
Most importantly, the study contains two errors that heavily distort the conclusions. The first methodological error is that, contrary to the INSEE, the authors include contributory transfers, in particular pensions [6], in social transfers. But for retirees, public pensions represent a very large part of their disposable income, particularly in France. Since the pension system ensures parity in living standards between retirees and active employees, then retirees show up in all the standard of living deciles and the tax-benefit system does not seem to be very redistributive, as it provides benefits to wealthy retirees. And contrariwise, if a country’s pension system does not assure parity in living standards between retirees and active employees, then the tax-benefit system will seem more redistributive, as it provides pensions only to the poor.
So paradoxically, it is the generosity of the French system towards pensioners and the unemployed that makes it seem to be not very redistributive. Thus, according to Crédoc, the richest 10% receive contributory transfers representing 32% of their disposable income, which means that, in total, their net transfers represent only a negative 6% of their income. This is especially the case as Crédoc does not take into account the old-age pension contributions (cotisations vieillesse) incurred by businesses. If, as the INSEE does, pensions (and more generally all contributory benefits) are considered as primary income, resulting from past contributions, the negative net transfers of the richest decile increase from -6% to -38%.
The other methodological problem is that Crédoc claims to take into account the weight of indirect taxes in disposable income (which INSEE does not). This comes to 36% for the poorest 10%, 23% in the middle of the income hierarchy, and only 13% for the best-off. The highly regressive nature of indirect taxes would make the whole tax system regressive: the poorest pay more than the rich. According to the figures from Landais, Saez and Piketty (2011), indirect taxation is definitely regressive (15% of the disposable income of the poorest, and 10% for the richest), but the gap is only 5%. According to the INSEE [7], the weight of indirect taxes in disposable income is 22% for the poorest, 16% in the middle income range and 10% for the richest. This difference comes from the structure of consumption (the poorest consume relatively more tobacco and petroleum products), and especially the savings rate, which increases as households earn more. In fact, the difference is undoubtedly overstated in an inter-temporal perspective: some households will consume today’s savings tomorrow, so it is then that they will be hit by indirect taxation. In fact, the Crédoc study heavily overestimates the weight of indirect taxes by using an extravagant estimate of the household savings rate [8]: the overall French household savings rate is -26.5%; only decile D10 (the richest 10%) have a positive savings rate; decile D1 has a negative savings rate of -110%, that is to say, it consumes 2.1 times its income. The poorest decile is thus hit hard by the burden of indirect taxes. But how likely is this savings rate?
National tax-benefit systems are complex and different. Comparisons between them need to be made with caution and rigour. To judge how redistributive the French system actually is, it is still more relevant to use the work of the INSEE, the OECD or Euromod than this (too) unusual study.
[1] We would like to thank Juliette Stehlé, who provided assistance in clarifying certain points in this note.
[2] See Landais C., T. Piketty and E. Saez, Pour une révolution fiscal [For a tax revolution], Le Seuil, 2011.
[3] See also Sterdyniak H., “Une lecture critique de l’ouvrage Pour une révolution fiscal” [A critical reading of the work Pour une révolution fiscal], Revue de l’OFCE, no. 122, 2012. Note also that you cannot arrive at an overall judgment on the progressivity of the system from the case of a few super-rich who manage to evade taxes through tax schemes.
[4] Bigot R, É. Daudey, J. Muller and G. Osier: “En France, les classes moyennes inférieures bénéficient moins de la redistribution que dans d’autres pays” [In France, the lower middle classes benefit less from redistribution than in some other countries], Consommation et modes de vie, Crédoc, November 2013. For an expanded version, see: “Les classes moyennes sont-elles perdantes ou gagnantes dans la redistribution socio-fiscale” [Are the middle classes losers or winners from the tax-benefit redistribution], Cahiers de Recherche, Crédoc, December 2012.
[5] Also note that the INSEE underestimates somewhat the redistribution effected by the French system since it does not take into account the ISF wealth tax. It also does not include employers’ national health insurance, which in France is strongly redistributive as it is not capped. From the other side, it does not take account of indirect taxes.
[6] And replacement income such as unemployment benefits and sickness benefits.
[7] See Eidelman A., F. Langumier and A. Vicard: “Prélèvements obligatoires reposant sur les ménages:
des canaux redistributifs différents en 1990 et 2010” [Mandatory taxes on households: different channels of redistribution in 1990 and 2010], Document de Travail de la DESE de l’INSEE, G2012/08.
[8] Estimation from EUROMOD (2004): “Modelling the redistributive impact of indirect taxation in Europe”, Euromod Working paper, June.


