Spain: a 2018 budget on target, if the Commission likes it or not

By Christine Rifflart

With a deficit of 3.1% of GDP in 2017, Spain has cut its deficit by 1.4 points from 2016 and has been meeting its commitments to the European Commission. It should cross the 3% threshold in 2018 without difficulty, making it the latest country to leave the excessive deficit procedure (EDP), after France in 2017. The 2018 budget was first presented to the European Commission on April 30 and then approved by Spain’s Congress of Deputies on May 23 amidst a highly tense political situation, which on June 1 led to the dismissal of Spain’s President Mariano Rajoy (supported by the Basque nationalist representatives of the PNV Party who had approved the 2018 budget a few days earlier). It should be passed in the Senate soon by another majority vote. The expansionary orientation of the 2018 budget, backed by the government of the new Socialist President Pedro Sanchez, does not satisfy the Commission, which considers the adjustment of public finances insufficient to meet the target of 2.2% of GDP included in the 2018-2021 Stability and Growth Pact (SGP). According to the hypotheses of the previous government, not only would the deficit fall below 3% but the nominal target would be respected.

Admittedly, while, given the strong growth expected in Spain in 2018, the public deficit will easily be below 3% in 2018 and therefore meet the requirements set in the EDP, the new budget act is not in line with the fiscal orthodoxy expected by Brussels. The lack of a People’s Party majority in Congress led ex-President Mariano Rajoy into strategic alliances with Ciudadanos and the PNV to get the 2018 budget adopted (with the hope, in particular, of avoiding early parliamentary elections), at the price of significant concessions:

– An increase in civil servants’ salaries of 1.75%[1] in 2018 and at least 2.5% in 2019, with a larger increase if GDP grows by more than 2.5% (estimated cost of 2.7 billion euros in 2018 and 3.5 billion in 2019 according to the outgoing government);

– Lower taxes for low-income households (via the increase in the minimum tax threshold from 12,000 to 14,000 euros income per year, tax credits for childcare expenses, assistance for disabled people and large families, and a reduction in tax on gross wages between 14,000 and 18,000 euros) (cost 835 million in 2018 and 1.4 billion in 2019);

– The revaluation of pensions by 1.6% in 2018 and by 1.5% in 2019 (cost of 1.5 and 2.2 billion), in addition to a rise of up to 3% in the old age and non-taxpayer minimum, and between 1% and 1.5% for the lowest pensions (cost 1.1 billion in 2018).

According to the former government, these measures will cost a little more than 6 billion euros in 2018 (0.5% of GDP) and nearly 7 billion in 2019 (0.6% of GDP). The revaluation of pensions should be partly covered by the introduction of a tax on digital activities (Google tax) in 2018 and 2019, with revenues of 2.1 billion euros expected. In the end, spending, which was expected to fall by 0.9 GDP point in 2018 based on the undertakings made in the previous 2017-2020 SGP, would fall by only 0.5 GDP point in the 2018-2021 SGP (to 40.5% of GDP) (Table). But above all, despite the tax cuts just introduced, the extra revenue expected from the additional growth should represent 0.1 GDP point (to 38.3% of GDP). In fact, the budget’s redistributive character, combined with the downward revision of the impact of the Catalan crisis on the economy (0.1% of GDP according to the AIReF [2]) led all the institutes (Bank of Spain, the Government, the European Commission) to raise their 2018 growth forecasts from last winter by 0.2 or 0.3 GDP point to bring it slightly below 3% (2.6% for the OFCE according to our April forecasts [3]).

Table_post13-06_ENG
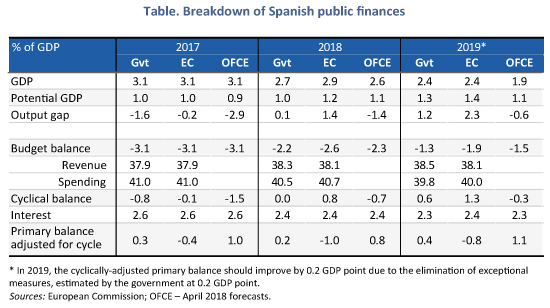
Nevertheless, beyond the shared optimism about Spanish growth, the calculations of the cost of the new measures differ between the Spanish authorities and the Commission. According to the government, the increase in growth should, as we have said, boost tax revenues and neutralize the expected cost of new spending. In 2018, the 0.9 percentage point reduction in the deficit (from 3.1% to 2.2%) would therefore be achieved by the 0.8 GDP point growth in the cyclical balance, combined with the 0.2 point fall in debt charges, with the structural balance remaining stable (fiscal policy would become neutral rather than restrictive as set out in the earlier version of the Pact). But this scenario is not shared by Brussels[4], for whom the cost of the measures, and in particular of the increase in civil servants’ salaries, is underestimated. Expenditures are expected to be 0.2 GDP point higher and revenue 0.2 GDP point higher than the government has announced. According to the Commission, the cyclical balance is expected to improve by 0.9 GDP point, but the fiscal impulse would worsen the structural balance by 0.6 GDP point. In these conditions, the deficit would bypass the 3% mark, but fiscal policy would clearly become expansionary and the 2.2% target would not be hit. The public deficit stood at 2.6% in 2018 (Figure 1).

IMG1_post13-06_ENG
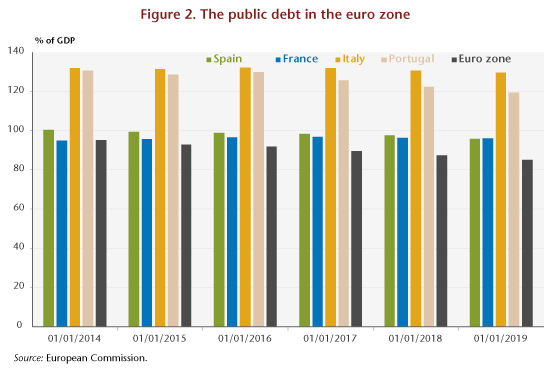
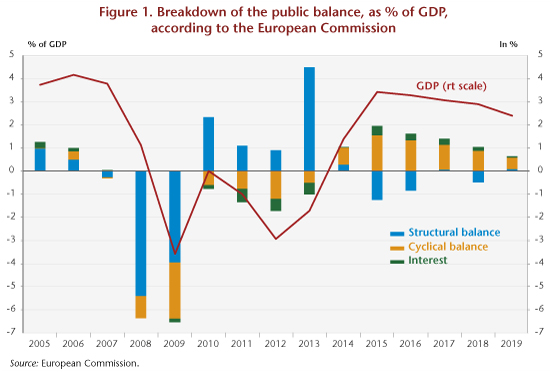
This more expansionary orientation of the 2018 budget results above all from the political considerations of the former Rajoy government and its effort to deal with the impossibility of governing (facts have demonstrated the fragility of this position). Nevertheless, the timing is ideal – because the only budget commitment required in 2018 is to cross the 3% deficit threshold in order to get out of the corrective arm of the SGP. The year 2018 therefore makes it possible to implement a generous fiscal policy, while crossing the 3% mark, without exposing the country to sanctions. The situation will be more delicate in 2019, when EU rules aimed at reducing a debt that is still well above 60% of GDP will be applied, notably by adjusting the structural balance (Figure 2).

IMG2_post13-06_ENG

[1] https://www.boe.es/boe/dias/2018/03/26/pdfs/BOE-A-2018-4222.pdf

[2] https://elpais.com/economia/2018/04/17/actualidad/1523949570_477094.html?rel=str_articulo#1526464987471

[3] See the Spain part of the dossier:  https://www.ofce.sciences-po.fr/pdf/revue/11-155OFCE.pdf , pp 137-141.

[4] Nor by the AIReF.


France’s growth in 2018-2019: What the forecasters say …

By Sabine Le Bayon and Christine Rifflart

Following the INSEE’s publication of the first version of the accounts for the fourth quarter of 2017 and a first estimate of annual growth, we have been considering the outlook for 2018 and 2019 based on a comparative analysis of forecasts made for France by 18 public and private institutes, including the OFCE, between September and December 2017. This post presents the highlights of this analysis, which are given in detail in OFCE Policy Brief No. 32 of 8 February 2018 entitled, “A comparison of macroeconomic forecasts for France” and the associated working paper (No. 06-2018) (which contains the tables of the institutes’ forecasts).

Following the deep recession of 2008-2009 and the euro zone crisis of 2011, the French economy started a slow recovery, which picked up pace in late 2016. The year 2017 was thus a year of recovery, with slightly higher growth than most forecasters had recently expected: 1.9% according to the INSEE’s first estimate, compared to an average forecast of 1.8%. This momentum is expected to continue in 2018 and 2019, with the forecasts averaging 1.8% and 1.7%, respectively. The standard deviations are low (0.1 point in 2018 and 0.2 in 2019), and the forecasts are fairly close for 2018 but diverge more sharply in 2019 (ranging from a low of 1.4% to a high of 2.2%) (Figure 1). In 2019, 5 out of 15 institutes expect growth to accelerate while 8 foresee a slowdown.

IMG1_postSLB-CR_ENG

Overall, all but four of the institutes anticipate a rebalancing of the drivers of growth over the period, with trade having less of an adverse effect than in the past and domestic demand still buoyant (Figure 2). However, the recovery in foreign trade is under debate in light of the chronic losses in market shares recorded since the beginning of the 2000s. Indeed, it seems that the expected pick-up in exports in 2018 will be due more to a recovery in foreign demand for France’s output and to the rundown of the export-oriented stocks accumulated in 2016 and 2017 in certain sectors (in particular transport equipment and aeronautics) than to any recovery in competitiveness. For 2019, there are differences in opinion about the impact of the supply policies implemented since 2013 on French companies’ price and non-price competitiveness. Some institutes expect an improvement in export performance and thus a regain of market share by 2019, while others foresee a loss of share due to insufficient investment in high value-added sectors and labour costs that still burden business.

IMG2_postSLB-CR_ENGThere is also debate over the forecasts for jobs and wages, in particular over the impact of the cutbacks in subsidized jobs, the effect of the policies to lower labour costs in 2019 (transformation of the CICE competitiveness tax credit into lower employer social contributions) and productivity (trend and cycle). On average, the unemployment rate should fall from 9.5% in 2017 to 8.8% in 2019, with forecasts ranging from 8.1% for the most optimistic to 9.2% for the most pessimistic. Some differences in the forecasts on wages can be attributed to differing assessments both of the degree of tension on the labour market and also of the impact on wages of the more decentralized collective bargaining set up in 2017. Wages are expected to rise by 1.8% in 2017 and on average by 1.9% in 2018 and 2% in 2019 (ranging from 1.3% for the lowest forecast to 2.6% for the highest).

In this context, growth will rise much faster than potential growth, which is estimated by most institutes at around 1.25% (some institutes expect an acceleration due to the positive impact of structural reforms and investment, while others foresee lower potential growth). While in 2017, the growth gap – the difference between observed GDP and potential GDP – is clearly negative (between -2.2 and -0.7 points of potential GDP), this will close by 2019. Most of the institutes (from those that provided us with data or qualitative information) believe the output gap will close (close to 0 or clearly positive) and inflationary pressures could appear. For four institutes, the output gap will be around -0.7 point.

Finally, for all the institutes the budget deficit should fall below the threshold of 3% of GDP by 2017. France will exit the excessive deficit procedure in 2018. But despite the vigorous growth, and in the absence of stricter fiscal consolidation, for most of the institutes the public deficit will remain high over the period.


Oil: carbon for growth

By Céline AntoninBruno Ducoudré, Hervé Péléraux, Christine Rifflart, Aurélien Saussay

This text is based on the special study of the same name [Pétrole : du carbone pour la croissance, in French] that accompanies the OFCE’s 2015-2016 Forecast for the euro zone and the rest of the world.

The 50% fall in the price of Brent between summer 2014 and January 2015 and its continuing low level over the following months is good news for oil-importing economies. In a context of weak growth, this has resulted in a transfer of wealth to the benefit of the net importing countries through the trade balance, which is stimulating growth and fuelling a recovery. Lower oil prices are boosting household purchasing power and driving a rise in consumption and investment in a context where companies’ production costs are down. This has stimulated exports, with the additional demand from other oil-importing economies more than offsetting the slowdown seen in the exporting economies.

That said, the fall in oil prices is not neutral for the environment. Indeed, the fall in oil prices is making low-carbon transportation and production systems less attractive and could well hold back the much-needed energy transition and the reduction of greenhouse gas emissions (GHG).

This oil counter-shock will have a favourable impact on growth in the net oil-importing countries only if it is sustained. By 2016, the excess supply in the oil market, which has fuelled by the past development of shale oil production in the United States and OPEC’s laissez-faire policy, will taper off. Unconventional oil production in the United States, whose profitability is uncertain at prices of under 60 dollars per barrel, will have to adjust to lower prices, but the tapering off expected from the second half of 2015 will not be sufficient to bring prices down to their pre-shock level. Brent crude prices could stay at about 55 dollars a barrel before beginning towards end 2015 to rise to 65 dollars a year later. Prices should therefore remain below the levels of 2013 and early 2014, and despite the expected upward trend the short-term impact on growth will remain positive.

To measure the impact of this shock on the French economy, we have used two macroeconometric models, e-mod.fr and ThreeMe, to carry out a series of simulations. These models also allow us to assess the macroeconomic impact, the transfers in activity from one sector to another, and the environmental impact of the increased consumption of hydrocarbons. The results are presented in detail in the special study. It turns out that for the French economy a 20 dollar fall in oil prices leads to additional growth of 0.2 GDP point in the first year and 0.1 point in the second, but this is accompanied by a significant environmental cost. After five years, the price fall would lead to additional GHG emissions of 2.94 MtCO2, or nearly 1% of France’s total emissions in 2013. This volume for France represents nearly 4% of Europe’s goal of reducing emissions by 20% from 1990 levels.

The simulations using the French e-mod.fr model can be extended to the major developed economies (Germany, Italy, Spain, the USA and UK) by adapting it to suit characteristics for the consumption, import and production of oil. With the exception of the United States, the oil counter-shock has a substantial positive impact that is relatively similar for all the countries, with Spain benefitting just a little more because of its higher oil intensity. Ultimately, considering the past and projected changes in oil prices (at constant exchange rates), the additional growth expected on average in the major euro zone countries would be 0.6 GDP point in 2015 and 0.1 point in 2016. In the US, the positive impact would be partially offset by the crisis that is hitting the unconventional oil production business[1]. The impact on GDP would be positive in 2015 (+0.3 point) and negative in 2016 (-0.2 point). While lower oil prices are having a positive impact on global economic growth, this is unfortunately not the case for the environment …


[1] See the post, The US economy at a standstill in Q1 2015 : the impact of shale oil, by Aurélien Saussay, from 29 April on the OFCE site.


Devaluation through wages in the euro zone: a lose-lose adjustment

by Sabine Le Bayon, Mathieu Plane, Christine Rifflart and Raul Sampognaro

Since the outbreak of the financial crisis in 2008 and the sovereign debt crisis in 2010-2011, the euro zone countries have developed adjustment strategies aimed at restoring market confidence and putting their economies back on the path to growth. The countries hit hardest by the crisis are those that depended heavily on the financial markets and had very high current account deficits (Spain, Italy, but also Ireland, Portugal and Greece). Although the deficits have now been largely resolved, the euro zone is still wallowing in sluggish growth, with deflationary tendencies that could intensify if no changes are made. Without an adjustment in exchange rates, the adjustment is taking place through jobs and wages. The consequences of this devaluation through wages, which we summarize here, are described in greater depth in the special study published in the dossier on the OFCE’s forecasts (Revue de l’OFCE, no. 136, November 2014).

An adjustment driven by moderation in wage increases …

Faced with falling demand, companies have adapted by making heavy cutbacks in employment in order to cut costs, which has led to a steep rise in unemployment. The number of jobless in the euro zone was 7 million higher in September 2014 than in March 2008. The situation is especially glum in countries like Greece, where the unemployment rate is 26.9%, Spain (24.2%), Portugal (13.8%) and Italy (12.5%). Only Germany has experienced a reduction in unemployment, with a rate of 5.0% of the active population.

As is suggested by the Phillips curve, runaway unemployment has eventually affected the conditions governing wage increases, especially in the most crisis-ridden countries (Figure 1). While between 2000 and 2009 wage growth was more dynamic in the peripheral countries (3.8% annually) than in the countries in the euro zone core (+2.3%) [1], the situation reversed after 2010. Nominal wage growth slowed in the peripheral countries (0.8%), but stayed close to the pre-crisis rate (+2.6%) in the core countries. This heterogeneity is due to differences in how much unemployment has worsened in the different countries. According to Buti and Turrini (2012) [2] from the European Commission, reversing the trend in wage dynamics will be a major factor driving the rebalancing of current account positions in the euro zone.

Graphe1_post27-11ang

Furthermore, an analysis at the macroeconomic data level masks the extent of the ongoing wage moderation, as the effects of the crisis are concentrated on the most vulnerable populations (young, non-graduate employees) earning the lowest wages. The deformation of the structure of employment in favour of more skilled and more experienced workers (see the OFCE post: On the difficulty of carrying out structural reforms in a context of high unemployment) is also pushing up mid-level wages. As can be seen in a number of studies based on an analysis of the macroeconomic data [3], wage growth after correcting for these composition effects is below the increase in the average salary.

… that compresses domestic demand and is not very effective in terms of competitiveness

Underlying this policy of deflationary adjustment through wages, what is important for companies is to improve competitiveness and regain market share. Thus, compared with the beginning of 2008, unit labour costs (ULC) [4] fell in the countries deepest in crisis (Spain, Portugal and Ireland), slowed in Italy and continued their upward progression in the countries in the euro zone core, i.e. those facing the least financial pressure (Germany, France, Belgium and the Netherlands).

The most significant adjustment took place in Spain. Deflated by inflation, its ULC has fallen by 14% since 2008, 13 points of which are explained by the recovery in productivity, which was achieved at the expense of massive cuts in employment. Real wages increased only 1% over the period. Conversely, in Italy, the adjustment has focused on wages, whose purchasing power has fallen by 5%. However, this decline was not sufficient to offset the fall in productivity, and thus to prevent an increase in the real ULC. In Germany, after the real ULC rose in 2008, real wages continued to rise, but less than gains in productivity. In France, real wages and productivity have risen in tandem at a moderate pace. The ULC, deflated by inflation, has thus been stable since 2009 but has still worsened compared to 2008.

Even though this deflationary strategy is intended to restore business competitiveness, it is a double loser. First, as the strategy is being implemented jointly in all the countries in the euro zone, these efforts wind up neutralizing each other. Ultimately, it is the countries that carry the strategy furthest that win the “bonus”. Thus, among the euro zone’s larger economies, only Spain can really benefit due to the sharp reduction in its ULC, which reflects not only its own efforts but also some continued wage growth among its key partners. France and Italy are not experiencing any gain, and Germany has seen a deterioration in its ULC of about 3% between 2008 and 2013. Moreover, while the wage devaluation might have helped to boost activity, this will have been accomplished through a rebound in exports. But it is difficult to find any correlation between exports and wage adjustments during the crisis (Figure 2). These results have already been pointed out by Gaulier and Vicard (2012). Even if the countries facing the deepest crisis (Spain, Greece, Portugal) might gain market share, the volumes exported by each of them are in the short/medium term not very sensitive to changes in labour costs. This might be explained by companies’ preference to rebuild their margins rather than to lower export prices. Even in countries where the relative ULC fell sharply, the prices of exports rose significantly (6.2% in Greece, 3.2% in Ireland since 2008, etc.).

Finally, in an effort to improve their cost competitiveness, companies reduced their payroll by cutting employment and / or wages. This strategy of competitive disinflation results in pressure on household incomes and thus on their demand for goods, which slows the growth of imports. Indeed, in contrast to what is observed for exports, there is a close and positive relationship between changes in the relative ULC and in import volumes over the period 2008-2009 (Figure 3). In other words, the greater the adjustment effort in the ULC with respect to competitor countries, the slower the growth in import volumes.

Graphe2a_post27-11ang

Graphe2b_post27-11ang


This non-cooperative strategy to rebalance the current account can permanently affect an economic recovery in a context where reducing the debt of both private and public agents will become even more difficult if deflationary pressures are felt in an ongoing way (due to increases in real terms in debt and interest rates). The imbalances in the current accounts of the various euro zone countries will thus be dealt with mainly by a contraction of imports. The correction of such imbalances by means of a wage devaluation, as was the case in 2010-2011, is therefore doubly expensive: a low impact on competitiveness, relative to competitors, due to the simultaneous implementation of the strategy in the various euro zone countries, and an increased risk of deflation, making it more difficult to shed debt, thereby fuelling the possibility of a scenario of prolonged stagnation in the euro zone.


[1] Germany, France, Belgium and the Netherlands. The peripheral countries include Spain, Italy, Portugal and Greece.

[2] Buti and Turrini (2012), “Slow but steady? Achievements and shortcomings of competitive disinflation within the Euro Area”.

[3] For a comparison of a number of euro zone countries at the start of the crisis, see ECB (2012), “Euro Area Labor Markets and the Crisis”. For the case of Spain, see Puente and Galan (2014), “Un analisis de los efectos composición sobre la evolución de los salarios”. Finally, for the French case, see Verdugo (2013) “Les salaires réels ont-ils été affectés par les évolutions du chômage en France avant et pendant la crise?”  and Audenaert, Bardaji, Lardeux, Orand and Sicsic (2014), “Wage resilience in France since the Great Recession”.

[4] The unit labour cost is defined as the cost of labour per unit produced. This is calculated as the ratio between compensation per capita and average labour productivity.


On the difficulty of carrying out structural reforms in a period of high unemployment

By Sabine Le Bayon, Mathieu Plane, Christine Rifflart and Raul Sampognaro

Structural reforms aimed at developing a more flexible labour market are often attributed all the virtues of fighting against mass unemployment and limiting the segmentation of the labour market between “insiders” on stable contracts  and “outsiders” who are unemployed or on precarious contracts. When the economy is growing, these measures can facilitate job creation for the benefit of the outsiders, but the results are likely to be more uncertain in a context of mass unemployment and sluggish growth. Structural reforms can indeed reduce the labour market duality arising from regulatory measures but they cannot combat the duality of the labour market inherent in human capital, which is exacerbated during periods of mass unemployment: given the same qualifications it is experience that makes the difference, and given equal experience it is qualifications that make the difference. High unemployment therefore strengthens the phenomenon of “queuing” to access more stable jobs. Structural reforms aimed at streamlining the labour market will thus primarily affect employees who have less qualifications and experience without however enabling outsiders to gain access to more stable employment. This means that inequality between workers is likely to rise, with no positive impact on employment due to the sluggishness of the economy. Only macroeconomic management that takes on board the goal of returning to full employment could lead to successful structural reform.

As we show in a special study, “La dévaluation par les salaires dans la zone euro: un ajustement perdant-perdant” [Devaluation through wages in the euro zone: a lose-lose adjustment] (Revue de l’OFCE, no. 136, November 2014), labour market segmentation has increased during the crisis despite the implementation of structural reforms in the euro zone countries. Since 2008, the employment rate [1] of seniors and of the better qualified has fared better than for other population groups in the four largest countries in the euro zone (Figures 1 and 2).

The sharp decline in the youth employment rate since 2008 is general – including in Germany, where the labour market has remained dynamic – and contrasts with the increase in the employment rate of older workers (or the small decline in Spain). The difference between these two categories is between 12 percentage points in France and 21 points in Italy (15 points in Germany and 19 in Spain). The adjustment in the employment rate of the 25-54 age group lies in an intermediate position. The resistance of the employment rate of older workers to the crisis is probably due to a combination of two factors: the introduction of pension system reforms in recent years (lengthening contribution periods and / or raising the legal retirement age) and the relatively higher cost of dismissing senior citizens, who more often occupy higher positions in the job hierarchy. In a crisis, it is likely that this has led to a substitution effect with the employment of older workers coming at the expense of the young.

Graphe1_postENG_27-11-ES

The adjustments in employment rates were also more striking for people without a high school diploma, with the exception of Italy, where the diploma does not seem to provide protection from unemployment or inactivity. In France, the adjustment in the employment rate clearly decreased with the type of degree. In Germany, the employment rate for those with less education has declined during the crisis while it has increased for the other categories. In Spain, the employment rate of university graduates has withstood the crisis better than the rate of other population groups. In addition to these developments in employment rates by educational category, wage income in Italy, Spain and France has fallen for the initial income deciles. This adjustment in the wage incomes of the lower deciles is probably due to a reduction in total working hours over the year (part-time work, shorter temporary contracts or longer periods of unemployment between contracts, reducing average compensation over the year). Thus, in the countries hit hardest by the crisis, the most vulnerable populations, with the least human capital, have found themselves more exposed to a deteriorating labour market, whether this has been felt through falling employment rates or a reduction in annual wage earnings.

Graphe2_postENG_27-11-ES

In the context of a deteriorating labour market, by accepting a slight downgrade the most qualified unemployed workers would be the first to find jobs, chasing out those who might otherwise have gotten it, who would themselves do the same thing at a lower level. This could explain why, at the end of the queue, it is the least skilled who are, regardless of labour legislation, the victims of unemployment and precarious employment.

The existence of a “spontaneous” segmentation in the labour market and the phenomenon of “queuing” may thus limit the success of a strategy of structural reforms and wage devaluation. In such a case, a more flexible labour market combined with a reduction in social welfare could increase inequalities between groups in the workforce without increasing the creation of full-time equivalent jobs.


[1] This is the ratio of the employed to the working-age population.


What’s masked by the fall in US unemployment rates

By Christine Rifflart

Despite the further decline in the US unemployment rate in December, data from the Bureau of Labor Statistics released last week confirms paradoxically that the American labour market is in poor health. The US unemployment rate fell by 0.3 percentage point from November (-1.2 points from December 2012) to end the year at 6.7%. The rate has fallen 3.3 percentage points from a record high in October 2009, and is coming closer and closer to the non-accelerating inflation rate of unemployment (NAIRU), which since 2010 has been set by the OECD at 6.1%. However, these results do not at all reflect a rebound in employment, but instead mask a further deterioration in the economic situation.

While the unemployment rate is the standard indicator for summarizing how tight a labour market is, this can also be considered using two other indicators, i.e. the employment rate and the labour force participation rate – in the US case, these give a different view of the state of the labour market (see chart).

GrapheCR_Post_16-01_English

After falling nearly 5 percentage points in 2008 and 2009, the employment rate has been constant for 4 years, at the level of the early 1980s (58.6%, following a peak of 63.4% at end 2006). Since then, the decline in the unemployment rate has reflected the decline in the participation rate, a trend that is confirmed by the figures for December. Over the period 2010-2013, the participation rate lost a little more than 2 percentage points, to wind up at end December at its lowest level since 1978 (62.8%, following a peak of 66.4% at end 2006).

This poor performance is due to insufficient job creation, which has a threefold impact. Despite positive GDP growth – which contrasts with the recession in the euro zone – demand is far from sufficient to reassure business and revitalize the labour market. After four years of recovery, at end 2013 employment has still not returned to its pre-crisis level. Net creation of salaried jobs in the private sector has not even been sufficient to absorb the demographic increase in the working age population. As a result, the employment rate is not improving from where it bottomed out.

Moreover, the difficulty in finding employment is encouraging the exit or delaying the entry or return of people who are old enough to participate in the labour market. This effect, familiar to economists, is called effet de flexion (“bending effect”) in French: young people are encouraged to study longer, women stay at home after raising their children, and unemployed people become discouraged and stop looking for work. Despite the resumption of economic growth and job creation, this effect continued to be felt in full in 2013. While the reduction in the participation rate slowed in 2011 and 2012 – the growth of the labour force was once more positive but remained lower than that of the working-age population – it accelerated in 2013 with the decline in the labour force. During the second half of 2013, 885,000 people were in effect diverted away from the labour market, due in particular to the more difficult economic and social conditions.

Companies seem reluctant to rehire in the particularly difficult economic context. The fiscal shock in early 2013 depressed activity: GDP growth fell from 2.8% in 2012 to an expected level of about 1.8% in 2013. There will be additional fiscal adjustments in 2014. Beyond drastic cuts (related to sequestration [1]) in state spending, some exceptional measures that have been in force since 2008-2009 for the poorest households and the long-term unemployed (3.9 million out of the 10.4 million unemployed) are coming to an end and have not been renewed. According to estimates by the Centre on Budget and Policy Priorities (CBPP), 1.3 million unemployed who have exhausted their entitlement to basic benefits (26 weeks) and who have enjoyed an exceptional extension will find themselves without support as of 1 January 2014 due to the non- renewal of the measure, and nearly 5 million unemployed will be affected by the end of the year.

There is a risk of growing numbers of people falling into poverty in this situation. According to the Census Bureau, since 2010 the poverty rate has been about 15%. However, again according to the CBPP, unemployment benefits would have prevented 1.7 million people from falling below the poverty line. The greater difficulties facing the long-term unemployed and the withdrawal of part of the population from the labour market are the direct result of a morose labour market, which is not indicative of a continuous decline in the unemployment rate.


[1] See America’s fiscal headache written 9 December 2013.


America’s fiscal headache

By Christine Rifflart

Before next December 13th, the Budget Conference Committee must present the results of the discussions begun following the shutdown and debt crisis in October 2013. The objective of the negotiations is to enable Congress to approve the 2014 Budget, for which the fiscal year began on October 1 [1], and find an alternative to the automatic cuts in federal spending that are to take effect on 1 January 2014. An agreement does not seem out of reach. Even if sharp opposition between Republicans and Democrats remains, reason should prevail and the risk of a new budget crisis seems excluded. At worst a new Continuing Resolution [2] will be passed that allows institutions to continue to function and the arbitrary nature of automatic budget cuts in structural expenditure to guide government policy. At best, the negotiations will lead to reasoned cuts in expenditure, and even to increases in some revenues that will then curb the violence of the adjustment, a violence that is amplified by the ending of the exceptional measures to support income and activity that were enacted at the heart of the crisis.

There is little room for negotiation. In fiscal year 2013, the deficit for the entire public sector reached 7% of GDP (after 12.8% in fiscal year 2009), and the federal deficit came to 4.1% of GDP (after 9.8%). The federal debt currently comes to 72.7% of GDP, and is rising. Moreover, growth remains weak: 2.2% at an annual average since the 2010 recovery, with 1.8% expected in 2013, which in particular is insufficient to revitalize the job market. How then is it possible to come up with a budget policy to support growth in a context of fiscal austerity and deficit reduction while complying with the commitments previously made by Congress[3], in particular the Budget Control Act of 2011? Following the crisis concerning the federal debt ceiling in July 2011, on 2 August 2011 President Obama signed the Budget Control Act of 2011, which conditioned any increase in the federal debt ceiling on a massive reduction in government spending over 10 years. In addition to the introduction of caps on discretionary spending [4], 1200 billion dollars in automatic cuts (sequestrations) in expenditures were planned for the period 2013 to 2021 based on a principle of parity between defense and non-defense budgets. A number of social programs (pension insurance, Medicaid, income guarantees, etc.) were exempted, while cuts to the Medicare program for the elderly were limited to 2%. In total, the cuts will apply to a little less than half of federal spending and will represent 109 billion per year in savings on the deficit, i.e. 0.6% of GDP.

For the 2014 fiscal year, according to the CBO the combination of these two measures (capped discretionary spending and automatic cuts in unprotected budgets) as well as the renewal of the amount of credits from 2013 to 2014 (i.e. a constant nominal budget) will lead to cuts in discretionary spending of 20 billion dollars that will have to be borne entirely by the Pentagon. On this basis, if the cuts are maintained, discretionary spending in the defense and non-defense budgets will have declined by 17% and 17.8%, respectively, in real terms between 2010 and 2014.

But in addition to these brutal cuts, other programs, in particular those primarily intended for low-income households, will experience a reduction in their budget in 2014 because of the expiration of the exceptional measures they previously enjoyed. Thus, the program to extend unemployment benefits created on 30 June 2008 for unemployed people who had exhausted their rights (Emergency Unemployment Compensation) ends on 1 January 2014. In the absence of other plans, this will hit 4 million people.

This is also the case of the Supplemental Nutrition Assistance Program (SNAP), which had benefited under the American Recovery and Reinvestment Act of 2009 from additional funding that elapsed on 1 November. Yet 47.7 million beneficiaries (15% of the population) received food stamps this year. According to the CBPP, the 7% cut in the program’s funds should result in a decrease of 4 million in the number of beneficiaries.

Another example: the housing benefits for the 2.1 million families who cannot find decent housing will also be affected by the termination of the budget extensions introduced in 2009 and the automatic cuts. If the budget is not renewed, from 125,000 to 185,000 of the families receiving benefits at end 2012 will no longer receive aid at end 2014.

According to the information currently available, a minimum agreement on the Budget Conference Committee seems to be emerging. The cuts in the defense budget could be approved [5], while eventual increases in public utility charges would be used to fund budget extensions for some social programs and lighten the impact of the automatic cuts. Last April, President Obama presented his Draft 2014 Budget to Congress. At that time he proposed to remove the procedures for automatic cuts, to reduce the debt in the long term through an extensive fiscal reform, and in the shorter term to defer a portion of the 2014 budget cuts to fiscal years 2015 and 2016 in order to boost growth. The agreement, which is likely to be presented to Congress by 13 December, will undoubtedly not be this ambitious. Faced with Republican (the majority in the House of Representatives) partisans of additional savings, the Democrats (the majority in the Senate) will find it difficult to defend an increase in public spending in 2014 and to adopt a fiscal policy that is less harmful to growth this year than it was in 2013.


[1] After not having been adopted by Congress, the 2014 budget has been financed since 16 October by a Continuing Resolution (see note 2) on the basis of the 2013 budget amounts. The Resolution is retroactive from the 1st day of the 2014 fiscal year, i.e. 1 October 2013, until 15 January 2014.

[2] A Continuing Resolution is a temporary resolution passed by Congress that is used to extend the appropriations made the previous fiscal year to the current fiscal year, while waiting for new measures to be approved.

[3] According to the CBPP, if all the deficit reduction measures adopted since 2010 in the 2011 Budget, the Budget Control Act of 2011 and the American Taxpayer Relief Act of 2012 are taken into account, the cumulative impact on the deficit would be 4000 billion over the period 2014-2023, i.e. the equivalent of 24% of 2013 GDP.

[4] Discretionary spending (33% of federal spending) is spending for which the budgets are voted on an annual basis, unlike mandatory spending (61%), which is based on programs covered by prior law. The spending side of the government’s fiscal policy rests mainly on changes in discretionary spending, which are structural expenditure.

[5] Expenditure related to defense had already fallen by 13.1% in real terms between Q3 2010 and Q3 2013.


No surprises from the Fed*

By Christine Rifflart

Not surprisingly, at its meeting on 29 and 30 October the Monetary Policy Committee of the US Federal Reserve decided to maintain its unconventional measures and to leave the federal funds rate unchanged. Since the end of 2012, the Fed has been making massive purchases of securities (government bonds and mortgage debt) at a rate of $85 billion per month. The aim is to put pressure on long-term rates and to support economic activity, including the real estate market.

The Federal Reserve, which is committed to a strategy of transparency and communication aimed at orienting investor expectations, also confirmed that it will hold the rate at between 0 and 0.25% so long as: the unemployment rate is greater than 6.5%; forecasts of inflation over 1 to 2 years do not exceed the long-term inflation target, set at 2%, by more than a half-point; and long-term inflation expectations remain stable. According to our forecast in October (see The United States: capped growth), the unemployment rate, which was 7.2% in September, could fall to 6.9% by end 2014. Finally, inflation, which was at 1.5% in the third quarter of 2013, should not exceed 1.8% in 2014. In these conditions, no rate increase is expected before the second half of 2015. Policy will thus remain particularly accommodating.

There is greater uncertainty about the withdrawal of the unconventional measures than about keeping long-term rates at artificially low levels. A cessation or reduction of these measures was announced last May and is thus expected by the markets, and in any case they were not meant to last. Between May and September 2013, foreign private and public investors had anticipated the beginning of their withdrawal and began offloading some of their securities. This influx of securities depressed prices and led to a one-point increase in long-term public rates in just a few weeks. But the fragile character of growth, inadequate job creation and especially the public relations efforts undertaken by the central banks to reassure the financial markets led to putting off the actual date the purchases are to be curtailed. Long-term rates fell once again, and have continued to fall in recent weeks following the October budget crisis.

If, in retrospect, it appears that it was premature to anticipate an early withdrawal of the unconventional measures, the question of timing still remains. In its press release, the Committee stated that any decision will depend on the economic outlook as well as on a cost-benefit analysis of the programme. However, the economic situation is not expected to improve in the coming months. If Congress reaches a budget agreement before December 13, this will certainly be on the basis of cuts in public spending. This new fiscal shock will further dampen growth and penalize the labor market yet again. The issuance of new debt, which was compelled in 2013 by the statutory debt ceiling, might then grow very slowly in 2014 due to budget adjustments. Faced with this moderate growth in the supply of securities, the Federal Reserve could reduce its own purchases to the benefit of other investors. This could help maintain equilibrium in the securities market without a sharp fall in asset prices.

This normalization of monetary policy instruments should not be long in coming. But there are risks involved, and a sharp rise in long-term rates cannot be excluded. The markets are volatile, and the events of May and June have not been forgotten. But much of the movement has already been taken on board by the markets. The Federal Reserve will therefore have to beef up its communication strategy (by for example announcing in advance the date and scope of its decision) if it is to succeed the difficult balancing act of maintaining a highly accommodative monetary policy while gradually dispensing with its exceptional measures to maintain low interest rates. Let us assume that the exercise will be a success. Long-term public rates, at 2.7% in third quarter 2013, should not exceed 3.5% by the end of 2014.

——

*This text draws on the study “Politique monétaire: est-ce le début de la fin ?” [Monetary policy: Is it the beginning of the end?], which is to appear soon in the OFCE 2013-2014 outlook for the global economy.


Shut down: America in the spotlight

By Christine Rifflart

A State that asks a third of its civil servants to stay home because it can’t pay them is in a critical situation. When it’s the United States, it’s the whole world that worries.

The absence of an agreement on the 2014 budget, which was to take lawful effect as of Tuesday, 1 October 2013, shows the standoff in Congress between Democrats and Republicans. This kind of contention over the budget is not new: no budget has been passed since 2011, and the federal government has worked up to now through “continuing resolutions” that are used to release the funds needed for the government to function and operate, on a provisional basis. Today’s blockage is on a different scale, and parts of the administration have had to close their doors due to lack of funds. This exceptional situation is not unprecedented: 17 shutdowns have occurred since 1976, the last two under the Clinton administration, lasting, respectively, one week (from 13 to 18 November 1995) and three weeks (from 15 December 1995 to 6 January 1996).

According to the Office of Management and Budget, of a total of 2.1 million federal government employees, more than 800,000 have been prohibited from working, while others have come to work with no guarantee that they will be paid. For example, those being told not to work include 97% of NASA employees, 93% of the Environmental Protection Agency, 87% of the Department of Commerce, 90% of the IRS, etc. Each of these received a letter from the President expressing his bitterness. In practice, this also means that some social services are no longer assured, some government call centres are closed, and the national monuments and 368 national parks are no longer open to the public. Applications for subsidized loans, housing grants, and loan guarantees are no longer being taken, and some government services are closed:

bureau of


Vital services and programs for which funding is not linked to the vote on the annual budget (so-called mandatory spending), which account for over 60% of pre-interest expenditure and represent 12.7% of GDP, have nevertheless been spared. Some social security programs (Medicare, Medicaid), the postal service, national security, and military operations have thus been protected from shutdown, at least in so far as they are not affected by restrictions on staff whose salaries are covered in the 2014 budget.

Another political and fiscal crisis is looming: the US government could go into default from October 17 if the authorized debt ceiling is not raised. The uncertainty surrounding this situation is fraying nerves on the financial markets, and the frozen political climate in Congress does not seem to herald an honourable end to what the media are calling a “game of chicken” [1]. In 1995, however, Clinton emerged victorious from this crisis with the Republicans, and was re-elected in 1996, despite the Republican majority in Congress.

The economy could be seriously affected while awaiting an end to this crisis. If the salaries and benefits of federal civil servants are not paid, the loss in earnings would come to an average of 1500 dollars per week for each family affected. Given the total of 2.1 million federal employees, this would represent 0.08% of quarterly GDP. In three weeks, this would amount to a loss of 0.25% of GDP for the economy in the 4th quarter. Congress could, however, approve retroactive payment of the salaries, which is what generally took place during previous shutdowns.

But this still does not take account of the more important issue of the disorganization of the economy. Considering that on an annual basis half of the federal government’s discretionary spending (i.e. 37% of federal spending, or 7.6% of GDP) [2] is affected by the shutdown, since it is financed out of the 2014 budget, this loss in expenditure represents 0.15 GDP point per week. Given the disorganization represented by the government closures (and using a fiscal multiplier of 1.5), the impact on growth could then come to at least 0.22 GDP point per week. If the crisis lasts 3 weeks, then the impact on 4th quarter GDP would be at least 0.7 GDP point – which would mean a recession for the US economy by the end of the year!

Other estimates do exist. The Office of Management and Budget evaluated the cost of the 1995 shutdowns (from 13 to 18 November 1995 and then from 15 December to 6 January 1996) at 1.4 billion in 1995 dollars (i.e. 0.5 % of quarterly GDP). Based on the 1995 shutdowns, Goldman Sachs evaluates the current weekly cost to the US economy at 8 billion dollars, equivalent to an impact of 0.2% of 4th quarter GDP. Moody’s Analytic Inc. estimates that the shutdown will have an impact of 0.35% of quarterly GDP per week.

If the budget crisis lasts only a few days, its repercussions on the French economy will be minimal, i.e. a reduction in US growth of 1 percentage point would cut French growth by 0.17%. But if the crisis lasts several weeks and overlaps with a crisis over the ceiling on the government debt, which is quickly approaching, then the consequences could be very different. The two crises the (blocked budget and the failure to pay the public debt) would combine and fuel one another, as is emphasized by this New York Times post. It is difficult to imagine the panic this could cause on the financial markets, as interest rates soar and the dollar collapses. This would be a very different story indeed….


[1] In game theory, a game of chicken is a game of influence between two players in which neither must yield. When for example two cars are racing towards a head-on collision, the “chicken” is the driver who veers off course in order to avoid dying.

[2] A major part of spending by the Department of Defence is approved on a multiyear basis and is not subject to being blocked due to the shutdown. Over half of DoD spending is composed of this discretionary expenditure. Furthermore, mandatory outlays are not financed out of credits subject to the vote on the Budget.


Rent control: will the ALUR law be sufficient?

By Sabine Le Bayon, Pierre Madec and Christine Rifflart

On 10 September 2013, Parliament began discussing the bill on “Access to housing and urban renovation [“Accès au Logement et un Urbanisme Rénové” – ALUR]. This legislation will result in stepped-up state intervention in the private rental market and complements the government decree that took effect in summer 2012 on rent control in high-pressure areas. This was an initial step in the government’s effort to curb the increase in housing costs being faced by renters. [1]

The government’s willingness to regulate the excesses of the private rental market is expected to have a rapid impact on households moving into a new home. For sitting tenants, the process is likely to take longer. In a city like Paris, we can expect that, if the highest rents decline to the ceiling set by law, average rents will fall by 4 to 6%. If through a ripple effect this then affects all rents, the deflationary impact would be greater. On the other hand, the risk of an upward drift for lower rents cannot be discarded, even if the government argues otherwise. Ultimately, the impact of the law will depend in large part on the zoning defined by the rent monitoring “observatories” that are currently being set up.

The regulatory decree: a visible, but minimal, impact

The latest annual report of the rent observatory for the Paris region [the Observatoire des loyers de l’agglomération parisienne – “OLAP”] [2] sheds some initial light on the decree’s impact on rent control. To recap, the decree holds rents upon re-letting to a maximum of the pace of the legal benchmark (the “IRL”), unless substantial work has been performed (in which case, the increase is unrestricted). Between 1 January 2012 and 1 January 2013, 51% of Paris residences offered for re-letting saw their rent increase faster than the IRL, despite the absence of substantial work. This share was lower than in 2011 (58.3%) and 2010 (59.4%), but remains close to the level observed between 2005 and 2009 (50%), prior to the existence of the decree.

The impact derived from monthly data seems a bit more conclusive. Thus, over the period from August to December 2012 when the decree was implemented, the share of rentals offered for re-letting that rose faster than the IRL cap fell by 25% on average over a year, against only 8% for the months from January to July 2012 compared to the same period in 2011.

The decree therefore does seem to have had an effect, by helping to reduce the share of rents that increased faster than the IRL cap by about 18%. However, given that if there had been full compliance with the decree no rentals would have risen more than the IRL, the impact has still been inadequate. Several factors already identified in a working document may explain this: the non-existence of benchmark rents, a lack of information about both owners and tenants, a lack of recourse, etc. One year on, it would seem that these shortcomings had a negative impact on the measure’s implementation.

A law on a larger scale

The major innovation of the ALUR law concerns the regulation of the level of rent in high-pressure areas, whereas previous decrees focused on changes in rents. Henceforth, a range of permissible rent levels will be set by law, and the decree will then regulate the maximum permitted changes [3]. To do this, every year the government sets by a prefectural decree a median benchmark rent per sq.m, per geographic area (neighbourhood, district, etc.) and per type of accommodation (one-bedroom flat, two-bedroom, etc.). So:

– For new lets or re-lettings, the rent cannot exceed the cap of 20% over the median benchmark rent, called the upwards adjusted median benchmark rent, except by documenting an exceptional additional rent (for special services, etc.). After that, any increase may not exceed the IRL, in accordance with the regulatory decree for high-pressure areas (except if there is major work);

– Upon renewal of the lease, the rent may be adjusted upwards or downwards depending on the upwards adjusted or downwards adjusted median benchmark rent [4]. Thus, a tenant (or a lessor) may bring an action to decrease (or respectively, to increase) the rent if the latter is higher (or lower) than the median rent as adjusted upwards (or downwards). In case of an increase in the rent, a mechanism for staggering this increase over time is set up. If there is a disagreement between tenant and landlord, an amicable settlement process may be initiated prior to referral to a judge within a strictly determined timeframe. Within this range, the increase is limited to the IRL;

– During a lease, the annual rent review is currently performed as now, on the basis of the IRL;

– Furnished rentals will now be covered by rent control: the prefect will set a higher benchmark rate and any change will be limited to the IRL.

The introduction of these median benchmark rents represents three major advances. On the one hand, they will be calculated from the information gathered by the rental observatories about the entire rental housing stock, and not simply from vacant housing available for rental, i.e. what is called the “market” rent. This so-called market rent is almost 10% above the average of all rents, which itself is above the median rent. This calculation method will therefore inevitably lead to lower rents (both market and average).

Similarly, choosing the median rather than the average as the benchmark rent should make for greater stability in the measure. In the event that all rents more than 20% above the median (i.e. above the upwards adjusted benchmark rent) are reduced and all other rents remain unchanged, the median remains the same. In the case of an adjustment of all rents, the median would fall, but in a lesser proportion than the average, which by definition is more sensitive to changes in extreme values.

Finally, the obligation to include in the lease both the median rent and the upwards adjusted median benchmark rent, the last rent charged and, where relevant, the amount and nature of any work performed since the last contract was signed, provides for greater transparency and a stricter regulatory framework, which should result in greater compliance with the measure.

What changes should be expected?

In 2012, out of the 390,000 residences put up for rent in Paris, 94,000 have a rent higher than the upwards adjusted median rent (3.7 euros / sq.m more on average) and 32,000 have a rent that is more than 30% below the median benchmark rent (2.4 euros / sq.m less on average). Since only rents above the upwards adjusted median rent are to be corrected, the reduction in the average rent would be 4% to 6%, depending on the area and type of housing. This reduction, although not insignificant, would at best permit a return to the rent levels recorded in 2010, before the steep inflation seen in 2011 and 2012 (+7.5% between 2010 and 2012). This adjustment in rents could nevertheless take time. Owners and tenants could easily exercise their rights at the time of a re-letting [5], but revaluations at the time of a lease renewal may take longer to realize. Despite access to information and a regulatory environment that is more favourable to the tenant, the risk of a conflict with the landlord and heightened competition in the rental market in areas where the law applies may still deter some tenants from asserting their rights.

The issue is much more complex for the 32,000 residences with rents below the downwards adjusted benchmark rent. While the quality of some of this housing can justify the difference (insalubrious, location, etc.), it is also clear that the main factor behind the weakness of some rents is the tendency of tenants to be sedentary. Thus, according to the OLAP rent observatory in Paris, the average rent for housing occupied for over 10 years by the same tenant is 20% lower than the average rent for all lets. The question thus arises of re-valuing these rents. Indeed, during a new let or a lease renewal the law allows owners to reassess up to the level of the downwards adjusted median rent – which is also in contradiction with the decree [6]. Once this level has been reached, future changes shall not exceed the IRL.

Eventually, then, some units with similar characteristics will therefore be on the market at very disparate rents, thus penalizing landlords with sedentary tenants. In contrast, tenants who have lived in their homes for a long time might well see significant revaluations in their rent (over 10%). The housing cost burden [7] on these households could thus rise, pushing those facing excessive budget constraints to migrate to areas experiencing less pressure.

Nevertheless, the possibility of revaluing the rent to the level of the market rent in case of an obvious undervaluation is already provided under existing law, i.e. the Act of 6 July 1989 (Article 17c), at the time the lease is renewed. In 2012, in Paris, 3.2% of owners made use of this article. With the new law, while readjustments should be more numerous, the inflationary impact should be weaker as the benchmark (the downwards adjusted median rent) is well below the market rent.

From this point on the issue of zoning is central: the more refined the breakdown, the more the benchmark rents will correspond to the actual characteristics of the local market. In the event of a larger division of the territory, the median benchmark rents may be too high for the less expensive neighbourhoods and too low for the more expensive ones. Meanwhile, low rents will not be re-valued much in the expensive neighbourhoods, and even less so in the others. This could lead to more “inter-neighbourhood” convergence in rents – regardless of local conditions – and less “within-neighbourhood” convergence, which would have adverse consequences for both landlord and tenant.

The impact on rents of the law currently under discussion could be all the greater given that property prices began to fall in France in 2012 and the current sluggish economy is already slowing rent hikes. But it should not be forgotten that only the construction of housing in high-pressure areas (including via densification [8]) will solve the structural problems of the market. Rent control measures are merely a temporary measure to limit the increase in the housing cost burden, but they are not by themselves sufficient.


[1] For more information, see the blog “Rent control: what is the expected impact?

[2] The territory covered by this report is composed of Paris and what are called the “petite couronne” and the “grande couronne” (its near and far suburbs).

[3] As the rent control decree does not cover the same field as the law (38 urban areas versus 28), some areas will be subject to the control only of changes, and not of levels.

[4] While the bill is unclear on the calculation of the downwards adjusted benchmark rent, an amendment adopted in July by the Commission of the Assembly proposed that this should be at least 30% lower than the median benchmark rent. Another amendment clarifies that in case of an upward adjustment, the new rent shall not exceed the downwards adjusted median rent.

[5] In 2012, only 18% of residences on the private rental market were subject to re-letting.

[6] During the renewal of a lease or a re-letting, the rent control decree permits the owner to re-value their rent by half the gap between the last rent and the market rent.

[7] This is the share of household income spent on housing.

[8] On this subject, see the article by Xavier Timbeau, “Comment construire (au moins) un million de logements en région parisienne” [How to build (at least) one million residences in the Paris region”], Revue de l’OFCE no. 128.