What can be deduced from the figures on inflation?

By Eric Heyer

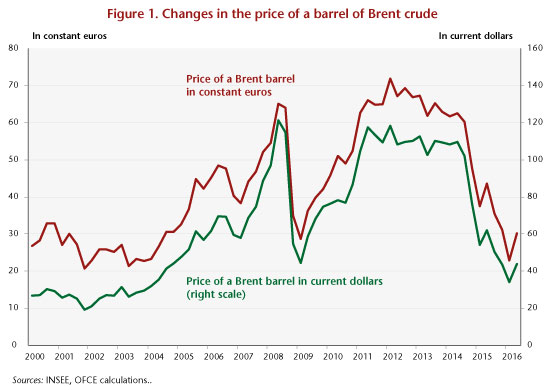
In May, inflation in the euro area moved closer to the ECB target. The sharp rise in inflation, from 1.2% to 1.9% per annum in the space of one month, did not nevertheless provoke a reaction, since the main reason for it was well known and common to all the countries: the surge in oil prices. After having plummeted to 30 dollars a barrel at the beginning of 2016, the price per barrel now stands at around 77 dollars, the highest level since 2014. Even after adjusting for the exchange rate – the euro has appreciated against the dollar – the price of a barrel has increased by almost 40% (18 euros) over the last 12 months, directly causing prices in the net oil importing countries to rise at an accelerating pace. In addition to this common effect, for France the impact of the hike in indirect taxes on tobacco and fuels, which came into force at the beginning of the year, will, according to our estimates, add 0.4 point to the price index.

At the same time, the underlying inflation (or core inflation) index, excluding products with volatile prices (such as oil and fresh produce) as well as prices subject to state intervention (electricity, gas, tobacco, etc.), is still not picking up pace and is staying below 1%. The second-round effect of an oil shock, which passes through a rise in wages, does not seem to be very significant, since consumers are absorbing most of the shock by reducing their purchasing power. This explains part of the observed slowdown in household consumption at the beginning of the year as well as the general lack of reaction of the monetary authorities to the announcement of the inflation figures.

There remains the question of the weakness of trend inflation and its link with the state of the economy. Have we already caught up with the output gap that arose since the Great Depression of 2008 (an output gap of close to zero), or are there still production capacities that can be mobilized in the event of additional demand (positive output gap)? In the first case, this would mean that the link between growth and inflation has been significantly broken; in the second case, this would indicate that the low level of inflation is not surprising and that the normalization of monetary policy needs to be gradual.

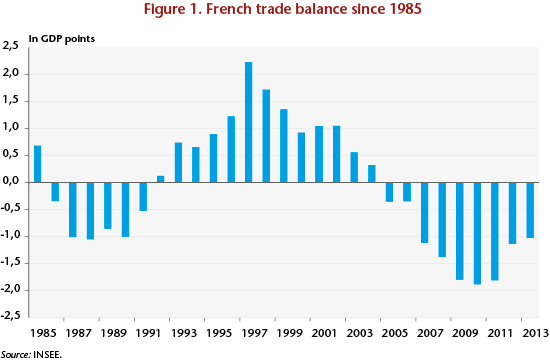
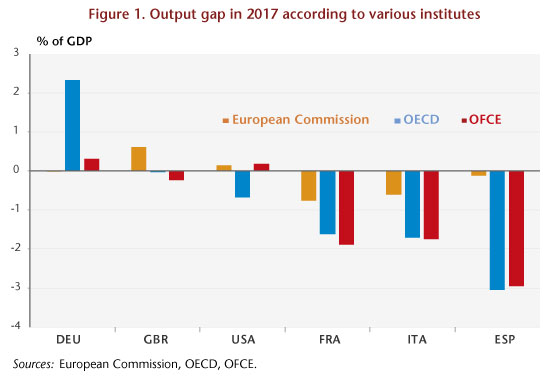
In 2017, even though the process of recovery was consolidating and spreading, most developed economies were still lagging behind their pre-crisis trajectory. Only a few seem to have already overcome the lag in growth. Thus, two categories of countries seem to be emerging: the first – in particular Germany, the United States and the United Kingdom – includes countries that have caught up with their potential level of production and are at the top of the cycle; the second – which includes France, Italy and Spain, for example – includes countries that are still experiencing a lag in production which, according to the economic analysis institutes, lies between 1 and 2 points of GDP for France and Italy and 3 points of GDP for Spain (Figure 1).

IMG1_post05-06_ENG
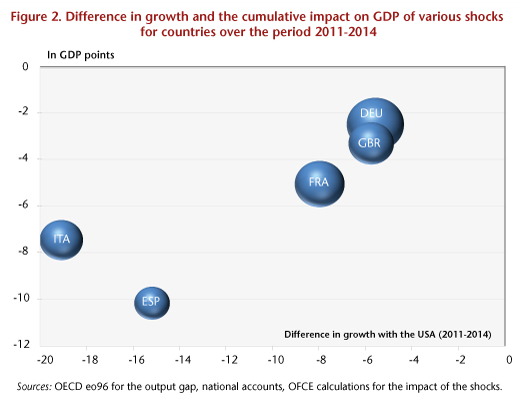
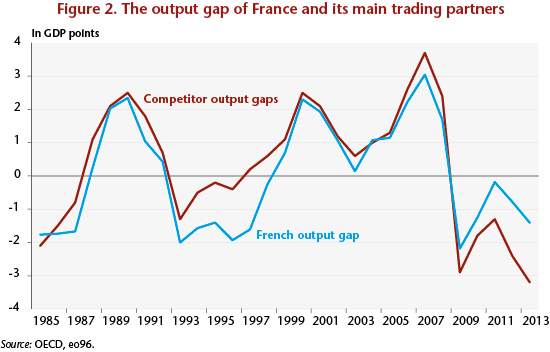
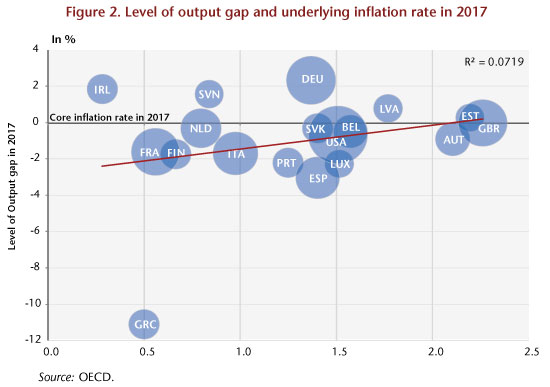
The presence of developed countries in both categories should logically result in the appearance of inflationary pressures in the countries listed in the first group and an inflation gap in those in the latter. However, these two phenomena were not apparent in 2017: as shown in Figure 2, the link between the level of the output gap and the underlying inflation rate is far from clear, casting doubt on the interpretation to be made with respect to the level of the output gap: to uncertainties relating to this notion is added that associated with the level of this gap in the past, in 2007 for example.

IMG2_post05-06_ENG
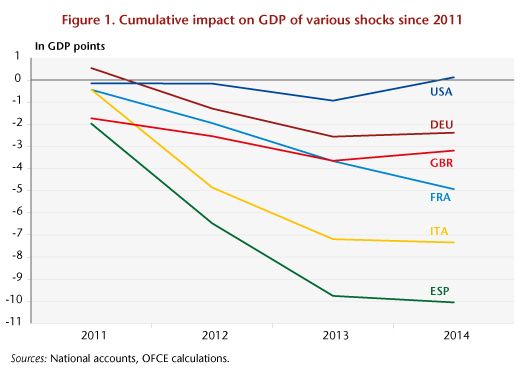
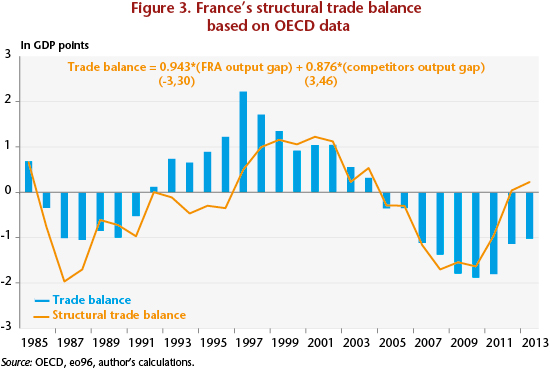
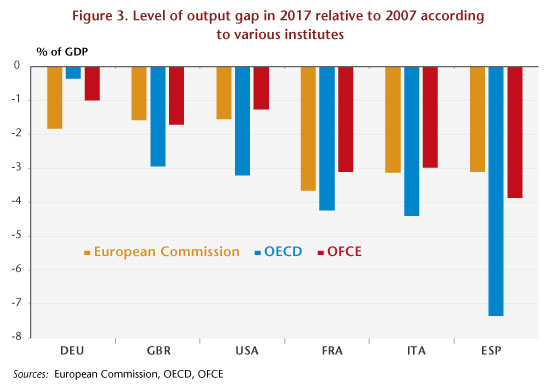
Given this high level of uncertainty, it seems appropriate to make a diagnosis based on how this output gap has varied since 2007. Such an analysis leads to a clearer consensus between the different institutes and to the disappearance of the first category of countries, those with no additional growth margin beyond their own potential growth. Indeed, according to these, in 2017 none of the major developed countries would have come back to its output gap level of 2007, including Germany. This gap would be around 1 GDP point for Germany, 2 GDP points for the United Kingdom and the United States, more than 3 GDP points for France and Italy and around 5 GDP points for Spain (Figure 3).

IMG3_post05-06_ENG
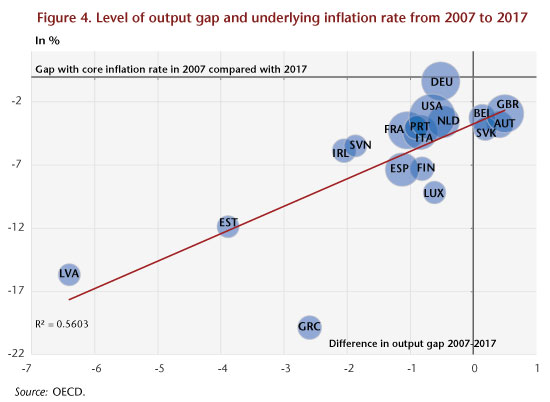
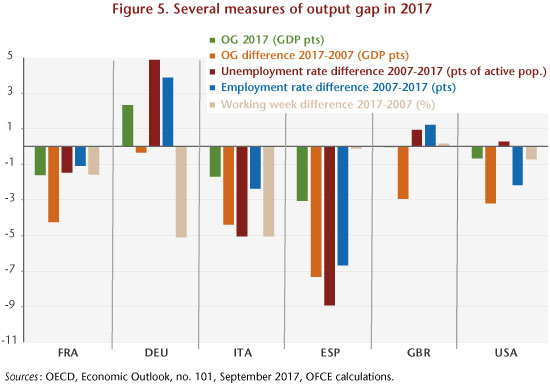
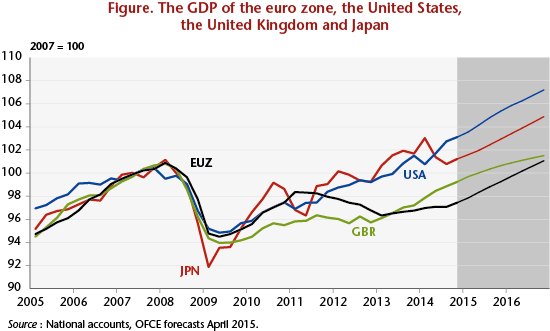
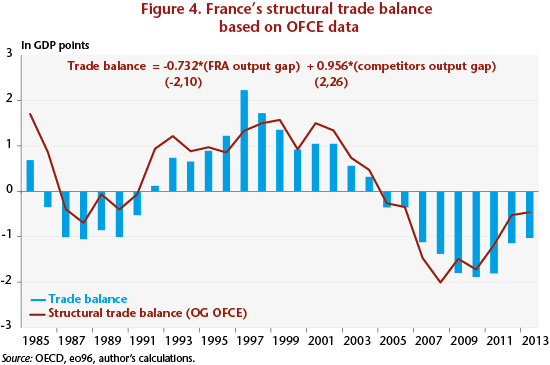
This analysis is more in line with the diagnosis of the renewal of inflation based on the concept of underlying inflation: the fact that the economies of the developed countries had not in 2017 recovered their cyclical level of 2007 explains that inflation rates were lower than those observed during the pre-crisis period (Figure 4). This finding is corroborated by an analysis based on criteria other than the output gap, notably the variation in the unemployment rate and the employment rate since the beginning of the crisis and in the rate of increase in working hours during this same period. Figure 5 illustrates these different criteria. On the basis of these latter criteria, the qualitative diagnosis of the cyclical situation of the different economies points to the existence of relatively high margins for a rebound in Spain, Italy and France. This rebound potential is low in Germany, the United States and the United Kingdom: only an increase in working time in the former or in the employment rate for the latter two could make this possible.

IMG4_post05-06_ENGIMG5_post05-06_ENG


Which new path for raising labour productivity?

By Bruno Ducoudré and Eric Heyer

The industrialized countries are experiencing what seems to be a persistent slowdown in the growth of labour productivity since the second oil shock. This has been the subject of a great deal of analysis in the economic literature[1] that considers the possible disappearance of the growth potential of the developed economies, and consequently their inability to return to a level of activity in line with their pre-crisis trajectories. In other words, could the industrialized countries have entered a phase of “secular stagnation”, making it more difficult to reduce public and private debt? The exhaustion of gains in productivity would also modify any diagnosis made of their conjunctural situation, particularly as regards their labour markets.

Trend productivity gains are inherently unobservable; it is therefore necessary to decompose observed productivity into a trend component and a cyclical component that is linked to the more or less rapid adjustment of employment to changes in economic activity (the productivity cycle). In a recent study published in the Revue de l’OFCE, we seek to highlight the slowdown in trend productivity gains and the productivity cycle in six major developed countries (Germany, Spain, the United States, France, Italy and the United Kingdom) using an econometric method – the Kalman filter – so as to allow the estimation of an equation for labour demand based on explicit theoretical underpinnings and the estimation of trend productivity gains.

After reviewing the various possible explanations for the slowdown described in the economic literature, we present the theoretical modelling of the equation for labour demand and our strategy for an empirical estimation. This equation, derived from a CES-type production function[2], is based on the assumption of maximizing the profit of firms in monopolistic competition and on the assumption of a stable long-term capital-to-output ratio. This makes it possible to break down the trend and cyclical components in a single step, but makes productivity gains depend solely on labour[3].

The existing empirical studies usually rely on a log-linear estimate of the productivity trend and introduce fixed-date trend breaks[4]. We propose an alternative method that consists of writing the employment equation in the form of a state-space model representing the underlying productivity trend. This model has the advantage of allowing a less bumpy depiction of trend productivity gains since it doesn’t rely on ad-hoc break dates.

We then evaluate the new growth path for labour productivity and the productivity cycle for the six countries considered. Our results confirm the slowdown in trend productivity gains (Figure 1).

IMG1_post02-02_ENG

The growth rate for trend productivity for five countries (France, Germany, Italy, the United States and the United Kingdom) shows a slow decline since the 1990s. Trend productivity, estimated at 1.5% in the United States in the 1980s, increased during the 1990s with the wave of new technologies, then gradually decreased to 0.9% at the end of the period. For France, Italy and Germany, the catch-up stopped during the 1990s (during the 2000s for Spain), even though the slowdown in trend productivity gains was interrupted briefly between the mid-1990s and the early 2000s. Leaving aside Italy, whose estimated trend productivity gains were zero at the end of the period, the trend growth rates converged in a range of between 0.8% and 1% in annual trend productivity gains.

The estimated productivity cycles are shown in Figure 2. They show the greatest fluctuations for France, Italy and Germany and the United Kingdom. A calculation of the average times for the adjustment of employment to demand indicates an adjustment period of 4 to 5 quarters for these countries. The cycle fluctuates much less for the United States and Spain, indicating that the speed of adjustment of employment to economic activity is faster for these two countries, which is confirmed by the average time of adjustment to demand (respectively 2 and 3 quarters). Finally, the estimates indicate globally that the productivity cycle will have closed for each of the countries considered in the second quarter of 2017.

IMG2_post02-02_ENG

[1] See, for example, A. Bergeaud, G. Cette and R. Lecat, 2016, “Productivity Trends in Advanced Countries between 1890 and 2012”, The Review of Income Wealth, (62: 420-444) and N. Crafts and K. H. O’Rourke, 2013, “Twentieth Century Growth”, CEPR Discussion Papers.

[2] See C. Allard-Prigent, C. Audenis, K. Berger, N. Carnot, S. Duchêne and F. Pesin, 2002, “Présentation du modèle MESANGE”, French Ministère de l’Economie, des finances et de l’industrie, Forecasting Department, MINEFI, Working document.

[3] The equation for labour demand is based on a production function and an assumption of neutral technical progress in Harrod’s sense.

[4] See M. Cochard, G. Cornilleau and E. Heyer, 2010, “Les marchés du travail dans la crise” [Labour Markets in Crisis], Économie et Statistique, (438: 181-204) and B. Ducoudré and M. Plane, 2015, “Les demandes de facteurs de production en France” [The Demand for Production Factors in France], Revue de l’OFCE (142: 21-53).


The effects of the oil counter-shock: The best is yet to come!

By Eric Heyer and Paul Hubert

After falling sharply over the past two years, oil prices have been rising once again since the start of the year. While a barrel came in at around 110 dollars in early 2014 and 31 dollars in early 2016, it is now close to 50 dollars.

Will this rise in oil prices put a question mark over the gradual recovery that seems to have begun in France in 2016?

In a recent study, we attempted to answer three questions about the impact of oil prices on French growth: will a change in oil prices have an immediate effect, or is there a time lag between the change and the impact on GDP? Are the effects of rises and falls in oil prices asymmetrical? And do these effects depend on the business cycle? The main results of our study can be summarized as follows:

  1. There is a time lag in the impact of oil price variations on French GDP. Over the period 1985-2015 the lag was on average about 4 quarters;
  1. The impact, whether downward or upward, is significant only for variations in oil prices greater than 1 standard deviation;
  2. The asymmetric effect is extremely small: the elasticity of growth to oil prices is the same whether the price rises or falls. Only the speed at which the impact is transmitted differs (3 quarters in the case of a rise, but 4 in the case of a fall);
  3. Finally, the impact of oil price changes on economic activity depends on the phase in the business cycle: the elasticity does not differ significantly from zero in situations of a “crisis” or a “boom”. However, the elasticity is much greater in absolute terms when the economy is growing slowly (an economic slump).

Let us now apply these results to the situation since 2012. Between the first quarter of 2012 and first quarter of 2016, the price of a barrel of Brent crude plummeted from 118 dollars to 34 dollars, a fall of 84 dollars in four years. If we factor in the euro/dollar exchange rate and changes in consumer prices in France, the fall amounts to a 49 euro reduction over the period (Figure 1).

IMG1_post28-05-ENG

We evaluated the impact of a decline like this on France’s quarterly GDP, taking into account the above-mentioned time lag, asymmetry and phase of the business cycle.

Factoring all this in indicates that the oil counter shock ultimately did not show up much in 2015. As illustrated in Figure 2, the impact should make itself felt from the first quarter of 2016, regardless of the hypotheses adopted. The positive effect of the oil counter-shock is yet to come!

IMG2_post28-05-ENG


An ever so fragile recovery

By the Department of Analysis and Forecasting, under the direction of Eric Heyer and  Xavier Timbeau

This text summarizes the OFCE’s economic forecast for 2015-2017 for the euro zone and the rest of the world.

The figures for euro zone growth in the first half of 2015 have confirmed the upswing glimpsed at the end of 2014. While the zone’s return to growth might once have been taken to indicate the end of the global economic and financial crisis that struck in 2008, the turbulence hitting the emerging countries, particularly over the summer in China, is a reminder that the crisis ultimately seems to be continuing. China’s economic weight and its role in world trade are now so substantial that, even in the case of a soft landing, the impact on growth in the developed countries would be significant. We nevertheless anticipate that the scenario for a recovery need not be called into question, and that euro zone growth will be broadly supported by favourable factors (lower oil prices and ECB monetary support) and by some weakening of unfavourable factors (easing of fiscal policies). But the fact remains that the situation in the developing world will add new uncertainty to an already fragile recovery.

Between 2012 and 2014, the euro zone economies stagnated at the very time that the United States turned in average GDP growth of 2%. The recovery that got underway after the sharp contraction in 2008-2009 was quickly cut short in the euro zone by the sovereign debt crisis, which led almost immediately to the uncontrolled tightening of financial conditions and the reinforcement of the fiscal consolidation being implemented in the Member States, as they searched for market credibility.

The euro zone then plunged into a new recession. In 2015, these economic policy shocks are no longer weighing on demand. The ECB helped to reduce sovereign debt risk premiums by announcing the Outright Monetary Transaction programme (OMT) in September 2012 and then by implementing quantitative easing so as to improve financial conditions and promote a fall in the euro. In terms of fiscal policy, while in some countries the consolidation phase is far from over, the measures being taken are smaller in scale and frequency. Furthermore, growth will also be helped by the fall in oil prices, which should last, and the resulting gains in household purchasing power should in turn fuel private consumption. These factors thus reflect an environment that is much more favourable and propitious for growth.

However, it is clear that this scenario depends on some volatile elements, such as the fall in oil prices and the weaker euro. The Chinese slowdown adds another element of risk to the scenario, which is based on the assumption that China will make a smooth transition from an export-oriented growth model to one driven by domestic demand. We expect the euro zone to grow at a rate of 1.5% in 2015 and 1.8% in 2016 and 2017. The main short-term risks to this scenario are negative. If oil prices go up and the euro doesn’t stay down, and if the slowdown in the emerging countries turns into an economic and financial crisis, then growth worldwide and in the euro zone will be significantly lower. This risk is particularly critical given the very high level of unemployment still plaguing the zone (11% in August 2015). Nevertheless, given the pace of anticipated growth, we expect the unemployment rate to fall in 2016-2017 by around 0.6 percentage point per year. At this pace, it will take almost seven years to bring the rate back to its pre-crisis level. So while the prospects for recovery from the 2008 crisis are uncertain, the social crisis undoubtedly has a long time to run.


A fall in the unemployment rate according to the ILO: the false good news

By Bruno Ducoudré and Eric Heyer

Two days following the announcement by France’s unemployment agency Pôle Emploi of an increase in Class A job seeker registrations in April, which comes on top of a first quarter increase, the INSEE statistics agency has published its estimate of the unemployment rate. Under the definition of the International Labour Office (ILO), the unemployment rate in metropolitan France fell by 0.1 point in the first quarter of 2015, meaning 38,000 fewer unemployed than in the fourth quarter of 2014. But according to Pôle emploi, over this same period the number of registered Class A job seekers rose by 12,000. In one case, unemployment is falling; in the other, it is rising: this does not make for a clear diagnosis of what’s happening with unemployment at the start of the year.

What accounts for the different diagnoses of the INSEE and Pôle Emploi?

In addition to differences in methodology (a labour survey for the ILO, administrative data for Pôle emploi), note that to be counted as unemployed according to the ILO, three conditions have to be met: a person must be unemployed, available to work and conducting an active job search. Simply registering at the job centre is not sufficient to meet this last condition. So someone who is registered in Class A [1] at Pôle Emploi but is not conducting an active search is not counted as unemployed according to the ILO. The ILO criteria are thus more restrictive. Historically, the number of unemployed registered at the job centre is higher than that calculated according to the ILO for persons aged 25 and over. Young people under age 25 generally have less incentive to register at the job centre [2].

tab1_0406ang

Except for the under-25s, the unemployment figures from Pôle Emploi are therefore worse than those for the ILO and hence the INSEE (Table 1). The explanation is as follows. In labour market conditions that have worsened considerably, some unemployed people have become discouraged and are no longer actively seeking employment: they are thus no longer counted as unemployed according to the ILO. Yet they are continuing to update their status with the job centre and thus remain registered as unemployed in Class A. This results in an increase in the “halo” of the unemployed, i.e. people who want to work and are readily available but are not actively seeking a job. This unemployment “halo” has increased by 71,000 people in one quarter.

In first quarter 2015, the ILO-based unemployment rate fell for the wrong reasons

There are two reasons why the unemployment rate may fall: the first, virtuous reason is that people are exiting unemployment due to an improvement in the labour market; the second, less rosy reason is that some unemployed people are drifting into inactivity. The latest ILO statistics highlight that the 0.1 point fall in the unemployment rate was due entirely to the decline in the labour force participation rate – which measures the percentage of people in the population aged 15 to 64 who are active – and not to a recovery in employment, which, on the contrary, has declined. So the drop in the unemployment rate is due not to a recovery in employment, but to discouragement among unemployed people who are no longer actively seeking work (Table 2).

tab2_0406postang

More specifically, the entry of young people into the labour market at a time when employment is declining is being reflected in a 0.1 point rise in joblessness in this category. Among seniors, the employment rate is continuing to increase (0.2 points) due to the postponement of the effective retirement age. It is true that ILO unemployment is falling among seniors, but the rising numbers in this age group enrolling at the job centre (Table 1) undoubtedly reflects a change in their job search behaviour: more and more of them are no longer making a job search and are now classified in the “halo” of unemployment.

Ultimately, the fall in the ILO-defined unemployment rate, which is marked by both a lack of recovery in employment and discouragement among some of the unemployed, is not such good news.


[1] People registered in Class A have not worked at all, even on reduced hours, unlike those registered in Classes B and C.

[2] To be entitled to unemployment compensation and to receive back-to-work assistance (“ARE”), 122 days of affiliation or 610 hours of work must be shown during the 28 months preceding the end of the job contract.


Unemployment figures: the chill returns in April

By Analysis and Forecasting Department (OFCE-DAP)

While the slowing increase in the number of job seekers registered with France’s Pôle Emploi unemployment agency in the first quarter of 2015 could be seen as the premise of the long-awaited downturn in the unemployment curve, the figures released today once again cast doubt on this prospect, at least in the short term. The registration of 26,200 additional people in category A at the agency in April brings the increase in job seekers back to a high rate, well above the average over the last two years (13,400 per month) and far from the virtual stability seen in the first quarter (+3,000 per month).

While the publication of strong figures for first-quarter GDP growth (+ 0.6%) reaffirmed the prospect of a recovery, the jobless numbers are disappointing. Don’t forget, however, that employment does not immediately respond to a pick-up in activity; it will take time to reap the benefits for the labour market of the good growth experienced at the year’s beginning, when the recovery has proven to be strong, pushing employers to recruit. For now, companies are still digesting the overstaffing inherited from the period of very low growth between 2011 and 2014. The fall in unemployment that can be foreseen with the recovery will not take place until the second half of 2015. But the acceleration of job centre registrations in April sends a contrary signal.

The situation seems to be generally worsening among all sections of job seekers: men, women, and all age categories. The number of unemployed under age 25 has been rising again the last months (9,500 people). But changes like these are often volatile, and should be treated with caution: they come in counterpoint to an equivalent fall in numbers during the first two months of 2015. Over a one-year period, the increase was only 11,900, and the interruption in the rise in youth unemployment since April 2013 signalled success for the jobs policy targeted at this group (see the figure). The announcement by the Minister of Labour of the creation of 100,000 additional subsidized jobs reflects the government’s perhaps belated determination to beef up this programme at a time when the economic outlook is improving.

Gaphe_post1-06ang


The planetary alignment has not always been favourable to the euro zone countries

By Eric Heyer and Raul Sampognaro

In 2015, the euro zone economies will benefit from a favourable “planetary alignment” (with the euro and oil prices down and financial constraints on the economy easing), which should trigger a virtuous circle of growth. Over the previous four years (2011-2014), the “planetary alignment” that existed was in a diametrically opposite direction: the euro and oil prices were high, with financing conditions and the fiscal stance very tight.

In a recent article, we propose an evaluation of the impact of these four factors on the economic performance of six major developed countries since 2011 (France, Germany, Italy, Spain, the UK and USA).

It is clear from our analysis that the combination of these shocks explains a large part of the differences in growth recorded during the period 2011-2014 between the United States and the major European economies. A non-negligible part of this performance gap is explained in particular by the difference in the economic policies adopted, with a policy mix that has been much more restrictive in the euro zone than in the case of the US. In particular, a very sharp fiscal adjustment took place in the countries experiencing pressure on their sovereign debt, such as Spain and Italy. In addition, the effects of the pressure on sovereign debt were multiplied by financial fragmentation, which can be seen in the deterioration of private sector financing terms, whereas the quantitative easing measures taken by the Fed and the Bank of England helped to prop up financing conditions in these countries. It was not until Mario Draghi’s speech in July 2012 and the announcement of the OMT programme in September 2012 that the ECB’s actions were sufficient to reduce the financial pressure. While exchange rate trends tended to support activity in the euro zone throughout 2011-2014, the contribution of this factor depended on the way the various countries were integrated with global trade flows [1] and on the scale of wage disinflation, which was particularly pronounced in Spain. Finally, the rise in oil prices held back Europe’s growth, while it had less impact in the United States, which benefited from the exploitation of shale oil.

The cumulative loss in GDP was very significant in Spain (-10 points between 2011 and 2014), Italy (-7.5 points) and France (-5 points) and more moderate in the UK (‑3 points) and Germany (-2.5 points). In contrast, the cumulative impact since 2011 on growth in the United States was zero, suggesting that real growth in the US was in line with spontaneous growth [2] (Figure 1).

G1_post18-05_ENG

Thus, in the absence of these shocks, Europe’s spontaneous growth could have exceeded the rate of potential growth, as in the United States (Figure 2). This would have led in the euro zone countries in particular to a long-term convergence of GDP with its potential level, to a reduction in imbalances on the labour market, to the normalization of capacity utilization, and to a recovery in the public accounts.

G2_post18-05_ENG

Go to the full version of our study.


[1] The impact of these competitiveness shocks differs across countries because of differences in the elasticity of foreign trade, but also due to variations in the countries’ degree of exposure to trade and to intra / extra euro zone competition. For more on this, see Ducoudré and Heyer (2014).

[2] An economy’s spontaneous growth results from its long-term potential growth (which depends on structural factors that determine in particular changes in the global productivity of the factors and the labour force) and the rate of closing the output gap, which was deepened in most countries by the 2008-2009 crisis and which depends on an economy’s capacity to absorb the shocks that hit it.


The coming recovery

By the Analysis and Forecasting Department, under the direction of Eric Heyer and Xavier Timbeau

This text summarises the OFCE 2015-2016 economic outlook for the euro zone and the rest of the world

While up to now the euro zone had not been part of the global recovery, the conjunction of a number of favourable factors (the fall in oil prices and depreciation of the euro) will unleash a more sustained process of growth that is shared by all the EU countries. These developments are occurring at a time when the massive and synchronised fiscal austerity that had pushed the euro zone back into recession in 2011 is easing. The brakes on growth are gradually being lifted, with the result that in 2015 and 2016 GDP should rise by 1.6% and 2%, respectively, which will reduce unemployment by half a point per year. This time the euro zone will be on the road to recovery. However, with an unemployment rate of 10.5% at the end of 2016, the social situation will remain precarious and the threat of deflation is not going away.

The expected demand shock

After a period during the Great Recession of 2008-2009 when growth was boosted by expansionary fiscal policy, the euro zone countries quickly reversed their policy orientation and adopted a more restrictive one. While the United States also chose to reduce its budget deficit, austerity has had less effect there. First, the negative demand shock at the euro zone level was amplified by the synchronisation of the consolidation. Second, in a context of rising public debt, the lack of fiscal solidarity between the countries opened up a breach for speculative attacks, which pushed up first sovereign rates and then bank rates or the non-financial agents market. The euro zone plunged into a new recession in 2011, while globally the momentum for growth gathered pace in the other developed countries (chart). This episode of consolidation and financial pressure gradually came to an end. In July 2012, the ECB made a commitment to support the euro; fiscal austerity was eased in 2014; and the Member States agreed on a draft banking union, which was officially initiated in November 2014, with new powers on banking supervision entrusted to the ECB. All that was lacking in the euro zone then was a spark to ignite the engine of growth. The transfer of purchasing power to households that resulted from the fall in oil prices – about one percentage point of GDP if oil prices stay down until October 2015 – represents this positive demand shock, which in addition has no budget implications. The only cost resulting from the shock comes from the decline in income in the oil-producing countries, which will lead them to import less in the coming quarters.

An external demand shock will combine with this internal demand shock in the euro zone. The announcement of a quantitative easing programme in the euro zone represents a second factor accelerating growth. This programme, under which the ECB is to purchase more than 1,000 billion euros of securities at a pace of 60 billion per month until September 2016, not only will amplify the fall in sovereign yields but more importantly will also lead to a reallocation of portfolio assets and drive the euro (further) down. Investors looking for higher returns will turn to dollar-denominated securities, especially as the prospect of a gradual monetary tightening in the US improves the outlook for earnings on this side of the pond. The rising dollar will lift the currencies of the Asian countries with it, which will increase the competitive advantage of the euro zone at the expense this time of the United States and some emerging countries. It is unlikely that the fragility induced in these countries and in the oil-producing countries by the oil shock and by the decline in the euro will offset the positive effects expected in the euro zone. On the contrary, they will also be vectors for the rebalancing of growth needed by the euro zone.

Investment is the factor that will complete this growth scenario. The anticipation of higher demand will remove any remaining reluctance to launch investment projects in a situation where financing conditions are, overall, very positive, representing a real improvement in countries where credit constraints had weighed heavily on growth.

All this will lead to a virtuous circle of growth. All the signals should turn green: an improvement in household purchasing power due to the oil impact, increased competitiveness due to the lower euro, an acceleration in investment and, ultimately, growth and employment.

A fragile recovery?

While the elements promoting the euro zone’s growth are not mere hypotheticals about the future but represent a number of tangible factors whose effects will gradually make themselves felt, the fact remains that they are somewhat fragile. The falling price of oil, for instance, is probably not sustainable. The equilibrium price of oil is closer to USD 100 than USD 50 and, ultimately, a rise in energy prices is in the cards: what has a positive effect today could undermine the resumption of a recovery tomorrow. The decline of the euro seems more long-term; it should last at least until the end of the ECB’s quantitative easing programme, which officially is at least September 2016. The euro should not, however, fall below a level of 0.95 dollar per euro. The time it takes for changes in exchange rates to translate into trade volumes, however, should allow the euro zone to benefit in 2016 from a gain in competitiveness.

It is worth noting that a Greek exit from the euro zone could also put a halt to the nascent recovery. The firewalls set up at the European level to reduce that risk should limit any contagion, at least so long as the political risk has not been concretised. It will be difficult for the ECB to support a country where a party explicitly calling for leaving the euro zone is at the gates of power. The contagion that is now considered extinguished could then catch fire again and reignite the sovereign debt crisis in the euro zone.

Finally, the constraints of the Stability Pact have been shifted so as to leave more time to the Member States, particularly France, to get back to the 3% target. They have therefore not really been lifted and should soon be reinforced once it comes to assessing the budgetary efforts being made by the countries to reduce their debt.

G1_Post2804ang


Is France’s trade deficit entirely structural?

By Eric Heyer

The issue at the heart of the debate between those arguing that a lack of supply is behind the low level of activity in France over the last four years and those arguing that the problem is a lack of demand is the nature of the country’s trade deficit.

On the one hand, the French economy has a number of symptoms characteristic of an economy experiencing a shortfall in demand: strong disinflation, high unemployment, businesses declaring substantial spare capacity due mainly to a lack of demand, etc. But, on the other hand, the existence of a persistent deficit in the trade balance (Figure 1) casts doubt on the competitiveness of French firms and on their capacity to meet additional demand, which would thus express a problem with supply.

G1_Post1901ang

So, after more than ten years of trade surpluses, which represented over 2 GDP points in 1997, France’s trade balance turned negative in 2005. After widening gradually until 2010 when the deficit reached nearly 2 GDP points, the trend turned around. In 2013 (the latest available figure), the trade deficit still stood at 1 GDP point.

This observation is not however sufficient to dismiss all the arguments of the proponents of a demand shortage that France simply suffers from a supply problem. What is needed at a minimum is to analyze the nature of the deficit and try to separate its structural component from its cyclical component. The latter is the result of a difference in the economic cycle between France and its major trading partners. When a country’s situation is more favourable than that of its partners, that country will tend to run a deficit in its trade balance linked to domestic demand and thus to more buoyant imports. A trade deficit may thus arise regardless of how competitive the country’s domestic firms are.

One way to take this cyclical gap into account is to compare the gaps between an economy’s actual output and its potential output (the output gap). At the national level, a positive output gap (respectively negative) means that the economy is in a phase of expansion (respectively of contraction) of the cycle, which, other things being equal, should lead to a cyclical deterioration (or improvement) in its trade balance. In terms of the trading partners, when they are in a cyclical expansionary phase (positive output gap), this should lead to a cyclical improvement in the trade balance of the country in question.

Using data from the latest issue of the OECD’s Economic Outlook (eo96), we calculated an “aggregate” output gap for France’s partners by weighting the output gap of each partner by the weight of French exports to that country in France’s total exports.

This calculation, shown in Figure 2, highlights two points:

  1. The first is that, according to the OECD, France’s output gap has been negative since 2008, signalling the existence of room for the French economy to rebound.
  2. The second is that the economic situation of our trading partners is even worse. The cyclical gap, measured by the difference between the output gaps of France and of its partners, indicates a significant difference in favour of France.

G2_Post1901ang

It is then possible to assess the impact of the cyclical situation of the country and that of its main partners on the trade balance.

A simple estimate using Ordinary Least Squares over the period 1985-2013 shows a relationship of cointegration between these three variables (trade balance, output gap of France and output gap of its partners) for France. The signs obtained are consistent with what we would intuitively expect: when France is in an expansionary phase, its trade balance tends to worsen (coefficient of -0.943). In contrast, when rival countries are experiencing a boom, this makes for an improvement in France’s trade balance (coefficient of +0.876).

France’s structural trade balance since 1985 can then be calculated by subtracting the cyclical effect (national and competitors) from the observed trade balance.

Figure 3 shows this calculation. First, the fall in the euro in the late 1990s led to a structural improvement in France’s structural balance. The sharp deterioration in the trade balance between 2001 and 2007 would then be entirely structural: it would be explained in particular by China’s entry into the WTO, by the competitive disinflation policy adopted by Germany, and by the appreciation of the euro. Since the 2008 crisis, however, an increasingly substantial portion of the French trade deficit would be cyclical. So even if French growth were sluggish, the country’s economic difficulties were nonetheless less dramatic than in the case of some of its trading partners[1]. It is this relatively more favourable performance compared to its major trading partners that would have led to the rise of a trade deficit, part of which was cyclical. By 2013, the imbalances in the current account would be entirely cyclical in origin.

G3_Post1901ang

This result echoes the analysis provided by the French national accounting office on the factors driving growth over the last four years: the level of real GDP in the third quarter of 2014 was only 1.4% higher than in first quarter 2011. An analysis of the factors contributing to this performance is unambiguous: private demand (household and business) was down sharply (-1.6%), particularly household consumption, the traditional engine of economic growth. While there are more households today than four years ago, their total consumption was 0.6% below their 2011 level. However, while the French economy’s ability to deal with the global competitive framework is being questioned by the dominant discourse, foreign trade has in fact had a very positive impact in the last four years, with a boost from exports, which contributed a positive 2 GDP points to growth. In short, for four years the French economy has been driven mainly by exports, while it has been held back by private demand.

This analysis is of course based on an assessment of output gaps, whose measurement is tricky and subject to sharp revisions. In this respect, while there is an institutional consensus on the estimate that France has a negative output gap, there is also a broad range in the magnitudes of the room for a rebound, ranging in 2014 from 2.5 to 4 points, depending on the institution (IMF, OECD, European Commission, OFCE).

This diagnosis would be somewhat attenuated if an output gap were used for France that was more negative than the one calculated by the OECD: using the OFCE’s estimate for France (an output gap of -2.9 GDP points in 2013 instead of the OECD’s -1.4 points) and retaining the OECD measure for its partners, France’s more favourable relative performance compared to its major trading partners would now explain only half of its trade deficit[2]. Part of the deficit observed would therefore be explained by the competitiveness problems of French business (Figure 4).

G4_Post1901ang

In conclusion, as with any measurement of a structural variable, the evaluation of the structural trade balance is sensitive to the measure of the output gap. Nevertheless, it is clear from this brief analysis that:

  • If the French economy is considered to suffer mainly from a supply problem (output gap close to zero), whereas our partners, mainly European, face a shortfall in demand (negative output gap), then the deficit in our trade balance would essentially be cyclical.
  • However, if France, like its partners, is also experiencing a shortfall in demand, then only part of our deficit is cyclical, and the rest is related to a problem with the competitiveness of our companies.

This last point seems to us closer to the actual situation of the French economy. While French companies’ have undeniably lost some competitiveness, this should not be overestimated: the sluggishness that has characterized our economy for nearly four years is due not only to a lack of supply and the disappearance of the potential for growth – even if this is unfortunately likely to taper off – it is also due to a significant decline in demand.


[1] For example, Italy and Spain entered a second recession in third quarter 2014, leaving their GDP lower than its pre-crisis level by 9% and 6% respectively.

[2] We find a similar result when the previous version from the OECD (eo95) it used for France and all its partners.


Decline of the euro and competitive disinflation: who’s going to gain the most?

By Bruno Ducoudré and Eric Heyer

For nearly two years, between mid-2012 and mid-2014, the euro appreciated against the world’s major currencies. Having reached a level of USD 1.39 in May 2014, the euro had increased in value since July 2012 by more than 12% against the dollar. During the same period, the euro appreciated by 44% against the yen and more than 3% against the pound sterling.

Since May 2014, this trend has reversed: after rising by nearly 10% between mid-2012 and mid-2014, the real effective exchange rate for the euro, which weights the different exchange rates based on the structure of euro zone trade, has depreciated by 5.2% over the last six months (Figure 1). In fact, within a few months, the euro has lost nearly 10% against the dollar, more than 3% against the yen and 4% against the British pound. The weakening against the pound sterling actually began in August 2013, and has reached over 9% today. We expect the euro to continue to depreciate up to the beginning of 2015, with the single currency’s exchange rate falling to 1.20 dollars in the second quarter of 2015.

GRAPH1_postENG05-11

For many business people and economics experts, this decline in the euro represents an opportunity to escape the deflation trap currently threatening the euro zone. Faced with sluggish growth in the zone and an inflation rate that is falling dangerously low, the announcement by the European Central Bank of a quantitative easing programme indicates its willingness to devalue the euro against other currencies in order to support Europe’s growth and meet its inflation target.[1] The French government also expects a great deal from the euro’s depreciation.[2] The Treasury Department believes[3] that a 10% decrease in the effective exchange rate of the euro (against all currencies) would increase our GDP in the first year by 0.6 percentage point, creating 30,000 jobs, reducing the public deficit by 0.2 GDP point and pushing up consumer prices by 0.5%.

The revival of short-term growth in the euro zone through a depreciation of the euro’s effective exchange rate would also limit the non-cooperative policy of competitive disinflation being implemented in southern Europe (Greece, Spain, Portugal). While European countries trade mostly with each other and compete sharply for export markets, the effort to improve competitiveness through a disinflation policy is bound to fail in the euro zone if all the members adopt the same strategy. This is, however, the strategy chosen by the European Commission, i.e. by pushing the countries in crisis to reform their labour markets and cut labour costs. In this light, the depreciation of the euro is needed to support structural reform in Europe and support demand [4] even as fiscal austerity policies are further undermining it.

In a recent study, we attempted to assess the effects expected from the depreciation of the euro. We are interested not in the reasons for the variations in the euro (differential performance, behaviour of central banks) but in its macroeconomic implications (in particular its impact on GDP, prices and employment). To assess the sensitivity of exports to price competitiveness for six major OECD countries (France, Germany, Italy, Spain, United States, United Kingdom), we made estimates using new foreign trade equations that distinguish, within the euro zone, intra-zone trade and extra-zone trade. The elasticities obtained are consistent with the existing literature on this subject. It is necessary to make a joint estimation of the equations for export volumes and import prices: this provides a feedback loop in partial equilibrium for a change in the effective exchange rate on import volumes and export volumes. Taking into account the marginal behaviour of importers and exporters tends to limit the effect of a change in the effective exchange rate on the volumes of imports and exports when these have little market power. Simulations show that, in the euro zone, Spain would have the most to gain from a depreciation in the euro’s exchange rate against other currencies, but also from a policy of competitive disinflation (case where Spain’s export prices grow more slowly than the export prices of its euro zone rivals) (Table 1).

TAB1_post04-11ang


For the French economy, we also carried out a more detailed analysis using the OFCE’s macroeconomic model emod.fr, with the goal of comparing our results with those obtained by the French DG Treasury with the Mésange model.

Our results show that a 10% depreciation of the euro against all currencies leads to a gain in price competitiveness for export to France vis-à-vis the rest of the world. The other euro zone countries experience the same gain in competitiveness across all export markets. In this case, the effect on activity would be +0.2% the first year, and +0.5% after three years. Excluding the effect due to the change in price competitiveness, the increased demand resulting from the pick-up in activity among our European partners would be broadly offset by lower demand addressed to France from the rest of the world. On the labour market, the depreciation would create 20,000 jobs in the first year, and 77,000 jobs after three years. The public deficit would improve by 0.3 GDP point in three years (Table 2).

TAB2_post04-11ang

Finally, we simulated the effect of a 10% increase in the prices of our competitors in the euro zone on the whole of France’s export markets. This 10% improvement in price competitiveness vis-à-vis the other euro zone countries would have a positive effect on activity via an increase in exports, investment and employment (Table 3). The impact on activity would be +0.4% in the first year and +0.9% after three years. It would be zero after 10 years. Nearly 130,000 jobs would be created in a period of 3 years and the government deficit would improve by 0.5 GDP point over this period.

TAB3_post04-11ang


[1] See C. Blot and F. Labondance, “Why a negative interest rate?”, Blog de l’OFCE, 23 June 2014.

[2] See the speech by Prime Minister F. Hollande on 5 February 2013 to the European Parliament.

[3] Economic and Social Report of France’s 2014 draft budget bill.

[4] See the speech by M. Draghi “Unemployment in the euro area”, Jackson Hole, 22 August 2014.