Inequality in Europe

By Guillaume Allègre

In the preamble to the Treaty establishing the European Economic Community, the Heads of State and Government declare that they are “[r]esolved to ensure the economic and social progress of their countries by common action to eliminate the barriers which divide Europe”. Article 117 adds that “Member States agree upon the need to promote improved working conditions and an improved standard of living for workers, so as to make possible their harmonisation while the improvement is being maintained”. Sixty years after the Treaty of Rome, what is the state of economic and social inequality in Europe? How did this change during the crisis?

Every year Eurostat measures inequality in the different EU Member States. The Great Recession has led to widening inequality within the countries of Europe. The Gini index of equivalent disposable income rose from 30.6 in 2007 to 31 in 2015 on average in the 28 EU Member States. However, part of the increase is due to large breaks in the series in France and Spain in 2008. Inequality is thus clearly lower in Europe than in the United States: for 2014, the Gini index of disposable income is estimated at 39.4 in the United States, while in the European Union it ranges from 25 (Czech Republic) to 37 (Bulgaria). The United States is therefore more unequal than any country in the EU and much more unequal than most countries.

However, the presentation of an average Gini index in the European Union may be misleading. Indeed, it takes into account only inequalities within the European countries and not inequalities between countries. However, there are significant inequalities between European countries. In the national accounts, household income based on EU consumer purchasing power in 2013 ranged from 37% of the European average (Bulgaria) to 138% (Germany), i.e. a ratio of 1 to 4.

At the European level, Eurostat calculates an average of national inequalities, as well as the international inequalities. On the other hand, Eurostat does not calculate inequalities between European citizens: what would inequality be if national barriers were eliminated and European inequality was calculated at the European level in the same way that one calculates inequality within each nation? It might seem legitimate to calculate inequality between European citizens like this insofar as the European Union constitutes a political community with its own institutions (Parliament, executive, etc.).

The EU-SILC database, which provides the equivalent disposable income (in purchasing power parity) of a representative sample of households in each European country makes such a calculation possible. The result is that the overall level of inequality in 2014 in the European Union is the same as that in the United States (graph). What conclusion should be drawn? If we look at the glass as half-empty, we could emphasize that European inequality is at the same level as in the world’s most unequal developed country. If we look at the glass as half-full, we could emphasize that the European Union does not constitute a nation with social and fiscal transfers, that it has recently expanded to include much poorer countries and that, nevertheless, inequality is no greater than in the United States.

inequalities

Overall inequality in the European Union can be seen to decline slightly between 2007 and 2014. The Theil index, another indicator of inequality, can be used to break down the change in European inequalities between what comes from changes in inequality between countries and what comes from changes within countries. Between 2007 and 2014, the Theil index fell from 0.228 to 0.214 (-0.014). Inequality within countries was generally stable (+0.001) whereas inequality between countries declined (-0.015). These developments are similar to what has been observed by Lakner and Milanovic at the global level (“Global Income Distribution: From the Fall of the Wall to the Great Recession“): rising national inequalities and declining inequalities between countries (in particular due to China and India catching up).

So far, the main instrument used by the European Union to reduce inequality in Europe has been the opening of borders. But while opening up borders can help the EU’s less affluent countries (notably Bulgaria and Poland) to catch up, it can also have an impact on inequality within countries. However, Europe does not as yet have a social policy. This sphere falls above all within the competence of the States. But opening up the borders is exacerbating social and fiscal competition. For instance, the higher marginal rates of personal income tax (IRPP) and corporate income tax (IS) have dropped significantly since the mid-1990s, while the VAT rate has increased (A.Bénassy-Quéré et al., “Reinforcing tax harmonization in Europe” [in French]).

In France, the government has committed to lower the corporate income tax rate from 33.3% to 28% by 2020. This follows a trend towards lowering taxation on business but raising it on households. The impact on inequality has so far been counterbalanced by the fact that the rise in taxation has focused on the wealthiest households. However, the French Presidential candidates Fillon and Macron advocate a substantial reduction in the taxation of capital income (withholding tax and the reduction of the ISF wealth tax on real estate for Macron; elimination of the wealth tax for Fillon) in the name of competitiveness. The dangers of fiscal and social competition are thus beginning to make themselves felt.


Redistributive policies and the demand for fairness

par Gilles Le Garrec

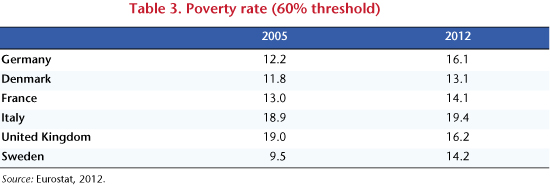
Six years after the onset of the Great Recession, France’s economic situation is still gloomy: growth is sluggish, there are almost 3.5 million unemployed in mainland France, and the public debt is approaching the threshold of 100% of GDP (95.4% according to the 2014 Maastricht criteria according to the OFCE). One cause for satisfaction has been the ability of the social protection system to mitigate the increase in income inequality. The Gini index [1] calculated on the labour force (population age 18 to 65) shows that, between 2008 and 2011, inequality in market income increased by 2.9 percentage points while inequality in disposable income increased by only 1.8 points. To achieve this, social spending rose by 0.8 point, bringing it to 19% of GDP excluding old-age pension expenditures [2]. However, one of the fears associated with the crisis (due to its duration and magnitude) is that France can no longer afford to provide people with such a high level of social protection. Is this fear justified? Not necessarily.

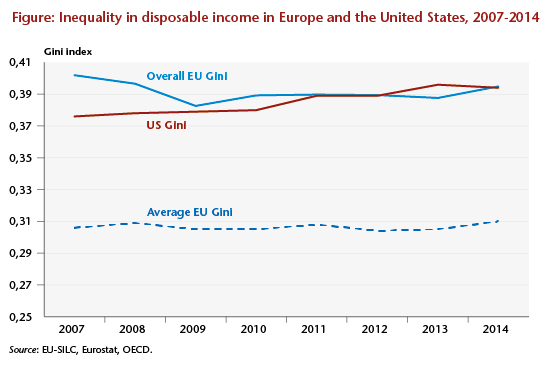
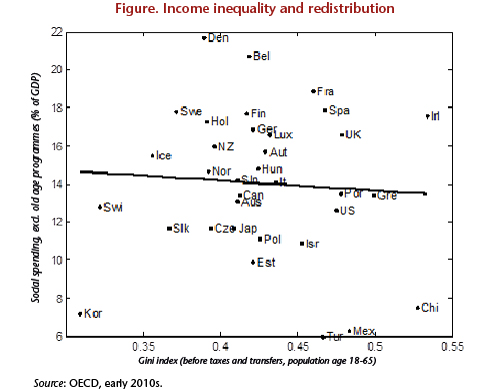
Starting from the premise that in a democracy a policy can be carried out only if it has the majority support of its citizens, Meltzer and Richard (1981) suggest that increasing inequality leads to an increasing demand for redistribution, not because people have an aversion to inequality, but rather because they are motivated by their own interests. Therefore the poorer the median individual becomes in terms of income [3] compared to the average population, i.e. as the income distribution becomes more unequal, the greater will be that individual’s interest in income redistribution. In this perspective, the increasing inequality generated by the economic crisis should result in an increase in social spending. Redistribution is thus not inflicted, but instead should have the support of a majority of the citizens. Though attractive in its simplicity, this explanation suffers from a major flaw: the data does not show any positive correlation between income inequality and redistribution. Typically, the level of inequality measured by the Gini index (before taxes and transfers) is 0.46 in France with respect to the labour force, versus 0.475 in the US, where the level of social spending is only 13% of GDP[4]. More generally, and as is illustrated in Figure 1, this presumed correlation proves to be zero or even negative (see Perotti 1996 for an empirical review). To understand the possible weaknesses of the French social protection system, the analytical framework proposed by Meltzer and Richard (1981) will not be sufficient.

G1_Post1602_ang

This discrepancy between the observed facts and the theory has spawned several lines of research[5]. In particular, the assumption that individuals are motivated solely by self-interest has been challenged by a large number of laboratory experiments. Take, for example, the ultimatum game. In this game, two anonymous subjects must agree on how to divide a sum of money. The first participant must make an offer to share the sum. The second can then either accept or reject the offer. If he accepts, then the two share, otherwise neither gets anything. In theory, the first player, knowing that any positive offer will be accepted, should always offer the second player as little as possible. Contrary to this prediction, the results of the experiment show that many people offer 50% of the total to the second player, with an average offer of around 40%. Furthermore, any offer of less than 25% of the total has a high chance of being rejected. These results demonstrate behaviours characterized by a sense of distributive justice. When people are asked outside the laboratory setting about the reasons why someone would favour redistribution, this is the particular reasoning given. Survey data also underscore that individuals tend to give greater support to redistribution when they think that poverty is caused by factors for which the victims are not responsible (see Fong, 2001). In line with these results, the belief that luck rather than effort determines income proves to be a better predictor than income inequality of how much redistribution takes place in a country.

Thus, in order to determine the ways in which concern for others can explain the differences in redistribution observed between democracies, the theoretical literature has focused on the formation of beliefs. In the approach of Alesina and Angeletos (2005), individual preferences combine personal interest and the demand for fairness. Specifically, fairness is defined according to the principle that each person should get what they deserve. Knowing that income depends on both luck and the effort exerted, the authors argue that the differences between the amounts redistributed in different countries result from different self-fulfilling beliefs. Americans, expecting little redistribution, invest more in their human capital and thus create the conditions for a low level of redistribution because the role of chance is reduced in the determination of income. Conversely, Europeans, expecting strong redistribution, invest less in their human capital. Luck is thus more important in the determination of income; individuals will therefore support strong redistribution in accordance with the principle of fairness. Furthermore, assuming that Americans and Europeans share the same preferences, Alesina and Angeletos highlight an important result: the low-redistribution American model is preferred by a majority of citizens over the European model because it produces less distortion and thus results in a higher overall income. However, this does not mean that poor people do not prefer the model with strong redistribution.

In contrast to this result which is based on the assumption that Americans and Europeans share identical preferences, Corneo (2001) showed that West Germans incorporated collective motivations into their preferences, whereas Americans were motivated only by their own interests. The intensity of a collective motivation is thus culturally determined.

In this context, building on the approach proposed by Alesina and Angeletos (2005), Le Garrec (2014) has offered a mechanism for the cultural transmission of the intensity of the demand for fairness. In accordance with the socialization process, a person’s observation during childhood of the previous generation’s inability to develop a fair redistribution policy will reduce the moral cost to that person of not supporting a fair policy later in life. When someone is socialized in an environment characterized by a fair redistributive policy, the demand for fairness remains strong in the person’s preferences: a system with strong redistribution (as in France) is perennial and perpetuated from generation to generation. Conversely, if people are socialized in an environment where the redistributive decisions deviate significantly from distributive justice, the internalization of the norm “individual success comes first” reduces the weight of the moral imperative in their preferences. In this case, a system with little redistribution (as in the US) is also sustainable. In Le Garrec (2014), the choice of a system will therefore depend on the respective histories of the nations[6].

In light of the way the canonical model of Meltzer and Richard (1981) has been extended, based on the demand for fairness observed at the individual level, can we understand the concerns expressed about the future of the French social welfare model, that is to say, a model characterized by strong redistribution? First note that in the later developments of the model, since individuals are motivated in part by their own interests, the Meltzer-Richard effect continues to exist. Rising inequality tends to increase the level of redistribution, and this receives majority support in both Europe and the United States. However, based on the Alesina-Angeletos approach, the depth of the economic crisis could weaken the French model if it leads people to believe that it can no longer be financed. In this situation, the belief could become self-fulfilling and eventually lead to a sharp reduction in the generosity of the welfare system, with a shift towards a US-style system. This interpretation of the Alesina-Angeletos model (2005) is all the more credible as the low-distribution American model seems to be preferred by most Europeans. The exposure that could result from the crisis could then serve to change beliefs. This perspective, however, is not present in Le Garrec (2014), and rightfully so as preferences co-evolve with the social protection system. A French person will (on average) prefer strong redistribution because his or her preferences express a strong demand for fairness. From this point of view, the high redistribution model, like the low redistribution one, seems very durable. Nevertheless, in Le Garrec (2014) the sustainability of the high redistribution model requires a minimum consensus in society on the causes of injustice in order to ensure a moral standard that is relatively strong. However, the economic crisis in Europe is characterized precisely by strong disagreement about its origins: excessive debt on the part of households or government, fiscal austerity, monetary conservatism, divergence in competitiveness with a single currency, a lack of solidarity among nations, etc. From this perspective, the crisis could jeopardize the French model by weakening moral standards. Ultimately, in contrast to the approach of Meltzer and Richard (1981), the approaches of Alesina and Angeletos (2005) and Le Garrec (2014), which go more deeply into people’s motivations, offer keys to a different and complementary understanding of the potential dangers that could face the French social security system as a result of the economic crisis.


References

Acemoglu D., Naidu S., Restrepo P. and Robinson J. (2013), Democracy, redistribution and inequality, NBER WP 19746.

Alesina A. and Glaeser E. (2004), Fighting poverty in the US and Europe: A world of difference, Oxford University Press.

Alesina A. and Angeletos G.-M. (2005), Fairness and redistribution: US versus Europe, American Economic Review, 95(4), pp. 960-980.

Corneo G. (2001), Inequality and the State: Comparing US and German preferences, Annals of Economics and Statistics, 63/64, pp. 283-296.

Fong C. (2001), Social preferences, self-interest, and the demand for redistribution, Journal of Public Economics, 82(2), pp. 225-246.

Le Garrec (2014), Fairness, socialization and the cultural demand for redistribution, OFCE WP 2014-20.

Meltzer A. and Richard S. (1981), A rational theory of the size of government, Journal of Political Economy, 89(5), pp 914-927.

Perotti R. (1996), Growth, income distribution and democracy: what the data say, Journal of Economic Growth, 1(2), pp. 149-187.


[1] The Gini index is based on a comparison between proportions of the population and their combined income. A value of 0 represents perfect equality, a value of 1 complete inequality.

[2] As the pension system is not aimed at reducing income inequality, but at providing deferred wages on the basis of what has been paid in, it is best to remove these expenditures in order to properly assess the capacity of social spending to reduce these inequalities.

[3] 50% of individuals have an income that is higher than this person’s, and 50% lower.

[4] Social spending (and taxation) is also less progressive in the United States than in France. Thus, social spending of 1% of GDP would reduce the Gini index by 1.74% in France compared with 1.46% in the United States.

[5] See Alesina and Glaeser (2004) and Acemoglu et al. (2013) for an overview of the various extensions made to the canonical model.

[6] It is beyond the scope of this note to analyze the historical facts that would help explain the convergence towards one type of social protection model rather than another. For this, please refer to the work of Alesina and Glaeser (2004).


Is the French tax-benefit system really redistributive?

By Henri Sterdyniak [1]

France has set up benefits such as RSA income support, PPE in-work negative income tax, CMU universal health care, the minimum pension, housing allowances, and exemptions from social security contributions for low-wage workers. From the other side, it has a tax on large fortunes; social insurance and family contributions apply to the entire wage; and capital income is hit by social security contributions and subject to income tax. France’s wealthy are complaining that taxation is confiscatory, and a few are choosing to become tax exiles.

Despite this, some people argue that the French tax-benefit (or socio-fiscal) system is not very redistributive. This view was recently lent support by a study by Landais, Saez and Piketty: the French tax system is not very progressive and even regressive at the top of the income hierarchy [2]: the richest 0.1% of households are taxed at a very low rate. But redistribution through the tax-benefit system is effected not just through taxes but also through social benefits. We must therefore look at both these aspects to evaluate how redistributive the system is. This is especially true as Landais, Saez and Piketty take into account the VAT paid on consumption financed by social benefits, but not the benefits themselves, meaning that the more a poor household benefits (and spends) from social benefits, the more it seems to lose on redistribution.[3]

Four researchers from Crédoc, the French Research Center for the Study and Monitoring of Living Standards, have published a study [4] that takes benefits into account. They nevertheless conclude: “The French tax system, taken as a whole, is not very redistributive.” The study uses post-redistribution standard-of-living deciles to review the benefits received and the taxes paid by households (direct taxes, indirect taxes and social contributions) as a percentage of disposable income, and compares France, Italy, the United Kingdom and Sweden. In France, net transfers (levies less benefits) represent only 23% of household disposable income in the first standard-of-living decile (the poorest), against 50% in the United Kingdom (see figure). At the other end of the scale, in France transfers lower the disposable income of the richest households by only 6%,  versus 30% in the UK, 40% in Sweden, and 45% in Italy. France is thus considered to have the lowest level of redistribution, with little distributed to poor people and low taxes on the rich.

IMG_post_Henri_17-12_English

Yet the French tax-benefit system is considered by international institutions as one of those that minimize inequalities the most. For instance, the OECD (2011) wrote: “Redistribution through taxes and benefits reduces inequality by just over 30% in France, which is well above the OECD average of 25%”.

The OECD provides statistics on income inequality (measured by the Gini coefficient) before and after transfers. Of the four countries selected by the Crédoc, it is France where the Gini is reduced the most as a percentage by transfers (Table 1), to an extent equivalent to the level in Sweden, and significantly greater than the reduction in Italy and the UK. Euromod winds up with a substantially similar classification (Table 2).

TAB1_English_HS_17_12

TAB2_English_HS_17_12

TAB3_English_HS_17_12

The Portrait social [Social Portrait] by the INSEE provides a careful summary of how redistributive the French socio-fiscal system is (Cazenave et al., 2012). It seems that inequality is reduced significantly (Table 4) in France: the inter-decile ratio (D10/D1) falls from 17.5 before redistribution to 5.7 afterwards.[5] According to the INSEE, 63% of the reduction in inequality comes from social benefits and 37% from levies, which confirms the need to take benefits into account in order to assess redistribution.

TAB4_English_HS_17_12

The vision presented by Crédoc of the redistributivity of the French tax-benefit system is thus unusual… and, to put it frankly, wrong.

The study is based on data from the Budget des familles [Family budget] survey that is not matched with fiscal data and which is generally considered less reliable than the Euromod survey or than the tax and social security figures used by the INSEE. This may explain some important differences between the Crédoc figures and those of the INSEE: for example, according to the INSEE, non-contributory transfers represent 61% of the disposable income of the poorest 10%, but only 31% according to Crédoc (Table 5).

Like the INSEE, the Crédoc study ignores employer national health insurance contributions (which hit high wages in France, unlike most other countries) and the ISF wealth tax (which exists only in France). Furthermore, it does not distinguish between contributory contributions (which give rights to a pension or unemployment benefits) and non-contributory contributions (such as health insurance or family contributions), which do not give rights. However, low-wage workers are not hit by non-contributory contributions in France, as these are more than offset by exemptions from social security contributions on low wages.

TAB5bis_English_HS_17_12

Most importantly, the study contains two errors that heavily distort the conclusions. The first methodological error is that, contrary to the INSEE, the authors include contributory transfers, in particular pensions [6], in social transfers. But for retirees, public pensions represent a very large part of their disposable income, particularly in France. Since the pension system ensures parity in living standards between retirees and active employees, then retirees show up in all the standard of living deciles and the tax-benefit system does not seem to be very redistributive, as it provides benefits to wealthy retirees. And contrariwise, if a country’s pension system does not assure parity in living standards between retirees and active employees, then the tax-benefit system will seem more redistributive, as it provides pensions only to the poor.

So paradoxically, it is the generosity of the French system towards pensioners and the unemployed that makes it seem to be not very redistributive. Thus, according to Crédoc, the richest 10% receive contributory transfers representing 32% of their disposable income, which means that, in total, their net transfers represent only a negative 6% of their income. This is especially the case as Crédoc does not take into account the old-age pension contributions (cotisations vieillesse) incurred by businesses. If, as the INSEE does, pensions (and more generally all contributory benefits) are considered as primary income, resulting from past contributions, the negative net transfers of the richest decile increase from -6% to -38%.

The other methodological problem is that Crédoc claims to take into account the weight of indirect taxes in disposable income (which INSEE does not). This comes to 36% for the poorest 10%, 23% in the middle of the income hierarchy, and only 13% for the best-off. The highly regressive nature of indirect taxes would make the whole tax system regressive: the poorest pay more than the rich. According to the figures from Landais, Saez and Piketty (2011), indirect taxation is definitely regressive (15% of the disposable income of the poorest, and 10% for the richest), but the gap is only 5%. According to the INSEE [7], the weight of indirect taxes in disposable income is 22% for the poorest, 16% in the middle income range and 10% for the richest. This difference comes from the structure of consumption (the poorest consume relatively more tobacco and petroleum products), and especially the savings rate, which increases as households earn more. In fact, the difference is undoubtedly overstated in an inter-temporal perspective: some households will consume today’s savings tomorrow, so it is then that they will be hit by indirect taxation. In fact, the Crédoc study heavily overestimates the weight of indirect taxes by using an extravagant estimate of the household savings rate [8]: the overall French household savings rate is -26.5%; only decile D10 (the richest 10%) have a positive savings rate; decile D1 has a negative savings rate of -110%, that is to say, it consumes 2.1 times its income. The poorest decile is thus hit hard by the burden of indirect taxes. But how likely is this savings rate?

National tax-benefit systems are complex and different. Comparisons between them need to be made with caution and rigour. To judge how redistributive the French system actually is, it is still more relevant to use the work of the INSEE, the OECD or Euromod than this (too) unusual study.


[1] We would like to thank Juliette Stehlé, who provided assistance in clarifying certain points in this note.

[2] See Landais C., T. Piketty and E. Saez, Pour une révolution fiscal [For a tax revolution], Le Seuil, 2011.

[3] See also Sterdyniak H., “Une lecture critique de l’ouvrage Pour une révolution fiscal” [A critical reading of the work Pour une révolution fiscal]Revue de l’OFCE, no. 122, 2012. Note also that you cannot arrive at an overall judgment on the progressivity of the system from the case of a few super-rich who manage to evade taxes through tax schemes.

[4] Bigot R, É. Daudey, J. Muller and G. Osier: “En France, les classes moyennes inférieures bénéficient moins de la redistribution que dans d’autres pays” [In France, the lower middle classes benefit less from redistribution than in some other countries], Consommation et modes de vie, Crédoc, November 2013. For an expanded version, see: “Les classes moyennes sont-elles perdantes ou gagnantes dans la redistribution socio-fiscale” [Are the middle classes losers or winners from the tax-benefit redistribution], Cahiers de Recherche, Crédoc, December 2012.

[5] Also note that the INSEE underestimates somewhat the redistribution effected by the French system since it does not take into account the ISF wealth tax. It also does not include employers’ national health insurance, which in France is strongly redistributive as it is not capped. From the other side, it does not take account of indirect taxes.

[6] And replacement income such as unemployment benefits and sickness benefits.

[7] See Eidelman A., F. Langumier and A. Vicard: “Prélèvements obligatoires reposant sur les ménages:

des canaux redistributifs différents en 1990 et 2010” [Mandatory taxes on households: different channels of redistribution in 1990 and 2010], Document de Travail de la DESE de l’INSEE, G2012/08.

[8] Estimation from EUROMOD (2004): “Modelling the redistributive impact of indirect taxation in Europe”, Euromod Working paper, June.