By Mathieu Plane
Is France implementing an austerity policy? How can it be measured? Although this question is a subject of ongoing public debate, it hasn’t really been settled. For many observers, the relative resilience of wage dynamics indicates that France has not carried out an austerity policy, unlike certain neighbours in southern Europe, in particular Spain and Greece, where nominal labour costs have fallen. Others conclude that France cannot have practiced austerity since government spending has continued to rise since the onset of the crisis[1]. The 50 billion euros in savings over the period 2015-17 announced by the Government would therefore only be the beginning of the turn to austerity.
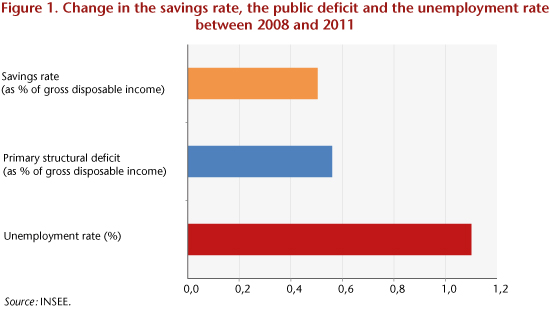
Furthermore, if we adhere to the rules of the Stability and Growth Pact, the degree of restriction or expansion of a fiscal policy can be measured by the change in the primary structural balance, which is also called the fiscal impulse. This includes on one side the efforts made on primary public spending (i.e. excluding interest) relative to the change in potential GDP, and on the other side the change in the tax burden in GDP points. Thus, over the period 2011-13, France’s primary structural balance improved by 2.5 percentage points of GDP according to the OECD, by 2.7 points according to the European Commission, and by 3.5 points according to the OFCE. While there are significant differences in the measurement of fiscal austerity during this period, the fact remains that, depending on the method of calculation, it amounted to between 55 and 75 billion euros over three years[2].
A different way of measuring the extent of fiscal austerity involves looking at the change in the components of household purchasing power. Purchasing power can in fact be used to identify the channels for transmitting austerity, whether this is through labour income or capital, benefits or the tax burden on households[3]. Changes in the components of income clearly show that there was a pre-crisis and a post-crisis in terms of the dynamics of purchasing power per household.
Over the period 2000-2007, purchasing power grew by more than 4000 euros per household …
This corresponds to an average increase of about 500 euros per year per household [4] (Table) over the eight years preceding the subprime crisis, a growth rate of 1.1% per year. On the resource side, real labour income per household (which includes the EBITDA of the self-employed), supported by the creation of more than 2 million full-time equivalent jobs over the period 2000 to 2007, increased on average by 0.9% per year. But it is above all real capital income per household (which includes the imputed rents of households occupying the accommodation that they own) that increased dramatically over this period, rising twice as fast (1.7% on average per year) as real labour income. As for social benefits in cash, these increased by 1% on average in real terms in this period, i.e. a rate equivalent to the rate for total resources. As for levies, tax and social contributions from 2000 to 2007 have helped to reduce purchasing power per household by 0.9 points per year, which corresponds to about 100 euros per year on average. Breaking down the increase in levies, 85% came from social contributions (employees and self-employed), mainly due to hikes in premiums related to pension reform. Taxes on income and wealth contributed to cutting purchasing power per household by only 14 euros per year, despite a sharp increase in capital income and property prices over the period 2000-2007. During this period, taxes on households deflated by consumer prices increased by less than 2%, whereas real household resources grew by almost 9% and real capital income by 14%. The reduction in income tax, which began under the Jospin government, and was continued by Jacques Chirac during his second term, explains in large part why taxes have had so little negative impact on purchasing power during this period.
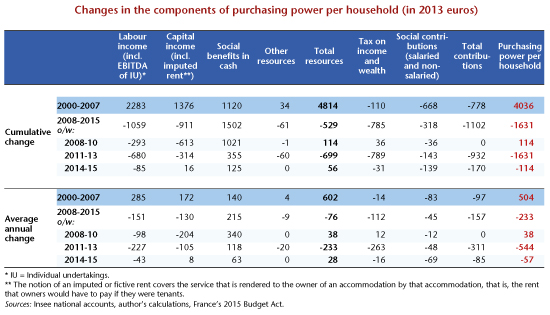
…but over the period 2008-2015, purchasing power per household fell by more than 1600 euros
The crisis marks a sharp turn with respect to past trends. Indeed, over the period 2008-2015, purchasing power per household fell, on average, by almost 1630 euros, or 230 euros per year.
Over the eight years since the start of the crisis, we can distinguish three sub-periods:
– The first, from 2008 to 2010, following the subprime crisis and the collapse of Lehman Brothers, is characterized by the relatively high resistance of purchasing power per household, which increased by nearly 40 euros per year on average, despite the loss of 250,000 jobs over this period and the sharp decline in capital income (200 euros on average per year per household). On the one hand, the sharp drop in oil prices from mid-2008 had the effect of supporting real income, including real wages, which increased 0.9% annually. On the other hand, the stimulus package and the shock absorbers of France’s social security system played their countercyclical role by propping up average purchasing power through a sharp rise in social benefits in kind (340 euros on average per year household) and a slightly positive contribution by taxes to purchasing power.
– The second period, from 2011 to 2013, is marked by intense fiscal consolidation; this is a period in which the tax burden increased by about 70 billion euros in three years, with a massive impact on purchasing power. Higher tax and social security charges wound up eroding purchasing power by 930 euros per household, more than 300 euros on average per year. Moreover, the very small increase in employment (+32,000) and stagnating real wages, combined with the impact of an increase in the number of households (0.9% annually), led to a reduction in real labour income per household of almost 230 euros per year. In addition, real capital income per household continued to make a negative contribution to purchasing power from 2011 to 2013 (-105 euros on average per year per household). Finally, although social benefits were slowing compared to the previous period, they were the only factor making a positive contribution to purchasing power (about 120 euros per year per household). In the end, purchasing power per household fell by 1,630 euros in three years.
– The third period, 2014 and 2015, will see yet another slight reduction in household purchasing power, amounting to about 110 euros in two years. The weak situation of employment and real wages will not offset the increase in the number of households. Thus, real labour income per household will decline slightly over the two years (-43 euros per year on average). Real capital income will, in turn, be roughly neutral in terms of its effect on purchasing power per household. Although they are not rising as much, tax and social contributions will continue to weigh on purchasing power due to the ramp-up of certain tax measures approved in the past (environmental taxes, higher pension contributions, local taxes, etc.). In total, the increase in the rate of levies on households in 2014-15 will reduce purchasing power per household by 170 euros. In addition, the expected savings on public spending will hold back growth in social benefits per household, which will rise by only about 60 euros per year on average, a rate that is half as high as the pre-crisis period despite the worsening social situation.
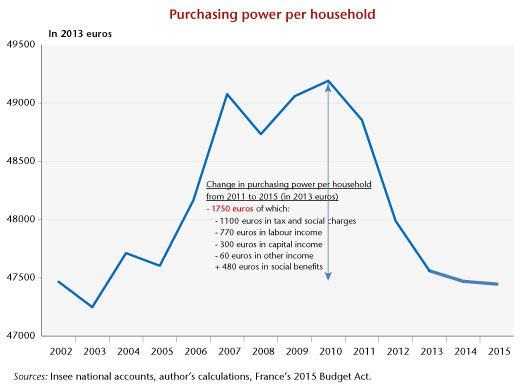
While this analysis does not tell us about the distribution per quantile of the change in purchasing power per household, it nevertheless provides a macro view of the impact of austerity on purchasing power since 2011. Out of the 1750 euros per household lost in purchasing power from 2011 to 2015 (see Figure), 1100 euros is directly related to higher taxes and social contributions. In addition to the direct impact of austerity, there is the more indirect impact on the other components of purchasing power. In fact, by cutting activity through the mechanism of the fiscal multiplier, France’s austerity policy has had a massive impact on the labour market, by either reducing employment or holding down real wages. While the magnitude is difficult to assess, the fact remains that real labour income per household fell by 770 euros in five years. Finally, while since the onset of the crisis social benefits have up to now acted as a major shock absorber for purchasing power, the extent of savings in public spending planned from 2015 (out of the 21 billion euros in savings in 2015, 9.6 billion will come from social security and 2.4 billion from spending on state interventions) will have a mechanical impact on the dynamics of purchasing power.
Thus, with purchasing power per household falling in 2015 to its level of thirteen years ago and having suffered a historic decline in 2011-13 in a period of unprecedented fiscal consolidation, it seems difficult to argue on the one hand that France has not practiced austerity so far and on the other hand that it is not facing any problem with short-term demand.
[1] Since 2011, the rate of growth of public spending in volume has been positive, but has halved compared to the decade 2000-10 (1.1% in volume over the period 2011-14, against 2.2% over the period 2000-10). Moreover, in the last four years, it has increased at a rate slightly below the rate of potential GDP (1.4%). From an economic point of view, this corresponds to an improvement in the structural balance due to an adjustment in public spending of 0.5 percentage point of GDP over the period 2011-14.
[2] These differences in the measurement of austerity come from differences in a number of evaluation factors, such as the level of potential GDP and its growth rate, which serve as the benchmark for calculating the structural fiscal adjustment.
[3] It is important to note that gross disposable income includes only income related to cash benefits (pensions, unemployment benefits, family allowances, etc.) but not social transfers in kind (health care, education, etc.) or public collective expenditures that benefit households (police, justice, defence, etc.).
[4] Here we use the concept of average purchasing power per household and not purchasing power per consumption unit.