OPEC meeting: Much ado about nothing?
par Céline Antonin
On 30 November 2017, OPEC members decided on a nine-month extension of their 2016 agreement on production caps with country quotas, i.e. until December 2018. Other producing countries associated with the agreement, led by Russia, decided to continue their cooperation by also extending their agreement on production cuts.
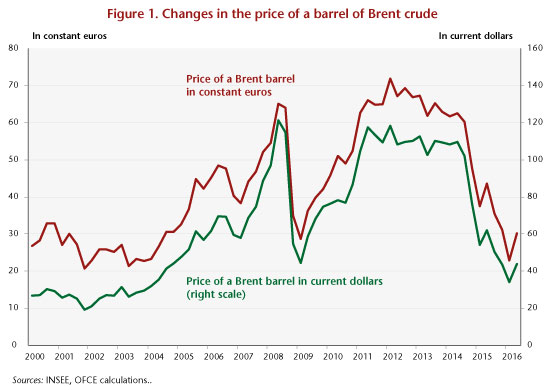
This decision was highly anticipated by the markets, and thus came as no surprise, especially since the display of unity barely concealed underlying divergences between some countries: there is on one side the relatively moderate position of Russia, which dragged its feet in signing the agreement, and on the other, the proactive stance of Saudi Arabia, which has resumed more active price management after several years of a more relaxed approach. The oil-producing countries are still divided between on the one hand a desire to support prices and balance their public finances, and on the other the constant fear of market share being stolen by the inexorable rise of US shale oil. Given this dual constraint, and the prospect of a progressive rebalancing between supply and demand over the next two years, we conclude that oil prices should hover around 59-60 dollars per barrel in 2018 and 2019.
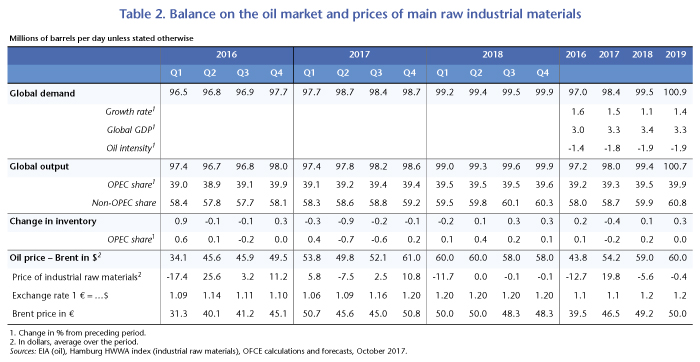
Worldwide demand is of course continuing to grow, driven by the emerging markets and the United States, but the overall supply is still plentiful (Table 2). In our October 2017 forecast, we anticipated a continuation of quotas until March 2018; we have now extended this until December 2018, which translates into a slightly lower level of supply in 2018 (‑0.2 million barrels per day below the October 2017 forecast).
The return to active management since end 2016
Since 2014, the OPEC countries have, at the instigation of Saudi Arabia, allowed, if not tacitly encouraged, the continuation of a situation of abundant supplies in order to maintain low prices and to squeeze out some of the unconventional production in the US in an effort to protect its market share. However, the position of the Saudi kingdom changed at the end of 2016: first, its offensive strategy vis-à-vis shale oil in the US did not really bear fruit, as production there continued at a steady pace. In addition, the sharp drop in prices seriously depressed Saudi public finances. The public deficit rose from 3.4% of GDP in 2014 to 15.8% in 2015, then 17.2% in 2016. At the same time, the Saudis are seeking to modernize their economy and privatize the state oil company, Saudi Aramco, and to do that they need oil to be more expensive and more profitable.
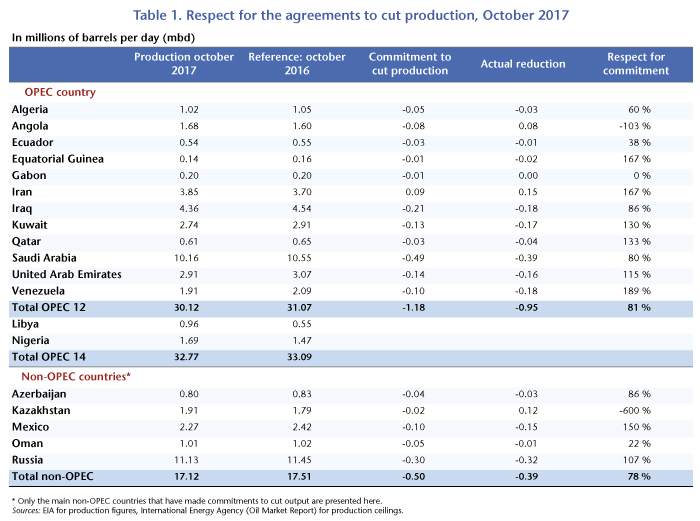
In an attempt to boost oil prices, the OPEC countries have gone outside the cartel to involve a number of non-member countries, notably Russia. Two agreements to reduce production were concluded at the end of 2016[1]: these called for a coordinated decline of nearly one million barrels per day (mbd) for OPEC members and 0.4 mbd for the other producers (Table 1). Have these agreements been respected? And have they raised prices? Not really. One year after the agreement, the countries concerned have complied about 80% with the production ceilings, but in a very unequal way. And the withdrawal of 1.3 mbd from the market did not have a strong impact on prices, for four reasons:
- First is the fact that the benchmark adopted for establishing production cuts was the level in October 2016, which is high for several countries;
- In addition, three OPEC countries were “spared” by the production cuts. Iran was for instance granted a production ceiling of 4 mbd (0.3 mbd more than in October 2016), to enable it to regain its level prior to Western sanctions. Similarly, Libya and Nigeria were not subject to a production ceiling, yet they experienced a sharp rise in production between October 2016 and July 2017 (460,000 barrels per day for Libya and 190,000 barrels per day for Nigeria);
- Furthermore, output from non-OPEC countries continued to rise strongly, with US production increasing by 1.1 mbd between October 2016 and July 2017 and Brazilian output by 0.3 mbd, which largely offset the reductions in Russia (-0.3 mbd) and Mexico (-0.1 mbd);
- Finally, inventories are still at high levels: they represent 102 days of demand in the United States and 99 days of demand in the OECD countries.
The agreement of 30 November 2017 doesn’t change the situation
The two 2016 agreements called for limiting production until March 2018, with the possibility of an extension, and OPEC has now decided to extend this by an additional nine months, until December 2018. Moreover, Libya and Nigeria, previously not part of the agreement, have also been incorporated. This information had in fact already been reflected in the market, so the impact was relatively small (USD 5‑7 per barrel of Brent). On the other hand, the November 30th meeting highlighted growing differences between the two main protagonists, Saudi Arabia and Russia. Russia had shown more and more reluctance to extend the agreement, due to several factors: first, some new Russian oil fields that were to have been put into service will now have to be postponed, which has angered the producers. Moreover, due to a floating exchange rate regime, a rise in oil prices will lead to a stronger ruble and undermine the country’s competitiveness. Finally, Russia is worried that higher oil prices will encourage American shale oil production and weaken its own market share. As a result, the unity on display in this agreement is actually fragile, and all options will be on the table at the next OPEC meeting in June 2018. Respect for the quotas could even be undermined before this deadline.
American production: Main cornerstone of global production
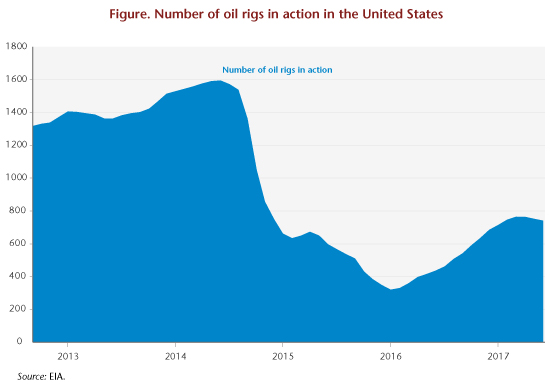
The way US production develops in 2018 will be of particular importance: especially since 2014, dynamic growth in the US has helped to avoid a surge in oil prices. The number of active oil rigs has been increasing there since the low point of May 2016, but is still well below the 2014 level (graph). However, thanks to more efficient drilling techniques that focus on the most productive areas of the fields (sweet spots), the output of each new well is increasing. In addition, production and investment costs have fallen: production costs are around USD 40 according to the US Bureau of Labor Statistics, which is 35% lower than at the end of 2014; upstream investment costs represent less than USD 15 per barrel produced (compared with USD 27 in 2014). Finally, according to EIA figures, expenditure on oil investment was USD 67 billion in the second quarter of 2017, a 4% year-on-year increase. This underpins our hypothesis that output will rise by 0.6 mbd in 2018 and 2019.
 Balancing supply and demand by 2018-2019
We anticipate sustained growth in global demand (+1.3 mbd in 2018 and +1.4 mbd in 2019), due to the emerging countries (in particular China and India). Chinese demand should represent an additional 0.4 mbd per year, one-third of the overall increase. On the supply side, growth will come from the non-OPEC supply, which should increase by 1 mbd each year from 2017 to 2019. In 2017, the additional supply from North America will represent 0.8 mbd, including 0.6 mbd for the United States and 0.2 mbd for Canada. Kazakhstan and Brazil will contribute upwards of 0.2 mbd each. Production should fall in Mexico (-0.2 Mb) and China (-0.1 Mb). The scenarios for 2018 and 2019 are identical. Iran has the potential to increase its output by at least 0.2 mbd, and some countries could slightly relax their constraints, leading us to forecast an increase in OPEC production of 0.2 mbd in 2018.
However, it’s impossible to exclude risks to the supply side. Among the bullish price risks are the likelihood of a more pronounced and coordinated cutback in OPEC production, an escalation in tension between the United States and Iran, and renewed upheaval in Nigeria and Libya. The bearish risks are linked to the continuation of the OPEC agreement: if OPEC decides not to renew the agreement or compliance with it is limited due to diverging national interests, then prices could fall further.
[1] The two agreements to cut production concluded at the end of 2016 are the agreement of 30 November 2016 (Vienna Agreement) between the OPEC countries, which provides for pulling 1.2 mbd out of the market compared to October 2016, and the agreement of 10 December 2016, among non-OPEC countries, which provides for cutting production by 0.55 mbd.