Poverty and social exclusion in Europe: where are things at?

By Sandrine Levasseur

In March 2010, the EU set itself the target for the year 2020 of reducing the number of people living below the poverty line or in social exclusion by 20 million compared with 2008, i.e. a target of 97.5 million “poor” people in 2020. Unfortunately, due to the crisis, this goal will not be reached. The latest available figures show that in 2013 the EU had 122.6 million people living in poverty or social exclusion. Surprisingly, the EU’s inability to meet the target set by the Europe 2020 initiative is due mainly to the EU-15 countries, the so-called “advanced” countries in terms of their economic development [1]. Indeed, if the trends observed over the last ten years continue, the Central and East European countries (CEEC) will continue to experience a decline in the number of people living below the poverty line or in social exclusion. How is it that the countries of the EU-15 are performing so poorly in the fight against poverty and social exclusion? It is important to keep in mind that the East and Central European countries also perform better when we consider other indicators of income inequality within a country (e.g. the Gini coefficient, the ratio of the income of the 20% richest over that of the 20% poorest). The EU-15’s performance is troubling not only with regard to relative poverty and social exclusion, but also in terms of all the statistics concerning living conditions and income inequality.

Risk of poverty and social exclusion: what exactly are we talking about?

In order to reduce poverty and social exclusion, the Europe 2020 initiative focuses on three types of groups: people at risk of poverty, people facing severe material deprivation, and people with a low work intensity[2]. A person belonging to several different groups is counted only once.

According to Europe 2020, people are at risk of poverty when their disposable income falls below 60% of the median income observed at the national level, the median income being the level of income at which half the country’s population has a higher income and half a lower one. Since the median income threshold is calculated nationally, this means for example that a Romanian individual at the threshold of the median income has an income well below that of a French person earning the median income: the Romanian median income is in fact one-fifth the French median income in terms of purchasing power parity, that is to say, when we take into account the price differences between the countries[3]. The indicator of the poverty risk used by Europe 2020 is thus a measure of income inequality between individuals within a country, not between countries.

Note that disposable income is considered in adult equivalents, i.e. incomes were first recorded at the household level and then weights were assigned to each member (1 for the first adult; 0 5 for the second and each person over age 14; and 0.3 for children under age 14). Also note that the disposable incomes in question here are after social transfers, i.e. after taking account of allowances, benefits and pensions – that is, they are after any action by the country’s social system. In addition, the level used to define the threshold for the risk of poverty (i.e. 60% of median income) aims to take into account situations other than extreme poverty: the goal is also to take account of people who are having difficulty meeting their basic needs. For example, the poverty threshold of 60% of median income in France was 12,569 euros per year in 2013 (or 1047 euros a month). The concept of material deprivation is used to refine the definition of unmet basic needs.

People experiencing severe material deprivation are those whose lives are constrained by a lack of resources and who face at least four out of the following nine material deprivations: an inability 1) to pay the rent or utility bills (water, gas, electricity, telephone); 2) to heat the dwelling adequately; 3) to meet unexpected expenses; 4) to eat a daily portion of protein (meat, fish or equivalent); 5) to afford a week’s holiday away from home; 6) to own a car; 7) to have a washing machine; 8) to have a color TV; or 9) to have a telephone.

People living in a household with a low work intensity are those aged 0 to 59 who live in a home where the adults (aged 18 to 59) worked less than 20% of their potential capacity in the last year.

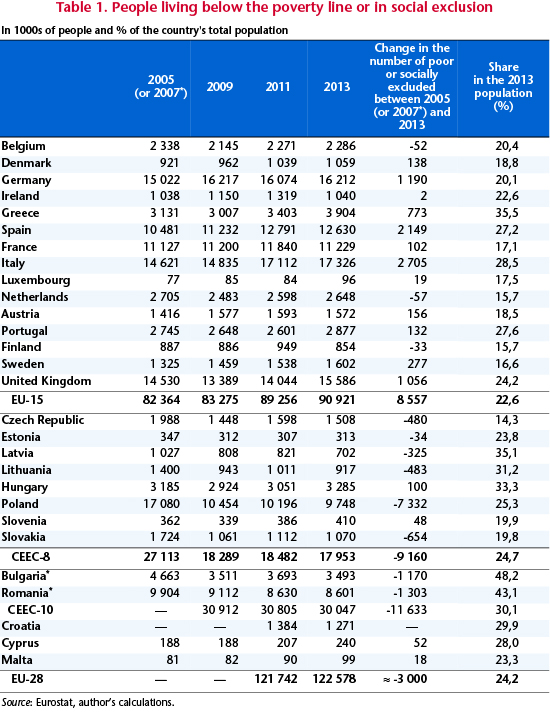
According to the latest available statistics (Table 1), 122.6 million people in the EU-28 belonged to at least one of these three groups in 2013, i.e. nearly one person out of every four (slightly more than 24%).

TAB1_post2302ang

Contrasting developments between the EU-15 and the CEE countries with regard to poverty and social exclusion

While a little over 30% of the CEE population lives in poverty or social exclusion (versus 22.6% in the EU-15), what is striking is that the number of poor and socially excluded has been decreasing in the CEE countries over the last 10 years while it has been increasing in the EU-15, especially since the onset of the crisis (Table 1).

Over the past decade, the number of people living in poverty or social exclusion fell in almost all the CEE countries (with the exception of Hungary and Slovenia) and rose in almost all the EU-15 countries (with the exception of Belgium, the Netherlands and Finland). During these 10 years, the CEE countries experienced a decline of 11.5 million in the ranks of the poor and socially excluded, while the EU-15 recorded an increase of 8.5 million, i.e. an 85% rise since 2009. The crisis has clearly hit the EU-15 hard in terms of poverty and social exclusion. The CEE countries have, all things considered, proved fairly resilient: a number of them are even continuing to see a decrease in the number of poor and socially excluded.

What’s behind these contrasting trends in poverty and social exclusion?

The main factor explaining the contrasting trends in poverty between the EU-15 and the CEE countries is that the economic situation has generally developed more favourably in East Europe than in West Europe, including during the crisis period.

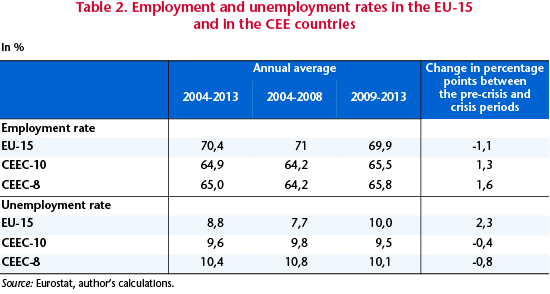
Indeed, the average GDP growth rate over the last ten years (2004 to 2013) was 3.2% in the CEEC, compared with 0.8% in the EU-15. The CEE countries, though hit by the crisis, nevertheless recorded average annual growth of 0.7% in 2009-2013 (against ­0.1% in the EU-15). Likewise, the unemployment and employment rates during the crisis reflected a more favourable situation on the CEE labour markets than on the EU-15 markets (Table 2).

TAB2_post2302ang

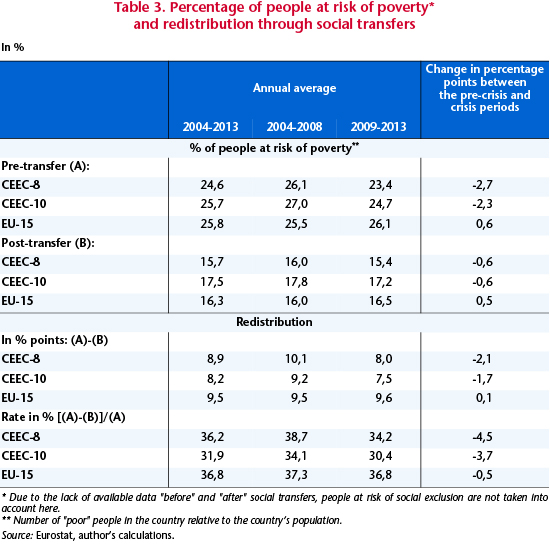
The risk of poverty prior to social transfers continued to fall in the CEE countries, while from 2009 it rose in the EU-15 (Table 3). Consequently, the share of people in the CEE countries living below the poverty line (out of each country’s total population) before transfers has fallen below the level observed in the EU-15. The crisis has thus had a direct differentiated effect (i.e. before redistribution) on income inequality within countries: in Europe’s East, income inequality has fallen, while in the West it has risen.

The workings of the social security systems in the EU-15 countries have, however, resulted in reversing (or mitigating) the differences in post-transfer poverty rates (Table 3). In 2013, the post-transfer poverty rate was 16.5% in the EU-15, compared with 17.2% in the CEE countries (15.4% excluding Bulgaria and Romania). The Gini coefficient, which is a more common measure of within-country income inequality, also confirms that income inequality is now higher in the EU-15 than in the CEEC[4].

Note that during the crisis the intensity of the redistribution (in % points or rates) was higher in the EU-15 than in the CEEC. However, over time the redistribution rate fell in both the East and the West, starting in 2009. Prior to the crisis, the social security systems in the EU-15 resulted in a 37.3% reduction in the number of people living in poverty and social exclusion; during the crisis, the rate fell to 36.8%. In the CEE countries, the fall in the redistribution rate was even greater, on the order of 3.7 percentage points. By way of illustration, if the redistribution rate for the pre-crisis period had been maintained during the crisis period, an additional 1.4 million people would have avoided the risk of poverty during the crisis (0.5 million in the EU-15 and 0.9 million in the CEEC).

TAB3_post2302ang

This brings us to the second explanatory factor. Are the austerity programmes being implemented in many EU countries to comply with the Stability and Growth Pact and / or to satisfy the financial markets responsible for the post-transfer increase in the number of people at risk of poverty that has taken place in the EU-15? And have these programmes acted to hold back the decline in poverty rates observed in the CEE countries, which otherwise would have been even greater?

The empirical literature on this issue is clear-cut: it shows that income inequality within countries increases during periods of fiscal consolidation[5] (Agnello and Sousa, 2012Ball et al., 2013Mulas-Granados, 2003Woo et al., 2013). Among the tools of fiscal consolidation (i.e. cuts in public spending, increases in tax revenues), it is the spending cuts in particular that increase income inequality (Agnello and Sousa, 2012Ball et al., 2013Bastagli et al., 2012Woo et al., 2013). Austerity programmes implemented after the onset of a banking crisis have a much greater negative effect on income inequality than programmes implemented when not in a banking crisis (Agnello and Sousa, 2012). Furthermore, small consolidations (i.e. involving a cut in the public deficit of less than 1 GDP point) have a bigger negative effect on inequality than large fiscal consolidations (Agnello and Sousa, 2012).

If the results of this (still sparse) literature are accepted, the timing of the fiscal consolidation implemented in recent years has not been ideal: the programmes have been introduced too early with respect to the occurrence of the crisis. Nor have they been optimal in size: they are insufficient to cut the deficit substantially but very costly in terms of increasing income inequality between individuals. While it is difficult to form a firm and final opinion on the link between fiscal consolidation and income inequality (and poverty) based on the sparse literature, the afore-mentioned studies do have a value: they raise questions about the potentially harmful impacts of the austerity policies that have been implemented in recent years.


[1] The Europe 2020 initiative sets out poverty reduction and social exclusion targets for each country. Here we are basically interested in the different trends between the two areas: the EU-15 and the CEE countries.

[2] See the article by Maître, Nolan and Whelan (2014) for a critical in-depth analysis of the statistical criteria for poverty and social exclusion.

[3] In current euros, the difference in income would be even greater: in 2013, the French median income was 20,949 euros a year, and Romania’s 2071 euros, so Romania’s median income per year would thus be one-tenth, not one-fifth, of the French level.

[4] The difference (in favour of the CEE countries) is even more pronounced due to the exclusion of Bulgaria and Romania: the Gini coefficient after transfers is then 0.291 against 0.306 for the EU-15. The Gini coefficient can take a value between 0 and 1. As the coefficient approaches 1, an increasingly small share of the population has a larger and larger share of total income. Ultimately, when the coefficient reaches 1, a single individual has all the income.

[5] Because of the way the poverty line is calculated (i.e. 60% of median income), an increase in the share of people living below the poverty line definitely corresponds to an increase in income inequality between individuals.


France, Germany: The nonworking poor

By Guillaume Allègre

“The ways of thinking society, managing it and quantifying it are indissolubly linked”

Alain Desrosières, 1940-2013

The subject of working poverty emerged in Europe in public debate and academic discussion in the early 2000s, in parallel with the implementation of policies to “make work pay”. European guidelines on employment have explicitly mentioned the need to reduce working poverty since 2003, and Eurostat set up an indicator on the working poor in 2005 (Bardone and Guio). In France, policies to make work pay have taken the particular form of earned income supplements (PPE, then RSA). In Germany, a series of reforms of the labour market and social welfare (the Hartz Laws) were introduced in the early 2000s with the aim of activating the unemployed. Critics of the German reforms often highlight the proliferation of atypical forms of employment (Alber and Heisig, 2011): the recourse to part-time, low-wage work and mini-jobs without social protection. In France as in Germany, this focus on workers has masked a less well-known aspect of the changing face of poverty: among working-age people, it is poverty among the unemployed (the “inactive” in France, the “unemployed” in Germany) that has been on the rise since the late 1990s.

Figure 1 shows the change in the poverty rate for individuals between 1996 and 2010, calculated at the threshold of 60% of the median living standard, according to their employment status. Two points stand out. First, poverty primarily affects the unemployed: their poverty rate was about 35% over this period. Second, economically inactive people over age 15, who are neither students nor retired (called “other inactive”), i.e. the “discouraged unemployed” and men and women (especially women!) in the home, are the group most affected by the rise in poverty. Their poverty rate was 23% in 1996, but hit 32% in 2010. At the same time, poverty among people in work fell from 9% to 8%. As a result, while the economically active with jobs accounted for 25% of the poor in 1996 and “other inactive” 12%, the latter’s share of the poor rose to 17% in 2010 while the share of the active declined to 22%. The weight of the working poor among all poor people is tending to decrease, while the weight of the inactive is rising.

As for Germany, the analysis of poverty rates by employment status is fraught with discrepancies attributable to the sources, in particular with regard to changes in the poverty level among the unemployed, which according to Eurostat (EU-SILC survey) is much higher than in the national SOEP survey (see Figure 2). Despite the statistical uncertainties, it is still clear that poverty affects the unemployed above all, and that their poverty rate has risen substantially: from 30% to 56% between 1998 and 2010, according to the SOEP survey, which is generally considered more reliable than the SILC (Hauser, 2008). While poverty is increasing for all categories of the population (see Heyer, 2012), it is among the unemployed that it is most pronounced.

The increase in poverty among the jobless is the result of certain provisions of the Hartz IV laws, which are less well known than those establishing mini-jobs (Hartz II). Prior to this legislation, the jobless could receive unemployment benefits for a maximum period of 32 months, after which they could receive means-tested unemployment assistance for an indefinite period (Ochel, 2005). But unlike the ASS benefit [i] in France, the amount of this assistance depended on the net income at the last job and provided a relatively generous replacement rate (53% of net income for people without children). This system was replaced starting in 2005 by a much less generous compensation, based on the goal of employment activation. Unemployment benefit (Arbeitslosengeld I – ALG I) was limited to 12 months for unemployed people under age 55, and the grounds for penalties were expanded. Following this period, unemployment assistance (Arbeitslosengeld II – ALG II) is greatly reduced and essentially serves only as an ultimate safety net: the amount for a single person is limited to 345 euros per month, while the penalties have also been expanded and toughened [ii]. Germany’s strategy to promote employment hence uses two levers: reducing income support for the unemployed, and penalties. While this policy may have contributed to lowering unemployment (see Chagny, 2008, for a discussion of the controversial impact of this reform), by its very design it has had a significant impact with regard to poverty among the unemployed.

One paradox that needs to be examined is the only small change since the early 2000s (at least according to the SOEP survey) of the poverty rate among people in work. Indeed, during this period, the proportion of low-wage workers rose and the recourse to part-time work increased sharply, without a substantial rise in the poverty rate for people in work. In 2010, 4.9 million people (12% of people in work) held a mini-job for which they cannot receive more than 400 euros per month in earned income (Alber and Heisig, 2011). There has also been the growth of part-time work with social protection (from 3.9 million jobs in 2000 to 5.3 million in 2010). We would expect therefore to see an increase in working poverty. But this is being countered by two factors: the development of opportunities for cumulation with unemployment benefits (the third lever of the employment activation policy), and family solidarity. Indeed, part-time and low-wage jobs are predominantly held by women, who account for two-thirds of workers on low annual incomes [iii]. The income of their spouse, when they have one, often enables them to avoid poverty, as the income of all household members is aggregated to determine the standard of living and poverty. In this respect, to paraphrase Meulders and O’Dorchai, the household is a fig-leaf concealing women’s low incomes. Lone mothers, on the other hand, are especially affected by poverty: the poverty rate is about 40% among single-parent families.

From the perspective of the indicators, the use of the category “working poor” thus poses several problems. First, the category hides the role of unemployment and inactivity as determinants of poverty; by its very name, it highlights one important determinant of working poverty (“work doesn’t pay”) in relation to other determinants (“small number of hours worked” or “heavy family responsibilities”). Public policies based on this approach thus run the risk of limiting the population targeted by the fight against poverty (in France, people on unemployment benefit are excluded from the RSA-activité [income supplement for the working poor]) and of focusing on strengthening financial incentives for returning to work in order to stimulate the supply of labour, even though the high level of unemployment is related to the demand-side rationing of labour. Second, the category is blind to gender inequality: women are more often poor and constitute the majority of low-wage workers, but they are less likely to be working poor! (Ponthieux, 2004) If all that we manage well is what we measure, it is necessary that the measure be easily interpreted by policy makers. Reducing inequalities in living standards (between households) and in earned income (between individuals) are two legitimate public policy goals (as explained here [in French]), which need to be measured separately, just as these two goals require the use of specific instruments.

From the standpoint of public policy, the change in poverty based on employment status in France and Germany emphasizes that an effective fight against poverty requires addressing all forms of poverty. For the working-age population, in economies where dual-earner couples have become the norm, this means putting in place policies on full-time work and full employment policies that do not foster atypical forms of work. This requires, from a macroeconomic point of view, growth or job-sharing (and the associated income-sharing) and, from a microeconomic point of view, meeting needs with respect in particular to childcare, training and transport. While these policies are costly, more economical measures, such as strengthening financial incentives, have failed to demonstrate that they can actually reduce overall poverty.


[i] The Allocation de solidarité spécifique (ASS), means-tested benefits paid to unemployed persons whose right to unemployment benefits has expired.

[ii] In total, 1.5 million penalties were applied in 2009, for 2.8 million on jobless benefits, compared with 360,000 in 2004, for 4 million on jobless benefits (according to Alber and Heisig, 2011, Tables 6-8, pp. 24-30).

[iii] Set at the threshold of two-thirds of median salary.


Spain: a lose-lose strategy

by Danielle Schweisguth

At a time when the IMF has publicly recognized that it underestimated the negative impact of fiscal adjustment on Europe’s economic growth, Spain is preparing to publish its public deficit figure for 2012. The initial estimate should be around 8% of GDP, but this could be revised upwards, as was the case in 2011 – while the target negotiated with the European Commission is 6.3%. With social distress at a peak, only a sustainable return to growth would allow Spain to solve its budget problems through higher tax revenue. But the austerity being imposed by Europe is delaying the return of economic growth. And the level of Spain’s fiscal multiplier, which by our estimates is between 1.3 and 1.8, is rendering the policy of fiscal restraint ineffective, since it is not significantly reducing the deficit and is keeping the country in recession.

At a time when the IMF has publicly recognized that it underestimated the negative impact of fiscal adjustment on Europe’s economic growth – the famous fiscal multiplier – Spain is preparing to publish its public deficit for 2012. The initial estimate should be around 8% of GDP, but this could be revised upwards as was the case in 2011. If we exclude the financial support for the banking sector, which is not taken into account in the excessive deficit procedure, the deficit then falls to 7% of GDP. This figure is still higher than the official target of 6.3% that was the subject of bitter negotiations with the European Commission. Recall that until September 2011, the initial target deficit for 2012 was 4.4% of GDP. It was only after the unpleasant surprise of the publication of the 8.5% deficit for 2011 (which was later revised to 9.4%) – which was well above the official 2011 target of 6% of GDP – that the newly elected government of Mariano Rajoy asked the European Commission for an initial relaxation of conditions. The target deficit was then set by Brussels at 5.3% of GDP for 2012. In July 2012, pressure on Spain’s sovereign rate – which approached 7% – then led the government to negotiate with the Commission to put off the 3% target to 2014 and to set a deficit target of 6.3% of GDP in 2012.


But the strategy of trying to reduce the deficit by 2.6 GDP points while in a cyclical downturn proved to be ineffective and even counter-productive. Furthermore, the result has not been worth the effort involved, even though the European authorities have praised it repeatedly. A succession of three consecutive years of austerity plans of historic proportions (2010, 2011 and 2012) has led to only a very small improvement in the budget balance (Table). The deficit was reduced by 3.2 percentage points in three years, while two years of crisis were enough to expand it by 13.3 points (from 2007 to 2009). The fiscal impulse was ‑2.2 percentage points of GDP in 2010, -0.9 point in 2011 and -3.3 points in 2012, or a total of 6.4 GDP points of fiscal effort (68 billion euros). Yet the crisis has precipitated the collapse of the real estate market and greatly weakened the banking system. Since then, the country has plunged into a deep recession: GDP has fallen by 5.7% since the first quarter of 2008, which puts it 12% below its potential level (assuming potential growth of 1.5% per year), with 26% of the workforce currently unemployed, in particular 56% of the young people.

The deterioration of Spain’s economic situation has hit tax revenue very hard. Between 2007 and 2011, the country’s tax revenues have fallen further than in any other country in the euro zone. Revenue declined from 38% of GDP in 2007 to 32.4% in 2011, despite a hike in VAT (2 points in 2010 and 3 points in 2012) and an increase in income tax rates and property taxes in 2011. The successive tax increases only slightly alleviated the depressive effect of the collapse of the tax base. VAT revenues recorded a sharp drop of 41% in nominal terms between 2007 and 2012, as did the tax on income and wealth (45%). In comparison, the decrease in tax revenue in the euro zone was much more modest: from 41.2% of GDP in 2007 to 40.8% in 2011. Finally, rising unemployment has undermined the accounts of the social security system, which will experience a deficit of 1 percentage point of GDP in 2012 for the first time in its history.

To compensate for the fall in tax revenue, the Spanish government had to take drastic measures to restrict spending to try to meet its commitments, including a 5% reduction in the salaries of civil servants and the elimination of their Christmas bonus; a hiring freeze in the public sector and increasing the work week from 35 to 37.5 hours (without extra pay); raising the retirement age from 65 to 67, along with a pension freeze (2010); a reduction of unemployment benefits for those who are unemployed more than seven months; and lowering severance pay from 45 days per year worked to 33 days (20 if the company is in the red). Even though household income has stagnated or declined, Spanish families have experienced a significant increase in the cost of living: a 5-point increase in VAT, higher electricity rates (28% in two years), higher taxes on tobacco and lower reimbursement rates for medicines (retirees pay 10% of the price and the employed 40% to 60%, depending on their income).

The social situation in Spain is very worrying. Poverty has increased (from 23% of the population in 2007 to 27% in 2011, according to Eurostat); households failing to pay their bills are being evicted from their homes; long-term unemployment has exploded (9% of the labour force); unemployed youth are a lost generation, and the best educated are emigrating. The VAT increase in September has forced households to tighten their budgets: spending on food declined in September and October 2012, respectively, by 2.3% and 1.8% yoy. Moreover, the Spanish health system is suffering from budget cuts (10% in 2012), which led to the closure of night-time emergency services in dozens of municipalities and to longer waiting lists for surgery (from 50,000 people in 2009 to 80,000 in 2012), with an average waiting time of nearly five months.

Social distress is thus at a peak. The movement of the indignados led millions of Spaniards to take to the streets in 2012, in protests that were often violently suppressed by riot police. The region of Catalonia, the richest in Spain but also the most indebted, is threatening to secede, to the consternation of the Spanish government. On 24 January, the Catalan government passed a motion on the region’s sovereignty, the first step in a process of self-determination that could lead to a referendum in 2014.

Only a lasting return to growth would enable Spain to solve its budget problems through higher tax revenue. But the tightening of financing conditions on Spain’s sovereign debt since the summer of 2012 has forced the government to strengthen its austerity policy, which is delaying the return to economic growth. Furthermore, the European Commission has agreed to provide financial assistance to Spain only if it renounces its sovereignty in budget matters, at least partially, which the government of Mariano Rajoy is still reluctant to accept. The initiative of the European Commission on the exclusion of capital expenditures from calculations of the public deficit for countries close to a balanced budget, the details of which will be published in the spring, is a step in the right direction (El Pais). But this rule would apply only to the seven countries where the fiscal deficit is below 3% of GDP (Germany, Luxembourg, Sweden, Finland, Estonia, Bulgaria and Malta), which leaves out the countries facing the most difficult economic situations. Greater awareness of the social dramas that underlie these poor economic performances should lead to greater respect for the fundamental rights of Europe’s citizens. Moreover, in the 2013 iAGS report the OFCE showed that a restrained austerity policy (budget restrictions limited to 0.5 percent of GDP each year) is more effective from the viewpoint of both growth and deficit reduction in countries like Spain where the fiscal multipliers are very high (between 1.3 and 1.8, according to our estimates).


Higher unemployment in France, greater poverty in Germany

By Eric Heyer

Will France be the new Greece, as The Economist has argued? Should French reforms be accelerated and be modelled on those implemented in Germany ten years ago? For German public opinion, for its authorities and for a large number of economic experts, the answer is obvious. Not only does Germany have a lower deficit, but unlike its French neighbour it has also managed to significantly reduce its unemployment rate. Starting from a similar level in the early 2000s (close to 7.7% at end 2001), the unemployment rate now stands at 5.4% of the labour force in Germany, 4.5 percentage points below the level in France (Figure 1).


The purpose of this note is not to revisit the reasons for this difference, which have already been the subject of posts on this blog (see in particular the impact of demography, by G. Cornilleau, of the reduction in working hours, by E. Heyer and M. Plane, and of the rise in male-female inequalities, by H. Périvier). The point rather is simply to note that the reduction of unemployment in Germany has been accompanied by a steep rise in poverty.

According to Eurostat, over the past six years the poverty rate (measured at the threshold of 60% of median income) has risen by 3.6 percentage points in Germany, four times more than the rise observed in France (0.9 point). In 2011, despite the sharp drop in unemployment and the large differential with France, the poverty rate in Germany was 1.8 points higher than the level observed in France, i.e. a difference of over 11% (Figures 2 & 3).


There is, therefore, a hidden side to the reforms implemented in Germany over the past ten years, which have led to lower unemployment but greater poverty.