Small recovery after a big crisis

By the Analysis and Forecasting Department

This text summarizes the 2016-2017 outlook for the global economy and the euro zone. Click here to consult the complete version [in French].

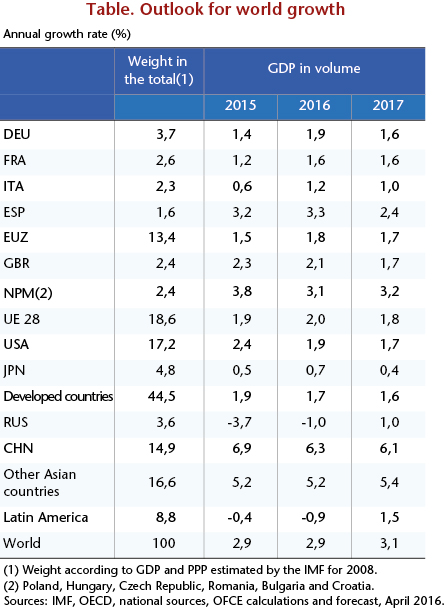
Global growth is once again passing through a zone of turbulence. While growth will take place, it is nevertheless being revised downwards for 2016 and 2017 to 2.9% and 3.1%, respectively. The slowdown is first of all hitting the emerging countries, with the decline in Chinese growth continuing and even worsening (6.1% anticipated for 2017, down from 7.6% on average in 2012-2014). The slowdown in Chinese demand is hitting world trade and fuelling lower oil prices, which in turn is exacerbating the difficulties facing oil and commodity producers. Finally, the prospect for the normalization of US monetary policy is resulting in a reflux of capital. The dollar is appreciating even as the currencies of the emerging countries of Asia and Latin America are depreciating. While the industrialized countries are also suffering from the Chinese slowdown through the demand channel, growth is resilient there thanks to falling oil prices. The support provided by monetary policy is being cut back in the US, but is strengthening in the euro zone, keeping the euro at a low level. Countries are no longer systematically adopting austerity policies. In these conditions, growth will slow in the US, from 2.4% in 2015 to 1.9% in 2016 and then 1.6% in 2017. The recovery will pick up pace slightly in the euro zone, driven mainly by the dynamism of Germany and Spain and the improved outlook in France and Italy. For the euro zone as a whole, growth should come to 1.8% in 2016 and 1.7% in 2017. This will push down the unemployment rate, although by year-end 2017 it will still be 2 points above its pre-crisis level (9.3%, against 7.3% at year-end 2007).

While the United States seems to have avoided the risk of deflation, the euro zone is still under threat. Inflation is close to zero, and the very low level of expectations for long-term inflation reflects the ECB’s difficulty in regaining control of inflation. Persistent unemployment indicates some continuing shortcomings in managing demand in the euro zone, which has in fact been based entirely on monetary policy. While the ECB’s actions are a necessary condition for accelerating growth, they are not sufficient, and must be supplemented by more active fiscal policy.

At the level of the euro zone as a whole, overall fiscal policy is neutral (expansionary in Germany and Italy in 2016 but restrictive in France and even more so in Greece), whereas it needs to be more expansionary in order to bring unemployment down more rapidly and help to avert deflationary risks. Furthermore, the continuing moderate growth is leading to the accumulation of current account surpluses in the euro zone (3.2% in 2015). While imbalances within the euro zone have been corrected to some extent, this mainly took place through adjustments by countries in deficit prior to the crisis. Consequently, the surplus in the euro zone’s current account will eventually pose risks to the level of the euro, which could appreciate once the monetary stimulus ends, thereby slowing growth.

tabpost_resum_ang2804


Solar power is cooling Sino-European relations

By Sarah Guillou

In early July 2013, yet another company in the solar industry, Conergy, declared bankruptcy. The departure of this German company, established in 1998, marks the end of a cycle for the solar industry. This bankruptcy adds to a series of closures and liquidations across every country that have highlighted the rising trade tension over solar panels between the United States and Europe on the one hand and China on the other (see OFCE Note 32: “The twilight of the solar industry, the darling of governments”, from 6 September 2013). As this tension peaked, in May, the European Commission decided to threaten China with a customs duty of over 45%. A trade war has thus concluded a decade of government involvement, as if this were a matter of saving the public money invested. But what it signifies most is the industrial failure of a non-cooperative global energy policy.

A promising, but chaotic, industrial start

Government worship of solar power, which took off in the early 2000s on both sides of the Atlantic, but also in the emerging economies (and especially China), has undoubtedly propelled solar energy to the forefront of renewable energies, but it has also fueled a number of market imbalances and serious industrial turmoil. With the price of oil rising constantly from 2000 to 2010, the need to accelerate the energy transition along with the commitments of the Kyoto Protocol led governments to support the production of renewable energy, with solar energy being the great beneficiary. The global industry experienced a tremendous boom, with growth of more than 600% from 2004 to 2011.

Public support, together with private investment, sparked massive market entries that destabilized the price of the main resource, silicon, the amount of which could not adjust as quickly. Fluctuations in the price of silicon due to imbalances in the market for photovoltaic panels created great instability in its supply, which was exacerbated by technological uncertainties facing companies trying to innovate in the field (such as the American firm, Solyndra, which finally filed for bankruptcy in 2013).

The trade war for a star

The intensification of Chinese domination of the industry has in turn affected the competitive uncertainty. China is now the world’s largest market, and the involvement of the Chinese government in the industry’s development is unparalleled. Today ranked third in terms of installed capacity (after Germany and Italy), China is also the world’s largest producer of solar panels. It now accounts for half of the world’s output of panels, whereas it produced only 6% in 2005. Chinese producers have received massive support from central and local government, which has also helped to saturate the Chinese market.

In addition to this public support, China also enjoys a distinct advantage in labour costs, which makes the business of manufacturing solar panels very competitive – the more technologically-intensive steps are upstream in the industry, at the level of the crystallization and slicing of the silicon. In addition to this competitive advantage, Chinese producers have also been accused of dumping, i.e. selling below the cost of production. Their competitiveness is thus unrivalled … but increasingly under challenge. In October 2012, the United States decided to impose tariffs on imports of Chinese cells and modules, with anti-dumping duties varying from 18.3% to 250% (for new entrants), depending on the company.

Europe, which imports many more photovoltaic components from China than does the United States, initially opted for the approach of imposing anti-dumping duties, and launched an investigation in September 2012, triggered by a complaint from EU ProSun – a trade association of 25 European manufacturers of solar modules – on imports of panels and modules from China. In June 2013, the Commission finally decided to impose a customs duty of 11.2% on solar panels, while threatening to push this up to 47% if China does not change its position on pricing by August 6th.

The Empire counter-attacks

The counter-attack was not long in coming: in July 2013, China decided to apply anti-dumping duties on imports of silicon from the United States and South Korea. A serious threat is also hanging over the head of Europe’s firms, as China is one of the largest markets for the continent’s silicon exporters (870 million dollars in 2011).

This trade war essentially reflects a defensive position taken by China’s industrial rivals in the face of a support policy that they consider disproportionate and unfair, during a period when China has been nibbling away at the industrial jobs of its competitors for ten years. But one could question the industrial logic underlying this trade policy.

First, this policy contradicts previous government policies promoting solar energy. The trade-off between climate change goals (developing low-cost energy transition tools) and the profitability and sustainability of the industry seems to have been decided in favour of the latter. Second, while this now provides producers direct support, it could handicap installers, engineering firms involved in pre-installation work, and manufacturers of panels using Chinese components. Finally, this is leading to serious exposure to potentially costly trade retaliation, which could mean exporters of poly-crystalline silicon or machinery used in the solar industry, or other industries such as wine or luxury cars.

Out of fear of a probable lack of approval by a majority of EU members or in order to “slay other dragons” more freely (the coming telecoms conflict), the agreement reached in late July by Commissioner Karel De Gucht and approved by the European Commission on August 2nd should not lead to trade retaliation nor disturb market supply too much. It commits nearly 90 Chinese producers not to sell below 56 cents per watt of power. This price is a compromise between what is considered consistent with the cost of Chinese production and the current average price on the market on the one hand and what is acceptable to European competitors on the other.

Finally, over the decade from 2002 to 2012 the solar photovoltaic industry has undeniably become global and highly competitive, despite clear-cut government interventionism. In reality, even the governments competed. Now they are settling their disputes by playing with international trade rules. Costly state support has propelled the growth of the sector beyond all expectations: by creating excess supply, the price of solar panels dropped sharply and accelerated the incredible boom in solar power. In 2013, solar power represented more than 2% of the electricity consumed in the European Union. This breakthrough by solar energy was accompanied by numerous entries and exits from the market, without so far giving rise to a significant business concentration. The choice of a public pull-back in favour of trade policy represents a new page in the history of this industry, which is no longer being driven so much by energy policy or even by industrial policy. There is obviously no dusk without a future dawn. But tomorrow’s dawn will certainly see the rise of a different “solar”. Europe’s future in the manufacture of solar panels will involve technological innovation aimed not so much at reducing costs as at improving performance.


Does too much finance kill growth?

By Jérôme Creel, Paul Hubert and Fabien Labondance

Is there an optimal level of financialization in an economy? An IMF working paper written by Arcand, Berkes and Panizza (2012) focuses on this issue and attempts to assess this level empirically. The paper highlights the negative effects caused by excessive financialization.

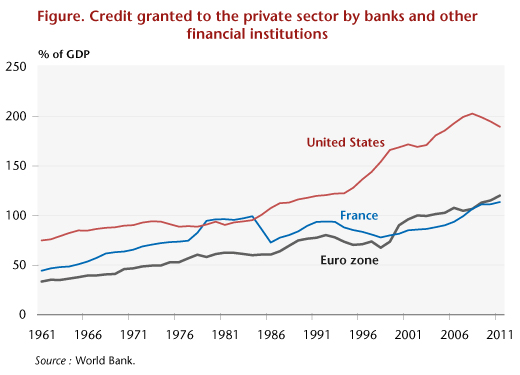
Financialization refers to the role played by financial services in an economy, and therefore the level of indebtedness of economic agents. The indicator of the level of financialization is conventionally measured by calculating the ratio of private sector credit to GDP. Until the early 2000s, this indicator took into account only the loans granted by deposit banks, but the development of shadow banking (Bakk-Simon et al., 2012) has been based on the credit granted by all financial institutions. This indicator helps us to understand financial intermediation (Beck et al., 1999) [1]. The graph below shows how financialization has evolved in the euro zone, France and the United States since the 1960s. The level has more than doubled in these three economies. Before the outbreak of the subprime crisis in the summer of 2007, loans to the private sector exceeded 100% of GDP in the euro zone and 200% in the United States.

Graphe-Blog_English-28-08

Arcand, Berkes and Panizza (2012) examined the extent to which the increasingly predominant role played by finance has an impact on economic growth. To understand the importance of this paper, it is useful to recall the existing differences in the findings of the empirical literature. On the one hand, until recently the most prolific literature highlighted a positive causal relationship between financial development and economic growth (Rajan and Zingales, 1998, and Levine, 2005): the financial sector acts as a lubricant for the economy, ensuring a smoother allocation of resources and the emergence of innovative firms. These lessons were derived from models of growth (especially endogenous) and have been confirmed by international comparisons, in particular with regard to developing countries with small financial sectors.

Some more skeptical authors believe that the link between finance and economic growth is exaggerated (Rodrik and Subramanian, 2009). De Gregorio and Guidotti (1995) argue that the link is tenuous or even non-existent in the developed countries and suggest that once a certain level of economic wealth has been reached, the financial sector makes only a marginal contribution to the efficiency of investment. It abandons its role as a facilitator of economic growth in order to focus on its own growth (Beck, 2012). This generates major banking and financial groups that are “too big to fail”, enabling these entities to take excessive risks since they know they are covered by the public authorities. Their fragility is then rapidly transmitted to other corporations and to the economy as a whole. The subprime crisis clearly showed the power and magnitude of the effects of correlation and contagion.

In an attempt to reconcile these two schools of thought, a nonlinear relationship between financialization and economic growth has been posited by a number of studies, including in particular the Arcand, Berkes and Panizza (2012) study. Using a dynamic panel methodology, they explain per capita GDP growth by means of the usual variables of endogenous growth theory (i.e. the initial GDP per capita, the accumulation of human capital over the average years of education, government spending, trade openness and inflation) and then add to their model credit to the private sector and the square of this same variable in order to take account of potential non-linearity. They are thus able to show that:

  1. The relationship between economic growth and private sector credit is positive;
  2. The relationship between economic growth and the square of private sector credit (that is to say, the effect of credit to the private sector when it is at a high level) is negative;
  3. Taken together, these two factors indicate a concave relationship – a bell curve – between economic growth and credit to the private sector.

The relationship between finance and growth is thus positive up to a certain level of financialization, and beyond this threshold the effects of financialization gradually start to become negative. According to the different specifications estimated by Arcand, Berkes and Panizza (2012), this threshold (as a percentage of GDP) lies between 80% and 100% of the level of loans to the private sector. [2]

While the level of financialization in the developed economies is above these thresholds, these conclusions point to the marginal gain in efficiency that financialization can have on an economy and the need to control its development. Furthermore, the argument of various banking lobbies, i.e. that regulating the size and growth of the financial sector would negatively impact the growth of the economies in question, is not supported by the data in the case of the developed countries.


[1] While this indicator may seem succinct as it does not take account of disintermediation, its use is justified by its availability at international level, which allows comparisons. Furthermore, more extensive lessons could be drawn with a protean indicator of financialization.

[2] Cecchetti and Kharroubi (2012) clarify that these thresholds should not be viewed as targets, but more like “extrema” that should be reached only in times of crisis. In “normal” times, it would be better that debt levels are lower so as to give the economies some maneuvering room in times of crisis.