Waiting for the recovery in the US

By Christophe Blot

As with the economic performance of all the industrialized
countries, economic activity fell off sharply in the second quarter of 2020
across the Atlantic before rebounding just as sharply the following quarter. The
management of the crisis in the US is largely in the hands of the different States,
and the election of Joe Biden should not change this framework since he
declared on November 19 that he would not order a national lockdown. However,
the health situation is continuing to deteriorate, with more than 200,000 new Covid-19
cases per day on average since the beginning of December. As a result, many
States are adopting more restrictive prophylactic measures, although without returning
to a lockdown like the one in the Spring. This situation could dampen economic prospects
for the end of the year and also for the start of the mandate of the new
President elected in November. Above all, it makes it even more necessary to
implement a new recovery plan, which was delayed by the election.

As in the euro zone, recovery in the US kicked off as
soon as the lockdown was lifted. GDP grew by 7.4% in the third quarter after
falling by 9% in the previous quarter. Compared with the level of activity at
the end of 2019, the economic downturn amounted to 3.5 points, versus 4.4
points in the euro zone. The labour market situation also improved rapidly,
with the unemployment rate falling by 8 points, according to data from the Bureau
of Labor Statistics for November, from its April peak of 14.7%. These results
are the logical consequence of the lifting of restrictions but also of the large-scale
stimulus plans approved in March and April, which have massively absorbed the
loss of income for households and to a lesser extent for US companies (see here).
However, the upturn in consumption is still being dampened by some ongoing restrictions,
particularly in sectors with strong social interactions, where spending is
still nearly 25% lower than it was in the fourth quarter of 2019 (Figure 1).
As for the consumption of goods, it has been much less
affected by the crisis and is down only 12% from its pre-crisis level for
durable goods and 4.4% for non-durable goods.
Nevertheless, most of these
support measures have come to an end, and as of this writing the discussions
that began in late summer in Congress have not yet led to an agreement between
Republicans and Democrats. Despite the rebound, the health impact of the pandemic
and the economic consequences of the lockdown on the labour market require a discretionary
policy in a country where the automatic stabilizers are generally considered to
be weaker[1]. New support measures will be all the more
necessary as a further tightening of restrictions is looming and the recovery
seem to be running out of steam. The initial consumption figures for the month
of October point to a fall in the consumption of services, and employment also
stabilized in November, remaining well below its level at the end of 2019.

However, after the setback of the discussions in
Congress, it will now be necessary to wait until the first quarter of 2021 for
a new support plan to be approved and for a possible reorientation of US fiscal
policy after Joe Biden’s victory. In the Autumn, the Democrats proposed a 2
trillion dollar (9.5 GDP points) package, almost as much as the 2.4 trillion dollar
(10.6 GDP points) package adopted in March-April 2020[2]. The aid would, among other things, support the
purchasing power of the unemployed through an additional federal payment.
Although unemployment is much lower than in the second quarter, it remains
above its pre-crisis level and is now characterized by an increase in long-term
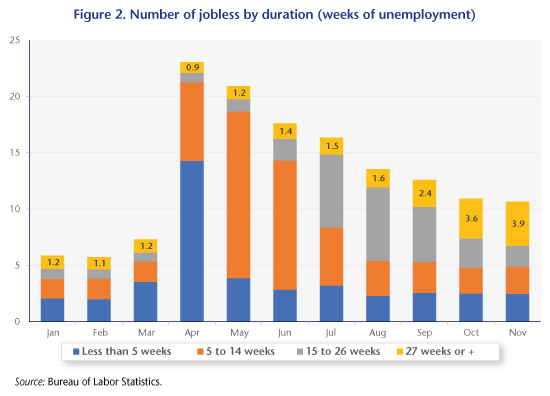
unemployment for which there is generally no compensation. In November, the
share of those who had been unemployed for at least 27 weeks was 37 per cent
(or 3.9 million people, Figure 2), and the median duration of unemployment
had risen from 9 weeks at the end of 2019 to almost 19 weeks in November 2020.
In addition, States whose tax revenues have decreased with the crisis could
benefit from a federal transfer, thereby avoiding spending cuts[3].

However, despite the end of the suspense over the
outcome of the presidential elections, the political and economic uncertainty
has not been completely resolved. Indeed, it will not be known until early
January whether the Democrats will also have a majority in Congress. They have
certainly kept the House of Representatives, but it will be necessary to wait
until the beginning of January for the Senate, with a ballot planned in Georgia
that will determine the political colour of the last two seats [4]. Both seats are now held by Republican senators.
However, Joe Biden won Georgia by 0.2 points against Donald Trump, the first
victory in the State for a Democratic candidate since 1992. With both State-wide
senatorial elections to be contested directly, the results are likely to be
close.  If one of the Democratic
candidates is defeated, Joe Biden will be forced to contend with the
opposition. But, as Paul Krugman
points out, the Republicans are generally more inclined, once in opposition, to
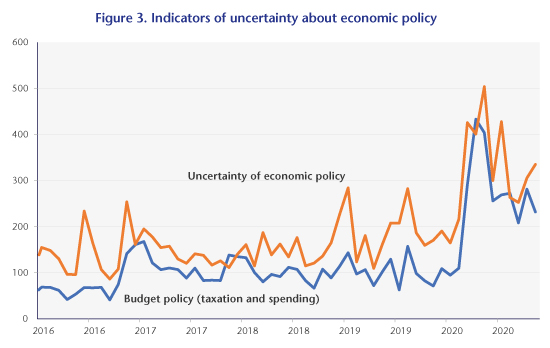
promote austerity. This is reflected in the uncertainty indicators of Bloom,
Baker and Davies, whose economic policy uncertainty rose in November (Figure 3).
This uncertainty is certainly lower than in the Spring but remains higher than
that observed between 2016 and 2019. During this period, growth could weaken,
and then a strong recovery is likely to be followed by more subdued growth,
which will have repercussions on the labour market. Regardless of the outcome,
a plan will likely be approved in the first quarter of 2021, but its adoption
could take longer if it is conditional on an agreement between Republicans and
Democrats in Congress. However, this could be lengthy given the urgency of the
health and social crisis, and could plunge a significant proportion of the most
vulnerable into poverty.

Source : Baker, Bloom & Davis. https://www.policyuncertainty.com/index.html


[1] See for example Dolls, M., Fuest, C. &
Peichl, A., 2012, “Automatic stabilizers and economic crisis: US vs. Europe”, Journal of Public Economics,
96(3-4), pp. 279-294.

[2] By comparison, the
European programmes are weaker, ranging from 2.6 GDP points for France to 7.2
points for the UK.

[3] Note that the States generally have fiscal
rules limiting their capacity to run a deficit.

[4] Of the 100 seats in the Senate, the
Republicans already hold 50. In the event of a tie between the two parties, it
is the voice of the Vice-President-elect Kamala Harris that will decide between
them. A single victory in Georgia would therefore allow the Republicans to
retain the majority
.


Is the decline of industry due to the growth of services?

By Sarah Guillou

On Friday, April 8 2016, the Observatoire Français des Conjonctures Economiques (OFCE) began a series of quarterly seminars on the analysis of France’s productive network. The purpose is to bring together researchers and discussion of the situation, the diversity and the heterogeneity of the companies making up France’s production system. This discussion is now being fed by the increasing use of business data. We hope in this way to enrich the analysis of the strong and weak points in the country’s production fabric, with a view to guiding the development of public policies aimed at strengthening it.[1]

The first seminar took up the role of services in deindustrialization as measured by the decline of industrial employment as a share of total employment. Since 2000, the manufacturing industry in France has lost more than a quarter of its work force, i.e. more than 900,000 jobs. A recent note by the INSEE (Insee Première, No 1592) points out that manufacturing’s weight in the economy has been halved from 1970 to today. Even though deindustrialization has aroused greater attention in France than elsewhere, probably because of the country’s interventionist tradition and the challenges facing its labour market, it is taking place in all the developed economies. This raises questions about underlying structural trends common to all these countries.

However, the decline in industrial employment is being accompanied by net job creation in services. It also appears that the growth of services is being driven in part by changes in industrial production methods. Products are incorporating an increasingly large component of services, and companies are expanding their portfolio of service products. The fragmentation of production processes – fuelled by the opportunities provided by globalization – is isolating low value-added manufacturing units from high value-added services units.

These changes in production methods need to be analysed to understand the extent of this phenomenon. It seems that the changes occurring within industry are just as much factors driving the decline of industry as the rise of services in employment. In other words, there is a question of how much deindustrialization finds a mirror image in the growth of services, or even its explanation.

Three contributions helped to provide some answers to the following questions: which manufacturers are producing services and with what impact on their performance? What is the role of services in the development of global value chains? Are flows of international services replacing flows of goods? Three main lessons emerge.

1 – “Servitization” and the decline in manufacturing jobs are clearly correlated

Manufactured products are incorporating an increasingly significant amount of services. This can be seen both by the growing share of companies that produce services (Crozet and Millet, 2015) and export them (Castor et al., 2016) and by the rising content of services in exports (Miroudot, 2016)[2].

The growth in companies’ value-added “services” may well push all their jobs into the service sector, including what are strictly speaking manufacturing jobs, if the added value of the services becomes dominant. Today an average of 40% of manufacturing employment corresponds to service activities. Furthermore, the fragmentation of production processes is intensifying, as is the distribution around the world of outsourced activities based on the comparative advantages of different locations. If the company maintains an anchor in the home country, it usually keeps only the higher value-added jobs there, in line with the cost of the related work and qualifications, meaning jobs often characterized as services.

Note that these changes in production methods clearly reflect a decrease in manufacturing functions in a product’s added value, which translates into a decline of manufacturing in the sources of the wealth of nations. But it is important not to underestimate the impact of the fragmentation of production units. Thus, jobs in services, formerly attributed to manufacturing, are being reclassified as service jobs even though the underlying production task has not changed, and this is happening regardless of outsourcing abroad.

However, this reclassification is all the more likely as “servitization” accelerates and becomes a must for companies to remain competitive.

2 – The servitization of manufacturing is a competitive factor

Servitization, which is associated with qualitative improvements in products and more generally the creation of value in manufacturing, is a factor in competitiveness.

As is shown by Crozet and Millet (2015), the production of services by manufacturing enterprises is a factor that enhances their performance. There are actually many French manufacturing companies that produce services, with 70% producing these for third parties (2007 data). The decision to produce services represents an important turning point, and clearly boosts performance. The authors’ estimates thus show that taking this decision raises profitability, employment, total sales and sales of goods. Even though there are sectoral variations, the impact on performance is positive, whatever the industrial sector in question.

At the aggregate level, the share of imported services in the export of goods is also growing. In France’s exports, the share of services ranges from 30% to 50%, depending on the sector. The fragmentation of production processes is leading to outsourcing certain service functions and to the provision of imported services. This dynamic goes hand in hand with the integration of economies in international trade, with the benefit of globalization opportunities and ultimately with the competitiveness of economies (see De Backer and Miroudot, 2013).

3 – The direct and indirect export of services will continue to make a positive contribution to the trade balance

The developments described above directly affect the trade in services. It is indeed increasingly services that are the subject of trade in intermediate products, with the latter being estimated at nearly 80% of world trade. Digitalization, along with differentiation through services, is leading to the fragmentation of production with the inclusion of more and more services.

Trade in services in France has not experienced a decline since the crisis of 2007. Even though the trade balance in services has shrunk slightly since 2012, it has remained positive since the start of the 21st century, and the export of services has been rising faster than for goods. As the world’s third largest exporter of services – especially because of tourism – France will see service exports increase as a share of its trade balance. Admittedly, for the moment, the volume of exported services has not offset the negative balance for goods, but the development of intra-firm trade in services and of intermediary services will eventually reverse their respective shares.

Trade in services is even more concentrated than trade in goods. It is mainly carried out by French or foreign multinational corporations, which account for more than 90% of this trade. While just over half of trade takes place with the European Union (EU), this component is running a deficit, while non-EU trade is running a surplus. It is interesting to note that the balance is positive for companies that are part of a French group, but negative for companies belonging to a foreign group (Castor et al., 2016).

In conclusion

It seems that the dichotomy between industry and services is becoming increasingly inappropriate to describe the dynamics of employment and the productive specialization of economies. An approach in terms of productive functions that breaks down the job properly based on whether it involves manufacturing activities strictly speaking or other activities, such as transportation and logistics, administrative support or R&D services, would allow a better understanding of a country’s skills and comparative advantages.

More generally, the growth of services and their increasing role in production and exports is giving them an increasingly central role in economic growth. Getting better statistics on the production and export of services and improving the methods of assessing productivity in services are prerequisites for a better understanding of the role of services in growth and of the levers to be activated to achieve this.


[1] A scientific committee responsible for the organization of the OFCE seminar on the Analysis of the Production System is composed of V. Aussilloux (France Stratégie), C. Cahn (Banque de France), V. Charlet (La Fabrique de l’Industrie), M. Crozet (Univ. Paris I, CEPII), S. Guillou (OFCE), E. Kremp (INSEE), F. Magnien (DGE), F. Mayneris (Univ. Louvain), L. Nesta (OFCE), X. Ragot (OFCE), R. Sampognaro (OFCE), and V. Touzé (OFCE).

[2] Miroudot, S. (forthcoming), “Global Value Chains and Trade in Value-Added: An Initial Assessment of the Impact on Jobs and Productivity”, OECD Trade Policy Papers, no. 190, OECD Publishing.


Can steel revive Europe’s industrial policy?

By Sarah Guillou

The situation of the European steel industry was on the agenda of the European Council’s Competitiveness session held on Monday, 29 February 2016. One of the Council’s conclusions was to issue a demand to speed up the anti-dumping investigations by two months. This demand follows a letter sent on 5 February to the European Commission by ministers from seven European countries, including France, Germany, Italy and the United Kingdom, urging it to take measures to protect the steel sector vis-à-vis what was deemed unfair competition from China and Russia.

The steel industry, which successively pushed forward Europe’s industrial development and then European cohesion through the European Coal and Steel Community (ECSC), subsequently became a theatre for the violent winds of globalization and a symbol of Europe’s industrial decline – will it now be the sector that leads a revival of Europe’s industrial policy?

In retrospect, a question arises as to whether the difficulties facing the European steel industry, which is subject both to the fussy oversight of the European Competition Commission and to low-cost Chinese imports, are partly a symptom of failings in Europe’s industrial policy, which is wedged between a very active competition policy and a timid trade policy?

The history of Europe’s steel industry does in fact fall closely in line with the history of Europe’s industrial policy: from a central and highly sectoral industry at the time of the ECSC, with a great deal of state aid going to the sector under various exemptions, it then became primarily horizontal and subject to competition policy. The sector only found its way by means of trade policy in response to increased competition from emerging countries. No steps have been taken in the steel industry towards European alliances or regroupings since the 1980s, and there have been no Europe-wide plans to rationalize production capacity so as to hold down the decline in jobs in the industry. This decline went hand in glove with the development of the continent’s specialization in high-tech steel products. But today even those jobs are under threat. Could a different industrial policy save them?

The state of the industry in Europe

Steel now accounts for 360,000 jobs in the European Union. The European sector has lost nearly a quarter of its workforce since 2009, with job losses accelerating: 3,000 jobs lost in the last 6 months.

In terms of production, the steel industry generates a turnover of 180 billion euros, with an output of 170 million tons from 500 production sites in 23 Member States. If countries are ranked individually in terms of international steel producers, Germany comes in 7th place, Italy 11th and France 15th. The sector is dependent on the import of iron ore, alumina and coal. Fortunately, the decline in steel prices has gone hand in hand with lower prices for these commodities. The industry is highly capital-intensive, requiring major investments. At the same time, the transport of steel coils and flat products is inexpensive, making it easier to import them.

The 2008 economic crisis cascaded through the sector, as steel products constitute intermediate consumption for many other industrial sectors as well as for construction. Steelmakers in Europe also face stricter environmental constraints than elsewhere. The steel industry is a major source of CO2 emissions, and is very sensitive to carbon prices and to regulatory changes. It is also a key player in the EU’s emissions trading system (ETS) for greenhouse gas quotas, and while the crisis has enabled the industry to make profits from the sale of surplus emissions rights, steelmakers who are currently experiencing problems vis-à-vis their non-European competitors will be very sensitive to the forthcoming reform of the system for the 2020-2030 period.

Some companies are now in real trouble, such as Arcelor Mittal, which announced a record loss for 2015 (nearly 8 billion euros), partly due to the need to depreciate its mines and steel stocks. The company, which is heavily in debt because of its many acquisitions in Europe, plans to close some plants. Tata Steel, for its part, has closed sites in Britain. In Japan, Nippon Steel, which just acquired an interest in the capital of the French firm Vallourec and is preparing to buy the Japanese Nisshin Steel, is doing better.

The difficulties facing a sector that built up excess capacity during the crisis have been aggravated by the economic downturn in China. Thus, 2015 was the first year to experience a decline (-3%) in global production (1,622 million tons), after 5 years of growth. Global production did not adjust immediately to falling demand, with prices initially acting as the adjustment variable. The decline in production was the signal for the closures of steel factories and mining operations. This has marked the end of a cycle of rising Chinese production that strongly destabilized the market.

The Chinese tornado

Chinese production doubled in volume between 2000 and 2014, and on its own now accounts for more than twice the combined output of the next four major producing countries, Japan, India, Russia and the United States. This performance is the result of several factors: massive government support; dynamic growth in construction, in infrastructure investment, and in the Chinese market’s production of cars and machinery; and favourable access to iron ore. China produces nearly 50% of the world’s steel, i.e. approximately 800 million tons of steel. The second-largest producer is Japan, with 100 million tons. India and the United States are contending for third place, at around 5% of global production. If we count the Europe-28 as a single entity, then it would take second place with 10% (Source: World Steel  Association). But the slowdown in the Chinese economy and the strong inertia characterizing production capacity in the steel industry have created substantial excess capacity, which the authorities are now trying to reduce. Domestically, China needs only about half of its output, so it exports the other half.

The 400 million tons China exports represent twice Europe’s output. The price of the Chinese offer is therefore likely to greatly upset the balances in other countries. Any excess capacity is directed onto foreign markets to be gotten rid of at low prices, as Chinese exporters are not going to fail to sell off their steel products. Hence China’s exports to Europe rose from 45 million tons in 2014 to 97 million tons in 2015, which exceeds the 43 million tons produced by Germany.

China is also likely to experience a significant decline in its workforce, and some production sites, drowning in massive debt, have already closed. Chinese steelmakers are losing money, and small units are going bankrupt. Large units, however, are often state property, and are weathering the storm (at the cost of heavy indebtedness) and becoming aggressive predators, in terms not only of price but also of acquisition capabilities. The weak position of Europe’s firms is also leaving them vulnerable to foreign takeovers. China Hebei Iron and Steel Group is, for instance, about to acquire a Serbian steelmaker, which would be yet another means of entering Europe.

The policy response

The public authorities have long been heavily involved in the steel sector. It was a strategic sector for post-war economic development, and was the source of European economic construction at a time when the “small steps” policy of Robert Schuman led to putting the coal and steel production of France and Germany under a common authority, later joined by other countries. For a long time the sector then benefited from various public aid measures and subsidies that kept up excess capacity relative to demand, now estimated at 10-15% of output. The sector then was gradually freed from public tutelage, and in the mid-1990s was excluded from the list of sectors in difficulty that were eligible for aid for restructurings and bailouts. Nevertheless, state support never disappeared completely, but today, the European Commission, through the Competition Commission, is relatively strict about applying the market investor principle to assess the legality of public support.

While tracking distortions in competition on the market, the European Commission recently opened an investigation into Italy’s support for the steelmaker Ilva (2 billion euros), and demanded that Belgium repay 211 million euros of aid paid to the steelmaker Duferco. In 2013, the Commission opened an investigation into aid awarded by “Belgian Foreign Strategic Investments Holding” (FSIH), a body created in 2003 by the Walloon management and investment company Sogepa to invest in the steel industry. This aid, paid between 2006 and 2011 by the Walloon government [a Belgian regional government], was considered to constitute unfair competition on the European market. Indeed, for the Commission, private investors would not have voluntarily made such investments.

These subsidies by the Walloon government therefore constituted aid that put competitors at a disadvantage. The Commission recognized that there is very strong foreign competition, but it considered that the best way to cope with this is to have strong, independent European players. It noted that despite the government aid, the Duferco group wound down all its activities in Belgium, meaning that the aid merely postponed the departure of a company that was not viable. The Commission is currently supporting the retraining of workers in the Walloon region through the European Globalisation Adjustment Fund. The point is to combat the recourse to public funding in Europe, which would ultimately be detrimental to the sector.

At the same time, so-called “anti-dumping” trade retaliation measures were implemented by the European Commission. In May 2014, following a complaint from Eurofer (the European steel association), the Commission imposed temporary anti-dumping duties of up to 25.2% on imports of certain steel products from the People’s Republic of China and duties of up to 12% on imports from Taiwan. The EC investigation ultimately concluded that China and Taiwan were selling at dumping prices. More recently, Cecilia Malmström, the head of trade policy at the European Commission, wrote to her Chinese counterparts warning them that she was launching three anti-dumping investigations against Chinese exporters (February 2015) in the field of seamless pipes, heavy plates and hot-rolled steels. Provisional anti-dumping duties (of between 13% and 26%) were also set on 12 February 2016 (complaints in 2015) with respect to China and Russia.

Some thirty anti-dumping measures protect the European steel industry, but the Member States where steel has been hit particularly hard by Chinese competition are calling for stronger measures. Politicians are railing against China’s loss-making exports and demanding that Europe take steps. They envy the US, which has acted more quickly and not skimped on the level of the duties it’s enacted, i.e. up to 236%. But the nature of these measures depends on the economic status accorded to China. Anti-dumping measures are not defined in the same way. As long as China is not a market economy, it is assumed that it provides strong support for its economic sectors, and that its prices are thus not market prices. Italy is struggling in Europe to prevent China from being granted this status, while the United Kingdom is supporting China at the WTO (even though the industry is also in trouble in Britain). The Commission has postponed its decision until summer.

What policy for tomorrow?

Should we allow the production of steel to disappear in Europe? It still represents more than 300,000 jobs there, though this is of course out of more than 35 million jobs in manufacturing in 2014. The sector is symbolic of heavy industry, and a supplier of the transportation and defence industries as well as construction – its disappearance would definitively turn a new page in European industry.

Do we need to recognize that, according to the theory of comparative advantage, it is better to buy cheaper Chinese steel and use the revenue freed up for other, more profitable uses? For example, shouldn’t it be used to upskill employees? In theory yes, but the revenue freed up goes to the purchasers of steel, so it is they who should supply the European conversion fund. What about taxing the consumption of the now cheaper steel? The flaw in the reasoning shows up when you realize that what is true with respect to macroeconomic balances is difficult to reconcile with microeconomic imbalances: those who are losing their jobs today are not the consumers who are benefitting. Ultimately, the microeconomic articulations can unsettle the macroeconomic balances.

The loss of know-how is indeed the main challenge, as it is here that resources are really wasted. In so far as skills are a competitive factor, difficulties related to a lack of demand should be considered transitional problems that need to be managed as well as possible. Neither contributions of foreign capital nor government support should be excluded. What justifies these investments are the returns expected from the use of human capital. To deal with these challenges, alliances on market segments that are not in trouble might be possible, even if they confer excessive market power, so long as they allow margins that make it possible to maintain the business during cyclical difficulties.

This is why competition policy has to be opened up to considerations of industrial policy (which is concerned about expertise) and trade policy (which appreciates the cyclical and / or unfair character of competition).

European actors need to be brought around a table – they are already grouped in Eurofer – and together with the European Commission develop a European plan for managing excess capacity and forging alliances. The Competition Directorate of the European Commission needs to relax its intellectual rigidity and adapt its reading of competition to the nature of contemporary globalization. Although it is based on an indisputable logic in the name of the single market, the approach of the Competition Directorate is sometimes no longer suited to the way that competition is unfolding on the global value chain today, which has no precedent on the 20th century European market. Who would believe that the market power resulting from a European merger would not be challenged very quickly by foreign forces if the new enterprise began to take advantage of its market power? The limits on market power are much stronger in the 21st century, with low inflation and depressed commodity prices an illustration of this. The risk that multinationals might abuse their power is posed less in terms of excessive prices than excesses in the capture of customers and in tax avoidance. This last point seems to have been understood clearly by the European Commission. In addition to this, there is the added competition from new applications driven by the digital industry, which manufacturers cannot escape. In other words, competition is no longer what it used to be: companies’ excessive power is no longer expressed much in prices or restrictions on quantities.

Competition policy, industrial policy and trade policy need to be developed in coordination, with a strengthened Competition Directorate that includes an element of industrial policy and trade policy. While strict controls on competition were a clear priority during the period of forging the single market when competition was essentially focused between the developed countries, today it is urgent to review the linkages between these three policy fields in order to consolidate the future of industry in Europe.


Is Emmanuel Macron approving a new industrial policy for France?

By Sarah Guillou

Support for industry is an economic issue that wins adherence from both Right and Left. The entire French political spectrum agrees on the importance of industry for the economy’s future. There is also a consensus among economists, who bring together a variety of sensitivities in recognizing the leading role industry plays in driving growth, mainly through exports and innovations – the manufacturing sector is responsible for over 70% of total exports and more than 75% of total R&D spending. This consensus is even international, to such an extent that, paraphrasing Robert Reich, it could be said that, “on the battlefield of national economic ambition, industry is the new boots on the ground”.

In France, everyone also agrees on deploring the decline in industrial jobs and more generally the de-industrialization that has seen industry’s share of total employment fall from 25% in 1990 to 10% in 2014. Deindustrialization, which has intensified since the 2007 crisis, crystallizes all the concerns about globalization and all the reproaches made to the French fiscal and regulatory environment.

Governments in general have been quick to support industry and have set up programmes to support innovation, SMEs and R&D spending. The research tax credit (CIR) set up in 1983 has been reinforced by government after government, and perfectly illustrates the political consensus on the matter. But since then numerous programmes to aid companies have been added, creating a tangle of schemes and local and national institutions, leading a recent OECD report to label the result relatively incoherent.

Unfortunately, it is clear that France’s economic and political consensus has not led to making its industry a global singularity in terms of performance. The country’s industrial policy has been unable to counteract the inexorable decline of industry in the face of the service sector.

But judging industrial policy in this way misconstrues its possible objectives. To understand what industrial policy involves, we need to shed our old habits.

On the one hand, opposing industry to services is outdated and is merely a statistical artefact. The services sector is poised to take over innovation and exports, but our statistics have not yet taken stock of these changes. We are still not very clear on how to measure productivity in services or how to understand the channels for innovation in this sector, which do not necessarily pass through R&D. Note, however, that among the companies that benefit from the CIR research tax credit, the number of services firms is increasing every year, reflecting their growing contribution to private R&D spending. Services are a very heterogeneous category: the “Information and communication” category, for example, is less distant from the manufacturing sector than from the real estate business. Furthermore, exports of services are still not well measured (or declared) and are not always very distinguishable from movements of capital. Veiled behind these imperfections in statistics, globalization is not sparing the services sector, which will form an increasing share of international transactions.

Still, for the moment, it is undeniable that the manufacturing sector governs R&D’s share of GDP and that the decline in France’s market share reveals the productive difficulties companies are experiencing. But we must begin now to anticipate the changes taking place in the boundaries between sectors and not become locked into a reading of economic activity that is incapable of grasping the areas where added value will be created in the future. Re-industrialization in the sense of increasing the role of manufacturing (or “a return to the age of doing”) is not necessarily the salvation of the economy of the future.

At the same time, industrial policy as such was not responsible for de-industrialization, nor is it able to counteract the decline in industrial employment.

The reasons for de-industrialization – beyond the important role played by technical progress – are to be found in the conditions governing the exercise of economic activity in France relative to the rest of the world: from the incentives to innovate to the incentives to invest, from taxation to regulation, from skills to productivity.

To put it another way, industrial policy was not the cause of the difficulties of Alstom, of AREVA or of Nokia’s takeover of Alcatel-Lucent, and even less so of the logistics merger of Norbert Dentressangle and XPO.

It should be recognized that France’s industrial policy is sometimes erroneously confused with what some call “industrial engineering”. As public companies have historically been the spearhead of industrial policy, policy had the distinctive feature of combining industrial logic with the logic of the economic and political powers, and the two were not always in synch. These inconsistencies could exacerbate the difficulties facing State-owned enterprises.

Industrial policy should content itself with boosting technological trajectories and promoting business growth. The renovation of industrial policy will involve a comprehensive approach to future technologies. The mechanisms for this will include the development of public-private partnerships and the outsourcing of operations to long-term independent administrative agencies. In this respect the political consensus needs to be extended to include the means for this in order to ensure the continuity of these agencies, so as to stabilize the institutional landscape in which business operates.

Industrial policy is the expression of technological orientations. It can be more or less interventionist and can go beyond more or less simple declarations of intent based on the budgets it is given, depending on overall budgetary constraints. It is especially critical that public funds are committed or private funds are directed so as to finance the demand placed on business. But it is necessary for this public financing to correspond to a genuine request by the State, such as the need for defence equipment to meet foreign policy or the conquest of space, or to a real decision to involve society in its use, such as green energy. Furthermore, in a democracy, the State’s request needs to have the support of society, which should be willing to finance, for example, green energy by paying more for carbon and fuel, along the lines of what has been done in Germany.

In this sense, Emmanuel Macron’s approach to industrial policy reflects a positive development. Cutting 34 future projects down to fewer than a dozen is relevant, because it helps to clarify the State’s commitments and make them more credible. In addition, the digital commitment is the transcription of a technological choice. At the moment “re-industrialization” is focused around the industries of the future, the digitization and modernization of industrial facilities. It would be more honest to dispense with the goal of “re-industrialization” since what is needed is to deal with the economy as a whole and modernize the means of production in order to make France’s productive tissue out of a new stronger fabric.

However, the stated objectives are not based on very risky technological choices and do not commit many resources: a 2.5 billion euro tax benefit for companies investing in their productive facilities over the next 12 months (the accelerated capital cost allowance – “sur-amortization” – announced a month ago) and 2.1 billion euros in additional development loans by BPI France for SMEs and ETI over the coming two years. This will thankfully not entail creating another intermediation body for the new policy. As for the role of the State shareholder, the speech was more serene vis-à-vis globalization and more encouraging with regard to European cooperation – as has been shown in the reaction to Nokia’s merger process with Alcatel Lucent. The Minister’s decisions do not however seem to be departing from a full neutrality, as can be seen in the case of the double voting shares that the State has imposed on Renault.

The overhaul of industrial policy remains modest in terms of resources and goals, but it has the merit of setting objectives for policy that it might actually be able to meet.


Which companies are investing in France?

By Sarah Guillou

At a time when investment has become a priority for the European Union, the IMF and France, at a time when the French government is preparing legislation to boost business investment, it is urgent to look into who is actually investing in France’s physical capital[1].

Physical investment in France’s commercial sector is concentrated in certain sectors: manufacturing, trade, transport, real estate, information and communication, along with the generation of electricity and gas. These “big contributors” totalled 72% of all tangible investment in 1997, and 70% in 2011. This temporal stability obscures two major changes: the manufacturing and real estate sectors saw their contribution to investment change dramatically. The decline in manufacturing’s share of GDP has resulted in a decline in the share of investment in machinery and tools. However, this type of investment includes investments in automation and computerization, which are major vectors for boosting productivity. Nor was this decline offset by investment in the information and communication sector, which also invests heavily in machine tools.

The steep rise in real estate and construction prices inflated construction’s share of investment. It is particularly noteworthy that the increase in construction prices has captured a large share of business spending on capital investment, thereby diverting financial capital from productive destinations. While this dynamic growth in investment in construction has indeed positively influenced investment trends in physical assets, it mainly explains the dynamics of investment in the property sector. Construction prices have not fallen since the crisis, even though the volume of investment has fallen sharply.

The resilience of the investment rate France’s non-financial companies is due in part to investment in construction, but this holds true especially for the real estate sector and the transport sector.

The highest investment rates are on the part of the big corporations and firms with the highest profit rates. Furthermore, the rate of investment is positively correlated with the debt ratio, exporter status, export intensity and R&D intensity. In contrast, human capital indicators such as labour productivity or average hourly earnings tend to be negatively correlated with the investment rate.

The continuation of deindustrialization and the outsourcing of manufacturing could accelerate the decline in investment in machine tools and equipment. The development of information and communication technology and of this sector more generally could offset the decline in manufacturing. Given that investment in machine tools is a source of higher productivity, maintaining a solid level of activity in the manufacturing sector and the information and communications sector is imperative.


[1] Note de l’OFCE no. 50 of 22 April 2015 [in French] characterizes the sectors and companies that invest in France.


Europe’s control of public aid: good or bad for industry?

By Sarah Guillou

Following a meeting of the Ministers of Industry in Brussels on 20 February 2014, Arnaud Montebourg criticized the European Commission’s control of aid, which he considers too strict at a time when industry needs assistance. He wants aid for energy-intensive industries to receive an exemption due to competition from US companies that have much lower energy costs (estimated, on average, at one-third of the cost in Europe). More generally, Arnaud Montebourg was very critical of Joaquin Almunia, the European Commissioner for Competition. So is the Minister of Industrial Renewal (Redressement productif) right to castigate the control of State aid by the European Commission?

What does public aid for business entail?

“A transfer of wealth, directly or indirectly, from a public entity to an autonomous economic entity” – public aid to business can take a variety of forms. In France, half of State aid is made ​​up of tax expenditures (tax credits or various exemptions), a third of financial support (loans, guarantees, capital), and the rest consists of direct and indirect subsidies.

A recent report by the General Inspectorate of Finance (IGF 2013) estimated the amount of public aid granted by the central government and local authorities to economic actors at 110 billion euros. Included in this total are measures such as reduced VAT rates (18 billion), reductions on social security contributions on low wages (21 billion), the CIR research tax credit (3.5 billion), as well as more than 600 State schemes and even more under local authorities.

The report highlights the complexity of the system of aid, which is the result of a kind of sedimentation of successive measures, sometimes with intervention levels intermingled, and with many programmes involving small amounts. Criticizing the goals and effectiveness of this system, the report’s authors lament that industry is not a bigger target: ultimately it receives only 2 billion euros (excluding CIR and relief from social security contributions and VAT), while agriculture receives 4 billion.

What justifies the European Commission’s control of public aid?

A direct consequence of the implementation of the single market, Europe’s control over State aid is a tool of European competition policy that is intended to ensure the existence of fair competition and to fight against distortions created by advantages granted by a State to its own companies. The fight against a “race to the top” in terms of aid is thus subject to control. Under Article 87, paragraph 1, of the Treaty establishing the European Community, State aid is deemed incompatible with the common market, and Article 88 gives a mandate to the Commission to control such aid. But Article 87 also specifies the criteria that make aid “controllable” by the Commission.

A policy of support comes under the control of the Commission if it involves 1) specific aid (aid not paid to all firms or households, such as a general tax reduction), 2) the support policy involves a commitment of the State’s public finances, whether direct grants, soft loans, tax credits, the supply of equipment, etc. 3) the support provides a specific advantage to companies, an industry, or a region (which they would not have received without the State’s intervention) 4) the support distorts competition and may affect trade between the Member States – the de minimis rule exempts small amounts of aid.

What aid requires notice to the European Commission?

Aid to companies is subject to approval by the European Commission when it exceeds 200,000 euros over three years and it is not covered by arrangements for exemptions decided by Europe. In theory, aid may be granted only once the Commission’s approval has been obtained. This is binding at a time of emergency measures and undeniably affects economic sovereignty. The interval between notification and a decision can range from 2 months to 20 months, or even more if an investigation is needed. The Commission has the power to require the reimbursement of aid that has been already paid and is deemed illegal; the EU Directorate-General for Competition exercises this control, with the exception of aid for agriculture and fisheries, which is under the control of their respective directorates. Legislation is constantly being adjusted to the economic situation, as happened at the time of the financial crisis in order to support the banking sector.

In an effort to simplify the controls and reduce administrative burdens, a general regulation on block exemptions, adopted in 2008, has clarified cases where no notification is necessary. There are numerous exemptions, which revolve around the following five themes: the Lisbon strategy, sustainable development, the competitiveness of EU industry, job creation, and social and regional cohesion. This system of exemptions shows that control is also an expression of European policy choices that are guiding State aid, and therefore public resources, towards uses that accord with these choices.

Is aid often refused?

According to Mr. Almunia, 95% of the aid examined is authorized. The statistics provided by the 2000-2013 Scoreboard (DC, Europa Scoreboard) show that 88% of notifications related to industry and services lead to the conclusion that the support measure in question does not fall within the definition of public support, hence there is no objection. Another 5% of decisions are positive, and 1% are conditional. This comes close to the 95% cited. The remaining 5% consist of support measures that have been rejected by the Directorate for Competition, part of which (4%) will be recovered. Since 2000, this amounts for all the Member States to 251 refusals, the equivalent of an annual average of 22 refusals from 2000 to 2007, and 12 from 2008 to 2013.

The notifications from the French State overwhelmingly concern regional aid, especially for the DOM-TOM overseas territories, aid for certain agricultural sectors, and aid for R&D. For example, aid to Renault’s HYDIVU project from the Agency for the environment and energy, notified in March 2013, resulted in a decision in October 2013 that the measure did not raise any objections. The aid to R&D for innovative young companies notified in December 2013 led to a decision in February 2014 by the Directorate for Competition that the measure did not raise any objections and was covered by the exemptions for support for R&D.

More recently, the Commission agreed to the State’s entry into PSA’s capital after having accepted the need for the company’s restructuring in July 2013 (decision SA.35611). This capital acquisition was not found to constitute State aid. The French State was considered a private investor, just like the Chinese company Donfeng.

In 2013, the French government issued 47 notifications, none of which raised objections. To date only one is under investigation: the alleged subsidies to public transport in the Ile-de-France region around Paris.

What is France’s position with regard to State aid?

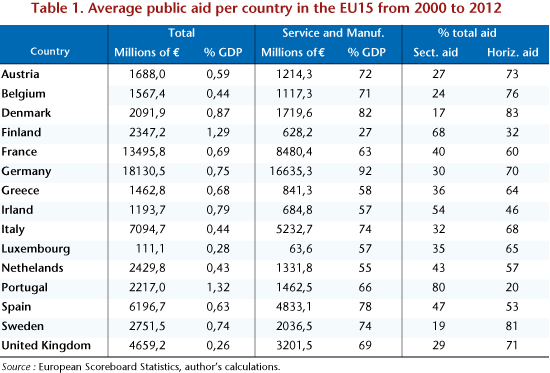
Of all the notifications addressed by Member States to the Directorate for Competition from 2000 to 2013 – i.e. 4765 in the field of industry and services – France sent 8.8%, compared with 10% for Italy and Spain, 17% for Germany and 6.4% for the UK. The French State, so often accused of a Colbertist tendency, on average gave notice over the period of about half as much aid as Germany. The statistics provided by the “Scoreboard on State aid” (DC, Aid in volume and as a % of GDP) can be used to see France’s position in the EU15 in terms of the volume of aid granted relative to GDP. Table 1 shows that France is about average: higher than the group of countries with a free market tradition (UK, Netherlands, Belgium, Austria, Luxembourg) but below countries with a social-democratic tradition (Denmark, Finland, Sweden, Germany). With regard to the volume of aid relative to its purpose, it is customary to distinguish sectoral aid that benefits a particular sector, an “old version” brand of industrial policy, from horizontal aid that caters to all businesses, a “modern” brand of industrial policy, such as support for R&D. Once again, France occupies a middle position in terms of the percentage of sectoral aid relative to the EU15 group.

TAB1_SG_Eng250314

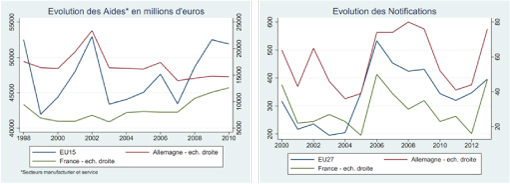
Both the volume of aid and the notifications are very sensitive to a country’s economic and institutional environment and to shocks to this environment (German reunification, industrial restructuring, etc.). France is among the countries that have granted more aid in the recent period (2010-2012) than in the beginning of the crisis period (2007-2009). Countries that are comparable to it (Germany, Italy, Spain) have instead reduced their aid payments. The following graphs show changes in the volume of aid (constant euros). While the amount of aid clearly increased in 2007, the crisis does not seem to have fundamentally altered behaviour in terms of notifications. Aid for the banking industry is the subject of a specific legal system and separate accounting. The amounts described therefore do not include aid to the banking sector.

IMG_Blog_Sarah_25-03

Source: DC, Europa State Aid Scoreboard Statistics.

There is nothing to show that the European Commission’s controls on aid have hurt industry

This brings us to the question that concerns our Minister. If the level of public aid is positively correlated with manufacturing’s share in the economy (see Guillou S., 2014), this is mainly because the characteristics of the manufacturing industry – regional imbalances, R&D, environmental investment – correspond more to the criteria for the authorized payment of aid. The manufacturing sector has also been characterized historically by lobbying, a potential trigger for aid, and is also the sector most exposed to international competition. There is no evidence that the causality would run from State aid to manufacturing’s share of value added. The reverse is much more likely.

Moreover, a careful analysis of the European Commission’s control of aid shows that negative decisions are relatively rare. But a strong inhibitory effect cannot be excluded, in the sense that governments might exercise self-censorship in light of their knowledge of the case record of Europe’s Directorate for Competition. This kind of censorship is difficult to quantify, but it is detectable for all the Member States in the decrease in notifications since controls were implemented.

There is however much room for exemptions, spaces in which aid to industry may be authorized. If indeed it is not possible to envisage a “CICE” tax credit that would be reserved for companies in the manufacturing industry alone, as this would be too selective, any measure is acceptable that is considered support for innovation and R&D, the development of renewable energies, the handling of regional and major sectoral imbalances, or job creation.

Moreover, a judgment on aid’s legality is based on an economic cost-benefit analysis, which is sometimes not exempt from criticism or debate, but is undeniably based on an economic assessment of the allocation of public funds and of any distortions in competition that this allocation could create. There are a priori rules mandating rejection or acceptance, but most cases are subject to a reasoned economic analysis. This consists of a “balancing” between “the contribution to the attainment of an objective of well-defined common interest”, such as efficiency or equity, and “the resulting distortion of competition and trade”. The measure is also reviewed in order to determine its appropriateness, its effectiveness as an incentive and its proportionality. Finally a comparative scenario, a sort of counterfactual that envisages no implementation of the aid, is also used to help reach a decision.

On the question of support for energy-intensive industries, firms that consume electricity intensively have generally negotiated preferential rates with energy providers. This was the case in France with the Exeltium consortium, but it is also the case in Germany. Whether this involves preferential tariffs granted by a State-owned company (historical supplier) or a tax exemption or reduction, these measures have been analyzed by the Directorate for Competition. To date, these special rates have not encountered systematic opposition, but the process of deregulating Europe’s electricity market and the new regulation on aid for the environment and energy – scheduled for the first half of 2014 – should not necessarily work in their favour. It is still the case that the best support for industries that intensively consume energy, and not just electricity, remains the appreciation of the euro vis-à-vis the dollar, which is reducing the cost of imported energy, even though this is rather debilitating for exporters, as our Minister frequently points out. In addition, the cost of energy is an incentive (among others) to invest in energy-saving technologies. This perfectly illustrates the economic adage that any choice (aid) is also a renunciation (of another use of resources). The competitiveness of energy-intensive industries or a policy to reduce fossil fuels – this is the choice at the heart of the European Commission’s decisions.

Control on aid is aimed at a different type of objective

It is because the control of State aid is consistent with European objectives (Lisbon Objectives, 2008 Climate and Energy Package, and now the 2030 Climate and Energy Framework) that it might be possible to develop a coherent European economic policy.

The regulatory system and the jurisprudence on public aid have proven to be relatively flexible and adaptive. This should not prevent us from discussing and commenting on the decisions of the Directorate General for Competition, particular as competition policy does not need to resemble a doctrine to be effective. It does, of course, entail some loss of economic sovereignty. But it needs to be recognized that control over aid is a major element in European economic cohesion, in the convergence of economic levels, and most of all in democracy. This reporting requirement generates valuable information for citizens about the use of public funds. Furthermore, it facilitates the readability of industrial policy and more generally of public aid from States, which citizens and the media have an interest in assessing on the eve of the upcoming European elections.


Solar power is cooling Sino-European relations

By Sarah Guillou

In early July 2013, yet another company in the solar industry, Conergy, declared bankruptcy. The departure of this German company, established in 1998, marks the end of a cycle for the solar industry. This bankruptcy adds to a series of closures and liquidations across every country that have highlighted the rising trade tension over solar panels between the United States and Europe on the one hand and China on the other (see OFCE Note 32: “The twilight of the solar industry, the darling of governments”, from 6 September 2013).As this tension peaked, in May, the European Commission decided to threaten China with a customs duty of over 45%. A trade war has thus concluded a decade of government involvement, as if this were a matter of saving the public money invested. But what it signifies most is the industrial failure of a non-cooperative global energy policy.

A promising, but chaotic, industrial start

Government worship of solar power, which took off in the early 2000s on both sides of the Atlantic, but also in the emerging economies (and especially China), has undoubtedly propelled solar energy to the forefront of renewable energies, but it has also fueled a number of market imbalances and serious industrial turmoil. With the price of oil rising constantly from 2000 to 2010, the need to accelerate the energy transition along with the commitments of the Kyoto Protocol led governments to support the production of renewable energy, with solar energy being the great beneficiary. The global industry experienced a tremendous boom, with growth of more than 600% from 2004 to 2011.

Public support, together with private investment, sparked massive market entries that destabilized the price of the main resource, silicon, the amount of which could not adjust as quickly. Fluctuations in the price of silicon due to imbalances in the market for photovoltaic panels created great instability in its supply, which was exacerbated by technological uncertainties facing companies trying to innovate in the field (such as the American firm, Solyndra, which finally filed for bankruptcy in 2013).

The trade war for a star

The intensification of Chinese domination of the industry has in turn affected the competitive uncertainty. China is now the world’s largest market, and the involvement of the Chinese government in the industry’s development is unparalleled. Today ranked third in terms of installed capacity (after Germany and Italy), China is also the world’s largest producer of solar panels. It now accounts for half of the world’s output of panels, whereas it produced only 6% in 2005. Chinese producers have received massive support from central and local government, which has also helped to saturate the Chinese market.

In addition to this public support, China also enjoys a distinct advantage in labour costs, which makes the business of manufacturing solar panels very competitive – the more technologically-intensive steps are upstream in the industry, at the level of the crystallization and slicing of the silicon. In addition to this competitive advantage, Chinese producers have also been accused of dumping, i.e. selling below the cost of production. Their competitiveness is thus unrivalled … but increasingly under challenge. In October 2012, the United States decided to impose tariffs on imports of Chinese cells and modules, with anti-dumping duties varying from 18.3% to 250% (for new entrants), depending on the company.

Europe, which imports many more photovoltaic components from China than does the United States, initially opted for the approach of imposing anti-dumping duties, and launched an investigation in September 2012, triggered by a complaint from EU ProSun – a trade association of 25 European manufacturers of solar modules – on imports of panels and modules from China. In June 2013, the Commission finally decided to impose a customs duty of 11.2% on solar panels, while threatening to push this up to 47% if China does not change its position on pricing by August 6th.

The Empire counter-attacks

The counter-attack was not long in coming: in July 2013, China decided to apply anti-dumping duties on imports of silicon from the United States and South Korea. A serious threat is also hanging over the head of Europe’s firms, as China is one of the largest markets for the continent’s silicon exporters (870 million dollars in 2011).

This trade war essentially reflects a defensive position taken by China’s industrial rivals in the face of a support policy that they consider disproportionate and unfair, during a period when China has been nibbling away at the industrial jobs of its competitors for ten years. But one could question the industrial logic underlying this trade policy.

First, this policy contradicts previous government policies promoting solar energy. The trade-off between climate change goals (developing low-cost energy transition tools) and the profitability and sustainability of the industry seems to have been decided in favour of the latter. Second, while this now provides producers direct support, it could handicap installers, engineering firms involved in pre-installation work, and manufacturers of panels using Chinese components. Finally, this is leading to serious exposure to potentially costly trade retaliation, which could mean exporters of poly-crystalline silicon or machinery used in the solar industry, or other industries such as wine or luxury cars.

Out of fear of a probable lack of approval by a majority of EU members or in order to “slay other dragons” more freely (the coming telecoms conflict), the agreement reached in late July by Commissioner Karel De Gucht and approved by the European Commission on August 2nd should not lead to trade retaliation nor disturb market supply too much. It commits nearly 90 Chinese producers not to sell below 56 cents per watt of power. This price is a compromise between what is considered consistent with the cost of Chinese production and the current average price on the market on the one hand and what is acceptable to European competitors on the other.

Finally, over the decade from 2002 to 2012 the solar photovoltaic industry has undeniably become global and highly competitive, despite clear-cut government interventionism. In reality, even the governments competed. Now they are settling their disputes by playing with international trade rules. Costly state support has propelled the growth of the sector beyond all expectations: by creating excess supply, the price of solar panels dropped sharply and accelerated the incredible boom in solar power. In 2013, solar power represented more than 2% of the electricity consumed in the European Union. This breakthrough by solar energy was accompanied by numerous entries and exits from the market, without so far giving rise to a significant business concentration. The choice of a public pull-back in favour of trade policy represents a new page in the history of this industry, which is no longer being driven so much by energy policy or even by industrial policy. There is obviously no dusk without a future dawn. But tomorrow’s dawn will certainly see the rise of a different “solar”. Europe’s future in the manufacture of solar panels will involve technological innovation aimed not so much at reducing costs as at improving performance.


Vertical networks or clusters: what tool for industrial policy?

By Jean-Luc Gaffard

The concept of a “vertical network” [filière] is back in the spotlight and is playing the role of an instrument of the new industrial policy. A working document of the Fabrique de l’Industrie [Manufacturing Industry], ‘What use are ‘vertical networks’?” (Bidet-Mayer and Tubal, 2013) recognizes that the concept has the virtue of helping to identify good practices and develop their application in relationships between businesses and between business and government. However, the same paper concludes by questioning the merits of a concept that emphasizes an approach to industrial organization that is more technical than entrepreneurial.

Our purpose here is to explore this issue and to challenge the relevance of the “vertical network” concept and to advocate instead the notion of a “cluster”, which seems to correspond better to the need – for industrial policy – to recognize the leading role of the company in making strategic decisions.

The “vertical network”: a simplistic notion

In its old but strict sense, a “vertical network” consists of all or part of the successive stages of production, ranging from raw materials to the final product. This chain of products extends from upstream to downstream and is composed of technical relationships, which are identifiable based on technical coefficients of production. These are subsets of input-output tables that are characterized by the existence of a high level of spill-over or dominance effects that stem from the fact that the concentration of relationships is denser in some industries than in others (Mougeot, Auray and Duru, 1977).

Defined like this, a “vertical network” obviously says nothing about industrial organization per se, that is to say, about how firms set the boundaries for their activities. The companies concerned may choose to integrate the different stages in a vertical network or on the contrary focus on one stage and build pure market relations both upstream and downstream. They can also choose to form a relationship that could be described as a hybrid, based on medium-term contractual relationships both upstream and downstream.

The organizational decision takes place in a specific technical context, based on a comparison between the costs of operating through the market, through contracts or through internal transactions (Coase, 1937; Williamson, 1975). The technical features are covered over by the transaction costs and have limited relevance. The specific characteristics of the assets, which have a technical dimension, are taken into account in making the choice, but primarily because of the possibility for opportunistic behaviour (hostage-taking) that it permits.

The designation of a thusly defined “vertical network” as a tool of industrial policy, based on a certain stability of technical relations, creates an obstacle to innovation, whose major characteristic is to upset linkages within the vertical network and thus its very structure. In fact, the use of the “vertical network” concept really holds interest only for a short-term perspective, when it comes to measuring the impact of the transmission of cyclical fluctuations within a technically stable, productive structure (Mougeot, Auray and Duru, 1977).

The industrial policy measures that flow from this may affect how companies define the scope of their activities by affecting transaction costs. One example is the rules governing the relationships between contractors and subcontractors. But their effects are somewhat unclear with respect to the expected impact on the innovative capacity of the firms concerned.

The simplicity of the concept of a vertical network, together with its limitations, make the way that the concept is used (1) dangerous, if the fixed nature of the technique is taken literally (as has been the case in the past), and (2) ambiguous, if it is understood as dealing with the technical and organizational changes inherent in a market economy. As evidence of this ambiguity, consider a list of “vertical networks” today, which refer to objects such as cars, trains and planes; to luxury items whose most common feature is that they are aimed at a very rich clientele; to generic technologies such as information and communication technology; and to social issues such as health care and the ecological transition, not to mention the mishmash constituted by the consumer goods industry.

While the notion of a vertical network, that is to say, a group of industries that are technically related, has to some extent fallen into disuse since the 1980s, it is precisely because strategic business decisions are far from being dominated by technology, and a frozen state of technology in particular. The structuring of the industrial fabric is constantly changing as a result of the choices and constraints that determine them. In other words, industries are more the result of processes of innovation than of technical frameworks that supposedly control strategic choices.

It is not surprising, then, that industrial policy in the narrow sense of direct aid to companies in specific sectors has itself fallen into disuse and made room for policies on competition and regulation that are designed as efforts to move closer to a state of full competition.

The company: the essential reference

This observation does not mean that intra- and inter-vertical network relations do not matter and that all that counts are market incentives. Companies are not islands of planned coordination in a sea of ??market relations. They come to agreements about technology, distribution and marketing and develop subcontracting relationships and create joint ventures (Richardson, 1972). There is a major reason for this. To invest, a company has a need for coordination that cannot be met simply by the competitive market, but rather involves the emergence of forms of cooperation that reflect membership in a particular group. This company is characterized by its mobility, which leads it to introduce new products or even to change vertical network, thereby upsetting the relationships it has formed with others, but always along a trajectory that is determined by its core competencies.

Generally speaking, companies interact and have to solve difficulties in coordination arising from a lack of information. This is not so much a lack of technical information as a lack of information about market conditions, meaning the configuration of demand but also of competing and complementary suppliers (Richardson, 1960).

In fact, companies face two deadlines: a deadline for the gestation of irreversible investments, including investments in intangibles, and a deadline for acquiring market information. To deal with this and decide how to invest effectively, companies need to have a certain degree of confidence about the levels of competing investments and of complementary investments. The coordination required is not assured solely by market signals or, more precisely, by price signals alone. This also demands that cooperative relationships between companies complement their competitive relations (Richardson, 1960). These relationships constitute business networks for which the qualification of a “vertical network” is undoubtedly too narrow, even if technical proximities or complementarities do play a role. Belonging to a group characterized by having broadly similar skills or qualifications, rather than to a vertical network or business sector, is related to these relationships which secure the investments of each group member.

Companies seeking to innovate do not mainly face the existence of entry barriers (due to the price or investment behaviour of the established companies) or barriers to business creation. They have to deal in particular with the existence of barriers to growth that are related to their ability to be mobile (Caves and Porter, 1977). It is obviously difficult for companies to enter new business fields or to increase their size significantly. They are successful in attaining new size thresholds whenever they can acquire new managerial capabilities and ensure control of their capital. They enter into a new activity, possibly one that is quite different from their current activity in terms of the markets served, only so long as the technical and managerial skills in one business are useful in the other. Thus business groups come into being that are organized around similar or complementary skills, which transcend divisions into industries or sectors. These groups are the arenas where competition is carried out. Their very nature limits, or even thwarts, the development of an oligopolistic consensus. Because of their structural similarities, each group member responds in the same way to internal and external disturbances and anticipates the reactions of the others with a good deal of accuracy (Caves and Porter, 1977). A sort of coordination and mutual dependence thus develops within each group.

Based on this dual observation of the need for both coordination and mobility, it is clear that an industrial fabric is complex and can only with difficulty be reduced to “vertical networks” in the original meaning. Industrial policy is thereby inevitably affected, as it cannot be reduced to direct aid to firms, sectors or even technologies, nor to the application of rules on supposedly perfect competition.

Clusters: a suitable response

The nature of the productive system requires a horizontal industrial policy, which involves in particular subsidizing R&D and occupational training, but which makes sense only if this type of aid is conditional on the achievement of the objective of business mobility and of vertical as well as horizontal cooperation between companies.

It is with regard to this objective that the creation and development of clusters should be preferred, this being understood to mean groups or networks of companies and institutional structures that, while certainly having a geographical dimension, cannot necessarily be reduced to a strictly defined territory. A cluster is primarily a tool that aims to develop both voluntary cooperation between companies and a network of expertise. Its configuration is determined by the companies. The capacity building that arises from this organizational network nourishes a capillary type of action and the progressive entry of the individual members into new fields of activity.

Logically speaking, the initiative for these clusters should come from the companies themselves, with the government’s role being to encourage them, specifically by making its aid contingent on the reality of the cooperation achieved. Ensuring that there is genuine cooperation requires that public funding be conditional on the contribution of private funds. The method of governance must recognize the pre-eminent role of the firms in the industry. It is this feature that has underpinned the success of German industry – it is, to say the least, risky to chalk this success up to competitiveness gains generated by labour market reform (Duval, 2013).

In this light, there should be nothing surprising about the successes and failures of industrial policy. When these configurations have the characteristics of clusters in the sense used here, whether this involves aerospace, automotive or railway, the mechanisms implemented have allowed for credible projects that have promoted competitiveness. When the supposed industries are loosely or not at all structured and bear no relationship to clusters, the failures are obvious, because there are no eligible projects under existing public procedures and in particular because of the weak involvement of small and medium-sized enterprises in collaborative projects.

The fact that the vertical networks adopted cover almost every industry forbids, moreover, any real discrimination between the forms of industrial organization. There is thus a very real risk that public funds will be wasted. Some groups, who are accustomed to dealing with the government, will capture aid for projects that they would have carried out anyway, while at the same time companies that are engaged in innovative activities will not win any support, due to failing to fit the pre-defined framework.

Once again on the question of company size

There is a functional relationship between organizational efficiency and the growth rate, with the first falling when the second rises beyond a certain threshold (Richardson, 1964). The exploitation of new investment opportunities normally goes to companies that have the most suitable production experience, business contacts and marketing skills. These capabilities are a matter of degree. The degree of organizational constraint will depend not only on the growth rate but also on the direction in which the expansion takes place. This will also depend on the extent to which the company concerned can acquire the skills, including managerial, required to be mobile without incurring excessive costs (Richardson, 1964). A cluster type organization will be able to help.

The cluster is a place for exchanges and skills transfers that facilitate the entry of firms into new fields of activity, even if only geographical, which should enable the smaller ones to grow in size. The cluster organization can also promote mechanisms that facilitate the access by small firms to the financing required for investment, while at the same time allowing them to retain control of their capital, and thus their identity.

By way of a conclusion

As is clear, industrial policy should not amount to planning based on a purely technical approach to industrial organization, the kind captured in the “vertical network” concept, which would make it hostage to local and national lobbies. Nor should it be reduced to regulatory and competition policies designed for a virtual world where the only relations among companies are market relations. It must be understood as a way to stimulate the creation and development of clusters designed as operational networks of expertise, whose governance must be ensured under conditions that favour entrepreneurial decisions, and not bureaucratic ones.


Bibliography

Bidet-Mayer, T. and L. Toubal (2013): “A quoi servent les filières?” [What’s the use of “industries”], Working document, La Fabrique de l’Industrie.

http://www.la-fabrique.fr/Chantier/a-quoi-servent-les-filieres-document-de-travail

Duval, G. (2013): Made in Germany: le modèle allemand au delà du mythe, Paris: Le Seuil.

Mougeot M., Auray J.-P. and G. Duru (1977): La structure productive française, Paris: Economica.

Richardson, G.B. (1960): Information and Investment, Oxford: Clarendon Press (Reed. 1990).

Williamson, 0. (1975): Markets and Hierarchies, Analysis and Anti-Trust Implications, New York: Free Press.
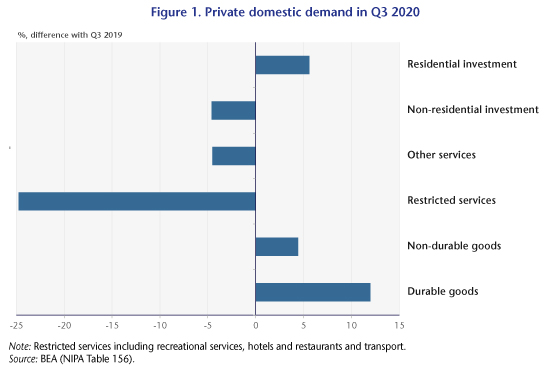


The tax credit to encourage competitiveness and jobs – what impact?

By Mathieu Plane

Following the submission to the Prime Minister of the Gallois Report on the pact for encouraging the competitiveness of French industry, the government decided to establish the tax credit to encourage competitiveness and jobs (“the CICE”). Based on the rising trade deficit observed over the course of the last decade, the sharp deterioration in business margins since the onset of the crisis and growing unemployment, the government intends to use the CICE to restore the competitiveness of French business and to boost employment. According to our assessment, which was drawn up using the e-mod.fr model as described in an article in the Revue de l’OFCE (issue 126-2012), within five years the CICE should help to create about 150,000 jobs, bringing the unemployment rate down by 0.6 point and generating additional growth of 0.1 GDP point by 2018.

The CICE, which is open to all companies that are assessed on their actual earnings and are subject to corporation tax or income tax, will amount to 6% of the total wage bill for wages below 2.5 times the minimum wage (SMIC), excluding employer contributions. It will come into force gradually, with a rate of 4% in 2013. The CICE’s impact on corporate cash flow will be felt with a lag of one year from the base year, meaning that the CICE will give rise to a tax credit on corporate profits from 2014. On the other hand, some companies could benefit in 2013 from an advance on the CICE expected for 2014. The CICE should represent about 10 billion euros for the 2013 fiscal year, 15 billion in 2014 and 20 billion from 2015. As for the financing of the CICE, half will come from additional savings on public spending (10 billion), the details of which have not been spelled out, and half from tax revenue, i.e. an increase in the standard and intermediate VAT rate from 1 January 2014 (6.4 billion) and stronger environmental taxation.

This reform is similar in part to a fiscal devaluation and in some respects bears similarities to the mechanisms of the “quasi-social VAT” (see Heyer, Plane, Timbeau [2012], “Economic impact of the quasi-social VAT” [in French]) that was set up by the Fillon government but eliminated with the change of the parliamentary majority as part of the second supplementary budget bill in July 2012.

According to our calculations using 2010 DADS data, the CICE would lower average labour costs by 2.6% in the market sector. The sectors where labour costs would be most affected by the measure are construction (-3.0%), industry (-2.8%) and market services (-2.4%). The ultimate sectoral impact of the measure depends both on the reduction in labour costs and on the weight of wages in value added in a given sector. Overall, the CICE would represent 1.8% of the value added of industrial enterprises, 1.9% of the value added in construction and 1.3% in market services. In total, the CICE would represent 1.4% of the value added in market sector companies. According to our calculations, the total value of the CICE would be 20 billion euros: 4.4 billion in industry, 2.2 billion in construction and 13.4 billion for market services. Industry would therefore recover 22% of the total spending, i.e. more than its share of value added, which is only 17%. While this measure is intended to revive French industry, this sector would nevertheless not be the primary beneficiary of the measure in absolute value, but, along with the construction sector, has the best exposure relatively speaking due to its wage structure. Furthermore, industry can benefit from knock-on effects related to reductions in the prices of inputs generated by the lowering of production costs in other sectors.

The expected effects of the CICE on growth and employment differ in the short and long term (see graphic). By giving rights in 2014 based on the 2013 fiscal year, the CICE will have positive effects in 2013, especially as the tax hikes and public spending cuts will not take effect until 2014. The result will be a positive impact on growth in 2013 (0.2%), although it will take longer to affect employment (+23,000 in 2013) due to the time it takes employment to adjust to activity and the gradual ramping-up of the measure.

On the other hand, the impact of the CICE will be slightly recessive from 2014 to 2016, as the loss in household purchasing power linked to higher taxes and the cuts in public spending (household consumption and public demand will contribute -0.2 GDP point in 2014 and then -0.4 point in 2015 and 2016) will prevail over lower prices and the recovery of business margins. Apart from the first year, the CICE’s positive impact on growth related to income transfers will be slow to be seen, as gains in market share related to lower prices and to higher business margins are dependent on a medium / long-term supply-side mechanism, with demand-side impacts being felt more rapidly.

The implementation of the CICE will gradually generate gains in market share that will make a positive contribution to activity by improving the foreign trade balance (0.4 GDP point in 2015 and 2016), whether through increased exports or reduced imports. From 2017, the external balance will not contribute as much to the economy (0.3 GDP point) due to the improved purchasing power of households, resulting in slowing the reduction in imports. Despite the higher margins and the improved profitability of capital, productive investment will fall off slightly due to the substitution effect between labour and capital and the negative accelerator effect related to the fall in demand.

With the decline in the cost of labour relative to the cost of capital, the substitution of labour for capital will gradually boost employment to the detriment of investment, which will lead to job-rich GDP improvements and to lower gains in productivity. This dynamic will result in steady gains in employment despite the slight fall-off in activity between 2014 and 2016. Due to the rise in employment and the fall in unemployment, but also to possible wage compensation measures in companies arising from the greater fiscal pressure on households, wages will regain part of their lost purchasing power based on an increase in real pay. This catch-up in purchasing power will help to generate growth, but will limit the impact on employment and productivity gains.


Valuing energy savings fairly

By Evens Salies [1]

Following the first meeting of the Commission mixte paritaire (a joint commission of the two houses of the French Parliament) on the proposed legislation to “make the transition to a sound energy system”, it is important to examine the reasons that led the Senate to adopt a motion on 30 October 2012 to dismiss this bill. This rejection is based on errors of judgment that reflect the difficulty of defining a residential energy pricing that is efficient and fair in light of the government’s objectives to control energy demand. It also seems appropriate to seek clarification of whether the proportional pricing in force needs to be corrected in order to reward energy savings.

The opposition of the parliamentarians focuses on the following point: the bonus-malus system breaches the principle of equal treatment of citizens regarding access to energy.[2] This argument is reminiscent of the annulment by the Constitutional Council in 2009 of the carbon tax.[3] It is nevertheless surprising, since the principle of equal treatment is not fully respected by the current system of tariffs. In practice, each household pays two local taxes on their final consumption of electricity. However, the taxes differ from one town or department to another, for reasons that are difficult to explain. The Senators also criticized the progressivity of the bonus-malus system that is to be superposed on the current rates, treating it as a hidden tax. There seems to be little grounds for this criticism in that the social tariffs already introduce some progressivity.[4]

The innovative element of the bill concerns the compatibility between the proportional pricing in force and the valuation of energy savings. Between households of similar composition who are subscribers at the same rate, there is already a reduction for the household that controls its usage. But is this reduction sufficient to compensate for the effort? In other words, should we consider that a kilowatt-hour of savings that costs an effort has the same economic value, in absolute terms, as a kilowatt-hour that is simply consumed? Everything depends on whether the savings in question is considered a gain or a loss. For households in the latter situation, the savings is seen as a cost. So the savings is not made, which is why the bonus-malus system would be effective. The others do not need an added incentive.

The bonus-malus system does not simply offer a discount (bonus) that is to be funded by the overages. [5] It also aims to inform individual households about their behaviour, i.e. whether it is virtuous or not, which is consistent with several recent observations in the literature: a household does not base its energy consumption on tiny marginal pricings, which are counted in centimes per kilowatt / hour and which people understand only imperfectly. Changes in the amount of the energy bill and announcements of price fluctuations play a greater role. Bonuses and penalties thus matter less as absolute values than as signals sent to households by their relative values on the invoice.

The superposition of the bonus-malus system on the rates in effect will of course initially simply amplify the gaps in spending between users. But the bonus that would apply on the bill of households whose behaviour benefits everyone is no less legitimate than the discounts enjoyed by households who changed suppliers once the retail energy markets were opened to competition.

Unfortunately, the rejection of the Brottes bill has ended any educational discussion about the relationship between energy efficiency and residential energy pricing. The lack of enthusiasm for the topic in the public debate is easy to perceive from reading the recent, voluminous report of the Commission of Inquiry on the actual cost of electricity. This is not so surprising in a sector where innovation is encouraged more on the supply side. The effacement diffus scheme is the latest example.[6] But without innovation in the structure of energy tariffs too, will France be able to achieve its goal of reducing energy consumption?


[1] The author would like to thank Marcel Boiteux, Marc-Kévin Codognet, Jérome Creel, Gilles Le Garrec, Marcelo Saguan and Karine Chakir. The opinions expressed in this note are the responsibility of the author alone.

[2] This principle is ensured by tariff equalization: the schedule of tariffs is the same regardless of the place of residence.

[3] On the grounds that this tax violates the equality of taxpayers with respect to the public tax burden.

[4] Crampes, C., Lozachmeur, J.-M., 10 Sept 2012, “Les tarifs progressifs de l’électricité, une solution inefficace”, Le Monde.

[5] In the case where the sum of the penalties is not enough to cover the bonuses, the State will finance the deficit. And even in the absence of a deficit, as the distribution of virtuous consumers is not necessarily the same from one provider to another, an equalization of the bonus-malus balances should be applied so that everyone ends up with a zero balance.

[6] This consists of interrupting the power to a radiator or boiler for 10 or 15 minutes.