Should we be worried about the slowdown in China?

By Eric Heyer

China’s growth is slowing. This does not really come as a surprise: the slowdown was announced by the Chinese authorities; it can be seen in the national accounts; and it was predicted in all the medium-term scenarios of the major international organizations. It corresponds to a new phase in China’s economic and social development, towards growth that the authorities want to be more “qualitative, inclusive and innovative”.

However, many analysts and experts believe that the Chinese economy has slowed down more than is reflected in the country’s national accounts. According to a survey conducted in 2015 by Bank of America Merrill Lynch, 75% of investors are convinced that the real growth rate of the Chinese economy was less than 6% in the second quarter of 2015 on an annualized basis. For some, the overestimation of growth is due to an underestimation of inflation, particularly in the service sector. For others, China’s GDP growth rate needs to be correlated with the rate for electricity generation and be in line with freight by road, rail, sea or air. However, all these values have experienced ​​a significant decline since the start of 2014, and the stable relationship between GDP and these elements tends to indicate lower annual growth for the Chinese economy, of around 2% in early 2015 according to Artus, which is more in line with the observed fall in imports. This steeper slowdown would have a violent impact on the global economy, endangering the shoots of recovery in the developed economies.

In a recent article, we estimated the link between Chinese GDP and different economic variables not taken from the national accounts, using an error correction model (ECM) to evaluate the slowdown, before giving an evaluation of its impact on the GDP of the major developed countries.

Just how much is the Chinese economy slowing down?

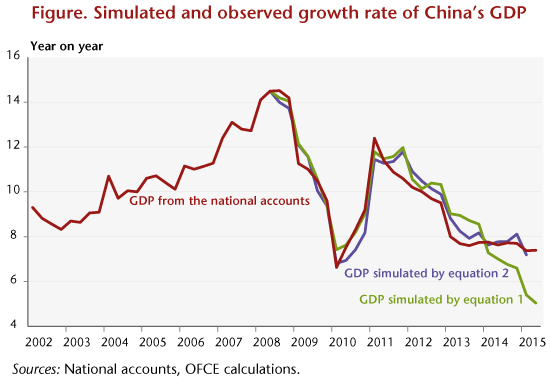
Drawing on the Li Keqiang index, we estimated China’s GDP from variables for freight and the production of electricity and cement. While our results confirm that the Chinese economy has been slowing down since 2011, from a yoy rate of 12% to less than 8% in early 2013, the stabilization of the growth rate observed since then in the national accounts is not re-traced in this simulation, which indicates instead a continued slowdown in Chinese growth (Figure 1, equation 1).

However, this modelling of GDP does not take into account the major transformation of the Chinese economic model towards a new growth model, which began three years ago and which involves high indebtedness of domestic agents and an orientation towards more services. An enhanced analysis of variables that also draw on the labour market situation (wages, jobs) confirms the slowdown in the Chinese economy as traced by the national accounts, reflecting the difficulty of the transition between the two growth models, and not the beginnings of a slide into recession (Figure 1, equation 2). On the other hand, the country’s “industrial” part should continue to decelerate, thwarting any significant rebound in Chinese imports.

ENGgraph_chine1711

What impact will the slowdown have on the developed countries?

Three channels for the transmission of the slowdown of the Chinese economy to the developed countries can be identified:

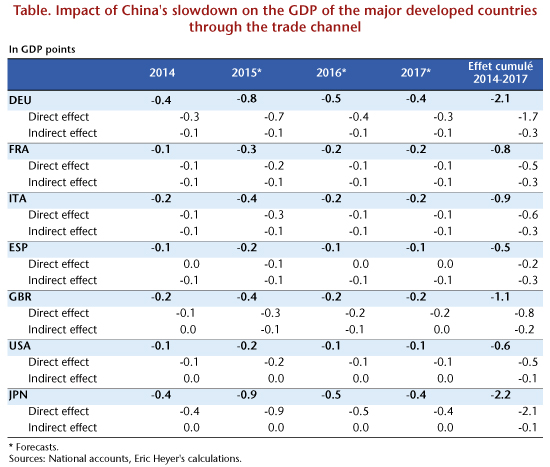
  1. Direct and indirect effects via the trade channel: Given China’s weight in world trade, the sharp slowdown in its output, particularly in industry, is significantly reducing the country’s imports (through intermediate consumption and household consumption) and is consequently cutting demand for the rest of the world’s goods. To this direct effect can be added an indirect effect due to the slowdown in partner countries affected by the reduced demand;
  2. Effects via the financial channel: The Chinese slowdown may hit direct investment in the developed countries; conversely, the withdrawal of capital from China might be an occasion for reallocating it to other developed countries;
  3. Effects via the channel of raw materials prices: As China buys more than half of all metals traded in the world and accounts for two-thirds of the increase in global oil consumption, the slowdown of its economy is hurting the prices of raw materials, especially oil, thereby causing a transfer of income from the countries producing commodities to the countries consuming them.

Looking only at the first transmission channel, trade, our results are as follows: Japan and Germany are the countries most affected by the slowdown in China. The cumulative impact from 2014 to 2017 will amount to more than 2 percentage points of GDP. The impact on Japan is due to its significant exposure to Chinese trade (3% of exports to China compared with 2.4% for Germany), whereas the impact on the German economy is due more to its degree of openness (39.1% against 14.6% for Japan). Next come the United Kingdom, Italy and France, with a cumulative impact of close to 1 GDP point. Spain and the United States are least affected, with a cumulative impact of around 0.5 GDP point: the United States has a low exposure (0.7%) and a low degree of openness (8.2%). Finally, the annual peak for the impact of China’s slowdown would hit in 2015, and knock 0.8 GDP point off the German economy and 0.9 GDP point off the Japanese economy.

ENGTab_EH_0911


The potential headache of measuring economies in public expenditure

By Raul Sampognaro

Since 2009, the French budget deficit has been cut by 3.3 GDP points, from 7.2 percent of GDP in 2009 to 3.9 points in 2014, even though the economic situation has been weighing heavily on the public purse. This improvement was due to the implementation of a tighter budget policy. Between 2010 and 2013, most of the consolidation effort came from higher taxes, but since 2014 the effort has largely involved savings in public expenditure. In 2014, public expenditure excluding tax credits[1]  recorded its weakest growth since 1959, the year when INSEE began to publish the national accounts: in value, spending excluding tax credits increased by 0.9%, though only 0.3% in volume terms (deflated by the GDP deflator).

At first glance it may seem counter-intuitive to talk about savings on spending even though the latter has been rising constantly. This rise is, however, well below potential growth, which reflects a real long-term effort to reduce the ratio of spending to GDP. Indeed, the formula usually used to calculate the effort on spending depends on the hypothesis adopted on potential growth:

To understand why the extent of the effort on public expenditure is dependent on potential growth, one must understand the underlying concept of the sustainability of the debt. There is a consensus on the theoretical definition of the sustainability of the public debt: it is sustainable if the current stock of debt could be repaid by the anticipated future stream of the State’s net revenues[2]. While the concept is clear, its practical application is more difficult. In practice, fiscal policy is deemed sustainable when it makes it possible to stabilize the ratio of public debt to GDP at a level deemed consistent with maintaining refinancing by the market.

Thus, changes in spending that are in line with that goal should make it possible to stabilize the share of public expenditure to GDP over the long term. However, as public spending essentially responds to social needs that are independent of the economic situation (apart from certain social benefits such as unemployment insurance), stabilizing its share in GDP at any given time (which would imply it changes in line with GDP) is neither assured nor desirable. In order to deal with this, changes in the value of public expenditure are compared to the nominal growth rate of potential GDP[3] (which depends on the potential growth rate and the annual change in the GDP deflator).

An increase in expenditure that is above (respectively below) the potential reflects a positive (negative) impulse, because in the long run it leads to an increase (decrease) in the ratio of public spending to GDP. While the application of this concept may seem easy, potential growth is unobservable and uncertain because it is highly dependent on the assumptions made about demographic variables and future changes in productivity. In the 2016 Budget Bill (PLF), the government revised its potential growth assumptions for the years 2016 and 2017 upwards (to 1.5% instead of 1.3% as adopted at the time of the vote on the LPFP supplementary budget bill in December 2014).

This revision was justified on the basis of taking into account the structural reforms underway, in particular during the vote on the Macron Act. This was the second revision of potential since April 2014 when it was estimated at 1.6% (2014-2017 Stability Programme). The government is not the only one to repeatedly revise its assessments of potential growth. When the European Commission published its latest projections[4], it revised its assessment of potential growth even though its previous assessment had been issued only in May[5]. It is not easy to see what new information could change its assessment now. These recurring revisions generally complicate the economic debate[6]  and cloud discussion of the budget.

Hence using identical sets of hypotheses about the public finances, a measurement of savings on spending, and thus of the structural adjustment, would depend on the potential growth adopted (Table). Assuming a value for the growth in public spending (excluding tax credits) of +1.3% in 2016 and in 2017, the scale of the effort on spending was evaluated at 0.7 GDP point in October 2015 (using the hypotheses in the 2016 PLF) but 0.6 point in December 2014 (2014-2019 LPFP).

tabpost0911ang

While the differences identified above may seem small, they can have significant consequences on the implementation of fiscal rules, which can lead the various players to act on their assumptions in order to change the effort shown [7]. Even though this notion should guide the vision of the future trajectory of Europe’s economies, the debate winds up being hijacked. Recurrent revisions in potential growth focus discussion on the more technical aspects, even though the method of estimating potential growth is uncertain by definition and there is not even a consensus among economists. Thus, the European Semester, which should set the framework for discussion and coordination between Member States in determining the economic policy that best suits the macroeconomic context, for France and for the euro zone as a whole, gets lost amidst technical discussions that are of no particular interest.


[1] Reimbursable tax credits – essentially the CICE and the CIR credits – are recognized in public expenditure on the basis of the 2010 national accounts. In order to remain closely in line with economic concepts, public spending will be analyzed excluding tax credits, which will be considered as a component of taxation.

[2] This definition is accepted both by the academic literature (see for example, D’Erasmo P., Mendoza E. and Zhang J., 2015, “What is a Sustainable Public Debt?”, NBER WP, no 21574, September 2015, and by international organizations (see IMF, 2012, “Assessing Sustainability”).

[3] It can also be compared to an underlying trend in public expenditure which itself takes into account the changing needs to which spending responds.

[4] The European Commission expects France to grow by 1.1% in 2015, 1.4% in 2016 and 1.7% in 2017.

[5] The evaluation has changed to the second decimal.

[6] For this debate, see H. Sterdyniak, 2015, “Faut-il encore utiliser le concept de croissance potentielle?” [Should the concept of potential growth still be used?], Revue de l’OFCE, no. 142, October 2015.

[7] The revisions of potential growth may have an impact on the implementation of procedures. These revisions cannot give rise to penalties. At the sanctions stage, the European Commission’s hypothesis on potential growth, made at the recommendation of the Council, is used in the discussion. However, it is likely that a difference of opinion on an unobservable variable could generate friction in the process, reducing the likelihood of sanctions and making the rules less credible.