2015-2017 forecasts for the French economy

By Mathieu PlaneBruno DucoudréPierre Madec, Hervé Péléraux and Raul Sampognaro

This text summarizes the OFCE’s economic forecast for the French economy for 2015-2017

After a hesitant upturn in the first half of 2015 (with growth rates of 0.7% and 0% respectively in the first and second quarter), the French economy grew slowly in the second half year, with GDP rising by an average of 1.1% for the year as a whole. With a GDP growth rate of 0.3% in the third quarter of 2015 and 0.4% in the fourth quarter, which was equal to the pace of potential growth, the unemployment rate stabilized at 10% at year end. Household consumption (+1.7% in 2015) was boosted by the recovery in purchasing power due in particular to lower oil prices, which will prop up growth in 2015, but the situation of investment by households (-3.6%) and the public administration (-2.6%) will continue to hold back activity. In a context of sluggish growth and moderate fiscal consolidation, the government deficit will continue to fall slowly, to 3.7% of GDP in 2015.

With GDP growth in 2016 of 1.8%, the year will be marked by a recovery, in particular by rising corporate investment rates. Indeed, all the factors for a renewal of investment are coming together: first, a spectacular turnaround in margin rates since mid-2014 due to a fall in the cost of energy supplies and the impact of the CICE tax credit and France’s Responsibility Pact; next, the historically low cost of capital, which has been helped by the ECB’s unconventional monetary policy; and finally, an improvement in the economic outlook. These factors will lead to an acceleration of business investment in 2016, which will increase by 4% on average over the year. Household consumption should remain strong in 2016 (+1.6%), driven by job creation in the market sector and by a slight fall in the savings rate. Fuelled by the rise in housing starts and building permits, housing investment will pick up (+3%), after shrinking for four years in a row. Foreign trade will be boosted by the impact of the euro’s depreciation and the government’s competitiveness policies, and will make a positive contribution to growth (+0.2 GDP point in 2016, the same as in 2015). Once the impact of the downturn in oil prices has fed through, inflation should be positive in 2016, but still low (1% on an annual average, after two years of virtual stagnation), a rate that is close to underlying inflation. The pace of quarterly GDP growth in 2016 will be between 0.5% and 0.6%: this will trigger a gradual closing of the output gap and a slow fall in the unemployment rate, which will end the year at 9.8%. The public deficit will be cut by 0.5 GDP point, due to savings in public spending, notably through the contraction of public investment (-2.6%), low growth in government spending (+0.9%), and the impact of the rise in tax revenues as the economy recovers.

Assuming that the macroeconomic environment remains favourable, the output gap is expected to continue to close in 2017. With GDP growth of 2%, the government deficit will fall further to 2.7% of GDP, passing below the 3% bar for the first time in 10 years. Under the impact of the government’s employment policies and the absorption of the overstaffing by companies, the unemployment rate will continue to fall, to 9.4% of the active population by the end of 2017.


French competitiveness: The object of a supply policy

By Sarah Guillou

The 2014-2015 edition of The Global Competitiveness Report [1] by the World Economic Forum sheds light on the political debate between those who like to prioritize a supply policy and those who instead make the conditions governing offer their top priority. Note that competitiveness is a key factor in future growth in mature economies that specialize in high-tech or high added-value products [2].

France ranks 23rd in terms of the global competitiveness indicator calculated by the World Economic Forum. This competitiveness indicator goes beyond conventional measures based on relative production costs to incorporate many sub-indicators (100 in total) that cover a variety of dimensions, including the functioning of product markets, labour markets, and institutions; indicators about human capital, infrastructure and innovation; and qualitative measurements from business surveys. The result is a set of dimensions that identifies a country’s level of productivity in detail. The competitiveness indicator proposed is “global” in terms of both the extent of the dimensions included and the number of countries covered.

Competitiveness is measured relative to 143 countries. The weighting of the sub-indicators is deduced from the membership of countries in a category based on their level of economic development: Phase 1, governed by the availability of factors; Phase 2, in transition from Phase 1 to Phase 3; Phase 3, governed by the efficiency of the factors; Phase 4, in transition from Phase 3 to Phase 5; and Phase 5, governed by innovation. Depending on the category, the weight assigned to each sub-indicator in determining the level of competitiveness differs. This explains why the ranking does not fully reflect the traditional hierarchy of countries based on their level of economic wealth. Moreover, the diversity of the indicators that come into play can result in countries with very different economic profiles being ranked more closely: hence Russia (53rd) is nipping at the heels of Italy (49th), and the UAE comes right after Norway (11th).

With respect to the debate on supply-and-demand dynamics, it is interesting to note that the global competitiveness indicator is based on a set of sub-indicators that are not all associated with structural reforms associated with supply, and many of them result from a balanced support for demand. For example, the provision of high-quality human capital (skilled, healthy, etc.) requires not only an environment that values labour and rewards merit but also a level of security and social welfare which contributes to a quality of life that attracts and retains human capital, and therefore a certain level of public spending. This is also the case for infrastructure. More generally, the competitiveness indicator is the result of achieving a balance between the level of public spending and structural reforms in such a way that the indicators wind up complementing each other.

Switzerland’s no. 1 ranking recognizes the quality of its business environment – infrastructure, human capital, institutions, trust, macroeconomic stability – which makes up for the weakness of its market size and its degree of openness and specialization in high-tech manufacturing industries [3]. Six European countries are in the top 10, which is reassuring for the European model [4]. The French economy has stabilized its position in the ranking with respect to the previous year, following four years of decline – it was ranked 16th in 2008.

Of the 144 countries ranked, France owes its position in the first quintile (the top 20%, i.e. the first 28 countries) to the quality of its infrastructure and educational system, its technological level and its entrepreneurial culture [5]. Competitiveness is primarily a relative concept, and in a global economy where more and more countries aspire to be in the top 10 economic powers, judgments about the French economy depend heavily on the group to which it aspires to belong. What raises questions is that France long belonged to the top 10, and its main companions historically are still there (Germany, the United Kingdom, Belgium, Netherlands and the United States). Relative to the first quintile, which includes 13 other European countries, the United States, Canada, Japan and China, France’s position at the tail end is far from glorious and requires us to take a look at the indicators that rank the French economy among the least competitive. The main reasons for this result are the functioning of the labour market, the State’s fiscal position, and the country’s relatively poor performance in providing an environment favourable to work and investment.

More specifically, an analysis of the specific sub-indicators (from the 100) for which France’s performance puts it in the bottom third of the 144 countries, i.e. a ranking between the 96th and 144th spots, and a comparison with its neighbours (see Figures 1-3), reveals the following points:

1) The dimensions that show the greatest contrast relative to Germany, the United Kingdom and the United States include the burden of administrative regulations, the impact of taxes on investment incentives, the impact of taxes on work incentives, cooperation in labour-management relations, hiring and firing practices and the rate of taxation as a percentage of profits.

2)   France’s lacklustre performance is often exceeded by that of Italy.

3)   The indicators on French fiscal policy are problematic, but this is not strongly different from the situation of its partners.

The functioning of the labour market, and more generally the regulatory environment influencing incentives to work and invest, thus emerge as the dimensions pushing down the global competitiveness indicator. Note that these indicators are derived from objective measures (such as number of regulations, level of taxation, macroeconomic data) but also in large part from responses to a survey of business leaders. These leaders have to indicate on a scale of 1 to 7 their assessment of the various factors underlying the indicators. In the main the indicators thus express a felt reality. For France, the low ranking in the dimensions identified in point 1) reveals the severity of the judgment of these business entrepreneurs.

The lessons for economic policy are as follows: the scope for progress and the specific reasons for France’s position lie in the dimensions outlined in point 1). The priorities for structural reform are cumbersome administrative regulations, incentives for work and investment, and the quality of labour-management relations. But what policies are needed to deal with these issues?

Administrative simplification and the Responsibility Pact are a step in the right direction, but it is questionable whether the measures taken will affect the way business perceives economic incentives in the administrative-legal environment. Moreover, nothing is being done in terms of improving labour-management relations. Finally, it would be desirable for government to adopt a neutral and stable position vis-à-vis companies, a position that neither maligns their economic rationality nor undermines their power over the industrial future. And even if the divorce between the State and business is in part “constitutional”, as Jean Peyrelevade [6] argues, we cannot give up efforts to improve social dialogue and to reconcile French companies with their economic and regulatory habitat. This is one of the keys to French competitiveness.

Finally, the three lessons of this Report are 1) to keep in mind that competitiveness reflects a combination of many elements that cannot simply be reduced to facilitating the exercise of economic activity (i.e. tax cuts, labour market flexibility), 2) the most competitive economies are not those where public authority has retreated, as many dimensions require a State that makes effective investments (in education and infrastructure) and guides capital (for example, into renewable energy); and 3) the margin for progress towards a more competitive France today lies not in public investment, but in incentives for social dialogue, employment, labour and investment.

The WEF classification thus provides clear evidence that supply conditions in France can be greatly improved and that to prioritize the competitiveness of the French economy reforms in this direction are imperative.

postENG_sg_0810


[1] The World Economic Forum began to calculate competitiveness in 1979, and since then has gradually extended its efforts to embrace more dimensions and countries.

[2] These productive activities are in effect associated with increasing returns to scale (due to high fixed entry costs, in particular R&D), which implies economic viability on a large scale: in other words, on a scale that goes beyond simply the domestic market.

[3] Likewise, political transparency is more highly valued than economic transparency.

[4] Switzerland, Finland, Germany, Netherlands, United Kingdom, Sweden.

[5] “the country’s business culture is highly professional and sophisticated” (page 23).

[6] J. Peyrelevade, Histoire d’une névrose, la France et son économie, Albin Michel, 2014.


Has the 35-hour work week really “weighed down” the French economy?

By Eric Heyer

Did the Aubry laws introducing the 35-hour work week in France between 1998 and 2002 really make French business less competitive and lead to job losses, as is suggested in the latest report from the OECD? Has France seen its economic performance decline post-reform relative to its European partners? Have the public finances been “weighed down” by these laws?

A review of our recent macroeconomic history, coupled with international comparisons, provides some answers to these questions.

Record macroeconomic performances in the private sector between 1998 and 2002…

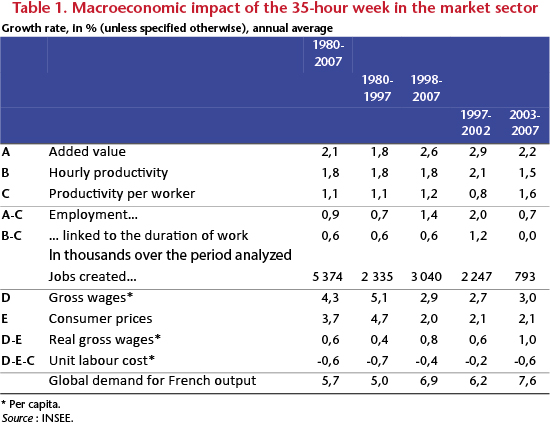
Leaving aside an analysis of the recent Great Recession, over the past 30 years private sector activity in France grew by an annual average of 2.1%. Since the establishment of the 35‑hour work week, far from collapsing, economic growth in this sector instead accelerated sharply, from 1.8% before 1997 to 2.6% afterwards, and even hit a peak during the period in which the 35-hour week was being established (an annual average of 2.9%, Table 1). Furthermore, it is noteworthy that of the five best years recorded by the French market sector over the past 30 years, three were in the period 1998-2002 based on the criterion of GDP growth, and four if the criterion used is job creation.

The global economic environment accounts for some of this good performance, but only in part: foreign demand for French output was certainly more dynamic after 1997 than before, but this acceleration continued after 2002, and cannot therefore explain the better performances recorded between 1998 and 2002 (Table 1).

tab1_blogang_0212


… and better than the performance of our European partners

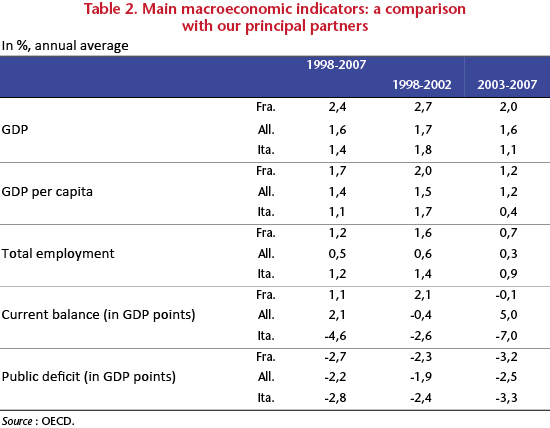
Since the establishment of the 35-hour work week, France’s performance has been superior to that of the rest of the euro zone, especially in comparison with our two main partners, Germany and Italy. For instance, over the decade 1998-2007 France’s average annual growth was 1 point higher than for Italy and 0.8 point than for Germany (Table 2).

During this period, French companies and households spent more than their German and Italian counterparts. Business investment, which rose at an annual average of 0.8%, was more dynamic in France than in Germany (0.3%) or Italy (0.5%). As for households, consumption grew by an annual average of 1.4% in France against, respectively, 0.4% in Germany and 0.9% in Italy. Furthermore, it should be noted that the continued higher consumption in France does not reflect the behaviour of household savings. The savings rate was not only higher than elsewhere in Europe, but it has also risen since 1998. The solid performance of French consumption is the consequence of greater dynamism in job creation in France during this period, especially when compared to what was taking place in Germany (Table 2).

tab2_20212postEHang


Unit labour costs [1] under control

Considering the large countries, France has cut hourly unit labour costs in the manufacturing sector the most during the period 1997-2002 (Figure 1). With respect to labour costs for the economy as a whole, only Germany has done better than France over this period.

graph1_blog_0212EHang

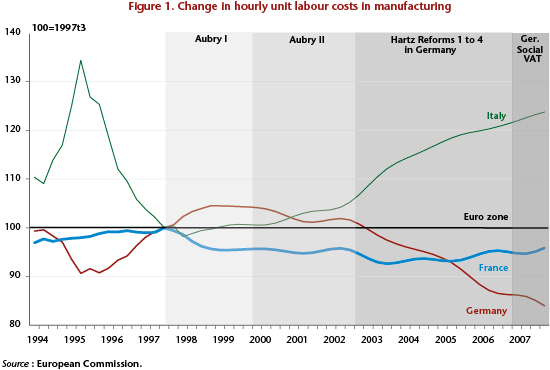
The implementation of the Aubry laws has not therefore led to reducing the competitiveness of the French economy. The reasons why are now well known: the way the increase in hourly wages linked to the 35-hour week was offset by wage moderation; the more flexible organization of working time, which helped to boost the hourly productivity of labour (Table 1); the suppression of overtime pay; and finally State aid in the form of lower social contributions.

Between 1997 and 2002 , by better controlling wage costs than most European and Anglo-American countries, France improved its price competitiveness and thereby its market share of world trade (Figure 2). The share of French exports in world trade, which was helped by the weakness of the euro and by wage moderation, reached a peak in 2001.

Since 2002, France’s market share has declined considerably, for two basic reasons: first, the loss of price competitiveness of French exports subsequent to the appreciation of the nominal effective exchange rate in France, comparable to that observed in the early 1990s, and second, Germany’s commitment to a policy of drastically reducing production costs. Since 2002, Germany has engaged in a process of improving its supply by restricting income and social transfers ( Hartz reforms , social VAT), which led to lower unit labour costs in absolute terms but also relative to its other European partners, including France. It is this policy that accounts for the 30% loss in market share experienced by France in the period 2002-2007.

graph2_blog_0212EHang

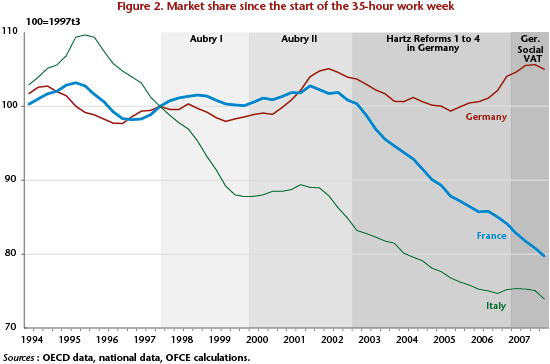
The loss in market share is thus not peculiar to France. The policy being implemented in Germany has enabled it to gain market share in countries that are geographically and structurally close to it, i.e. the large European countries. In this respect, France is not the only country to have suffered from this strategy, as Italy too has lost market share during this period[2].

In total, since the introduction of the 35-hour week, Italy has lost even more market share than the French economy (-27% for Italy against -20% for France).

A limited cost for the public purse

Since the implementation of the Aubry laws, the relief on charges on low wages has cost general government an annual average of nearly 22 billion euros. But this amount is not attributable solely to the Aubry laws, since even before that such measures had been established by the Balladur and Juppé governments in the early and mid 1990s. The additional relief generated by the Aubry laws, which was made more long term by the “Fillon” measures, comes to nearly 12.5 billion euros per year. But this amount does not represent the cost actually incurred by general government. Indeed, as the Aubry laws have created jobs (350,000 over the period 1997-2002 according to official figures ​​by the DARES and used by the INSEE), the cost for the public purse has been smaller: this job creation generates four billion euros in additional payroll taxes; this has reduced the number of unemployed, and thus unemployment benefits by 1.8 billion euros; and finally this has boosted household income, and the consequent consumption is generating additional tax revenues (VAT, income tax, etc.) in the amount of 3.7 billion euros. In sum, once the macroeconomic feedback is taken into account, the additional cost of these reductions comes to 3 billion euros annually, or 0.15 percentage point of GDP.

A review of our macroeconomic history does not therefore corroborate the thesis that the 35-hour week has “weighed down” the French economy: business growth and job creation were higher during the period from 1997 to 2007 than in the rest of the euro zone, and the competitiveness of the French economy, as measured by unit labour costs, fell by less than in the rest of the euro zone, with the exception of Germany. In this regard, it appears that the strategy conducted in Germany from 2002 (Hartz reform and social VAT) better explains the losses in market share by both the French economy and our other European partners. It is rather in the public sector, including hospitals, that the 35-hour work week has proven ineffective.

____________________________________________________________________________________________

 The different measures relaxing the 35-hour week

I –The Fillon law of 2003

The Law of 17 January 2003 has two main provisions:

          (1)    Regulation of overtime

By increasing the overtime quota from 130 to 180 hours, this law permits companies to use overtime structurally. Allowing for an additional 4 hours per week throughout the year enables companies to stay on a 39-hour week if they so wish. Specific industries also have the right to negotiate a higher amount. The Decree of 9 December 2004 brought the regulatory overtime quota to 220 hours per year.

The Law also reduces the cost of overtime. For companies with 20 employees or fewer, overtime begins only with the 37th hour, and the rate of extra pay is only 10%. For other firms, this may be negotiated between 10% and 25% by an industry agreement.

          (2) Measure easing social contributions

The provisions for the reduction of employer social contributions introduced by the Aubry laws were henceforth disconnected from the length of the work week. All companies, whether or not they had shifted to the 35-hour week, now benefited. Structural aid beyond 1.6 times the minimum wage (SMIC) was eliminated.

II – The tax exemption of overtime hours in 2007

This measure had several provisions:

           (1) Lump-sum reduction in payroll taxes

This measure introduced a lump-sum reduction in payroll taxes of 1.5 euros per hour of overtime worked by companies with fewer than 20 employees and 0.50 euros in enterprises with more than 20 employees.

          (2) Alignment of extra pay for overtime

This measure provided that extra pay for overtime be aligned at the minimum rate of 25% for all companies.

          (3) Exemption from income tax

This measure allowed employees to exempt their pay for overtime hours from income tax, up to a limit of 25% extra.

          (4) Exemption from social contributions

This measure also included a reduction of payroll taxes equal to the amount of the CSG / CRDS tax as well as all legal and contractual contributions.

______________________________________________________________________________

For more information:

Philippe Askenazy, Catherine Bloch-London and Muriel Roger, 2004, “La réduction du temps de travail 1997-2003: dynamique de construction des lois ‘Aubry’ et premières evaluations” [The reduction of the work week 1997-2003: dynamics of the development of the Aubry laws and initial evaluations], Economie et Statistiques, no. 376-377.

Chen R., GM. Milesi-Ferreti and T. Tressel, 2013, “Eurozone external imbalances”, Economic Policy, 28 (73), pp. 102-142.

DARES, 2003, Les politiques de l’emploi et du marché du travail, Collection Repères, Editions La Découverte.

Guillaume Duval, 2008, Sommes-nous des paresseux? et 30 autres questions sur la France et les Français, Editions du Seuil.

Alain Gubian, Stéphane Jugnot, Frédéric Lerais and Vladimir Passeron, 2004, “Les effets de la RTT sur l’emploi: des simulations ex-ante aux évaluations ex-post” [Impact of the shorter work week on employment: from ex-ante simulations to ex-post evaluations], Economie et Statistiques, n° 376-377.

Éric Heyer and Xavier Timbeau, 2000, “35 heures : réduction réduite” [35 hours: the reduction reduced], Revue de l’OFCE, no. 74, July.


[1] The unit labour cost is the ratio of the hourly cost of labour to the hourly productivity of the work.

[2] Other factors may of course explain Germany’s better performance, such as the emergence of China. For a recent version of this idea, see Chen R., G.M. Milesi-Ferreti and T. Tressel (2013).


France: less austerity, more growth

By Eric Heyer

This text summarizes the OFCE’s 2013-2014 forecast for the French economy.

In 2013, the French economy should experience annual average growth of 0.2%, which means that by the end of the year its level of production should return to the level of six years earlier, at the end of 2007. This mediocre performance is very far from the trajectory that an economy recovering from a crisis should be on.

The French economy did however have great potential for recovery: average spontaneous growth of about 2.6% per annum over the period 2010-2013 was possible and would have allowed France to make up the output gap accumulated in 2008-2009. But this “recovery” has been hampered mainly by the introduction of budget savings plans in France and across Europe. For the single year 2013, this fiscal strategy will cut economic activity in France by 2.4 GDP points.

The understanding that the fiscal multipliers were high came late, and occurred only after the austerity plans had already had a negative impact on growth. At the end of May 2013, this awareness pushed the European authorities to give additional time to six EU countries, including France, to correct their excessive deficits. The easing of the Commission’s requirements provided a breath of fresh air that enabled the government to relax the austerity measures set for 2014. According to the budget presented in autumn 2013, the domestic impact of the austerity measures will be reduced by 0.5 GDP points between 2013 and 2014; since our partners are also relaxing their policies, a boost to external demand is also anticipated. Overall, the easing of austerity will mean the addition of almost one point of growth in 2014 compared to 2013, despite the still high fiscal multipliers.

In these conditions, growth should come to 1.3% in 2014 on an annual average. By running at a rate still below its potential, the forecast growth will add to the output gap accumulated since 2008 and will continue to hurt the labour market. The unemployment rate in metropolitan France will rise slightly, reaching 10.9% by end 2014.

As a result of the easing of austerity, the public deficit will be higher than what was initially planned. It is expected to come to 3.5% of GDP in 2014, after reaching 4.1% in 2013, with gross government debt near 95% of GDP next year.


Holding to the required course

By Eric Heyer

This text summarizes the OFCE’s 2013-2014 forecasts for the French economy.

In 2013, the French economy should see negative annual average growth, with a fall in GDP of 0.2%, before a modest recovery in 2014, with growth of 0.6 % (Table 1). This particularly mediocre performance is far from the path that an economy pulling out of a crisis should be taking.

Four years after the start of the crisis, the French economy has a substantial potential for recovery: this should have led to average spontaneous growth of about 2.6% per year in 2013 and 2014, making up some of the output gap accumulated since the onset of the crisis. But this spontaneous recovery is being hampered mainly by the introduction of fiscal savings plans in France and across Europe. To meet its commitment to cut the public deficit to 3% by 2014, the French government will have to hold to the course of fiscal consolidation it adopted in 2010, which was imposed by the European Commission in all the euro zone countries. This budget strategy should slash 2.6 percentage points off GDP growth in France in 2013 and 2.0 percentage points off GDP in 2014 (Table 2).

By setting a pace far from its potential, the expected growth will aggravate the output gap built up since 2008, with the labour market thus continuing to worsen. The unemployment rate will rise steadily to 11.6% in late 2014.

Only a shift in European fiscal strategy could halt the rise in unemployment. This would mean limiting the negative fiscal stimulus to 0.5 percent of GDP instead of the total of 1.0 points planned in the euro zone in 2014. This reduced fiscal effort could be repeated until the public deficit or debt reaches a defined goal. Compared to current plans, because the effort would be measured the burden of adjustment would be spread more fairly over the taxpayers in each country, avoiding the pitfall of drastic cuts in the public budgets. This new strategy would lead to a slower reduction in the public deficit (-3.4% in 2014 against -3.0% in our central scenario), but also and especially to higher economic growth (1.6% against 0.6%). This “less austerity” scenario would allow the French economy to create 119,000 jobs in 2014, i.e. 232,000 more than in our central forecast, and unemployment would fall instead of continuing to increase.


The irresistible attraction to recession

By Hervé Péléraux

Here is the leading indicator for the French economy, updated to 30 January 2011.

The February forecasts of the leading indicator significantly worsened the outlook for the French economy at the turn of 2011 and 2012.

On the one hand, GDP is expected to have fallen more than expected in the fourth quarter of 2011, by -0.3% instead of the -0.2% estimated last month. On the other hand, the pick-up in growth in the first quarter of 2012 observed in January is fast disappearing, with GDP rising by 0.1% and not 0.3% as in the previous estimates. In total, GDP will contract by 0.2% over the two quarters. The uncertainty hanging over a forecast of GDP over two quarters, which we have pointed out earlier, is gradually being lifted in an unfavourable sense as the negative information builds up. In particular, the climate in industry continued to worsen in January at a higher rate than expected last month.

The deteriorating business environment is taking precedence over the more positive elements that up to now blunted the impact of the sovereign debt crisis on growth, namely, the decline in the euro against the dollar in the third quarter of 2011 and the interruption of the dive by the CAC40 stock market index in the fourth quarter. If this same dynamic repeats in February and March, France would be unlikely to escape a recession in the usually accepted meaning of the term, i.e. the occurrence of two consecutive quarters of falling GDP.

Next update on 29 February 2012