Inflationary pressures are mounting

By Hervé Péléraux

The publication of the price index by the INSEE on November 15 confirmed the return of inflation to positive territory, +0.4%, in October and September, after it oscillated around 0 since the end of 2014. The deflationary phase experienced over the past two years has in part replicated the trajectory of the energy price index, which saw the price of oil fall in early 2016 to one-third of its price in mid-2014. With a weighting of almost 8% in the all-items index, the energy price index, which incorporates the price of fuel but also of oil-indexed products such as gas and electricity, automatically pushed down inflation. This phase of energy-related disinflation now seems to have come to an end, with crude oil prices rising to between USD 45 and 50 a barrel since the low in mid-January 2016 at under USD 30. The gradual rise in the year-on-year change in the energy price index since spring has in fact pulled along the overall index.

graph-1

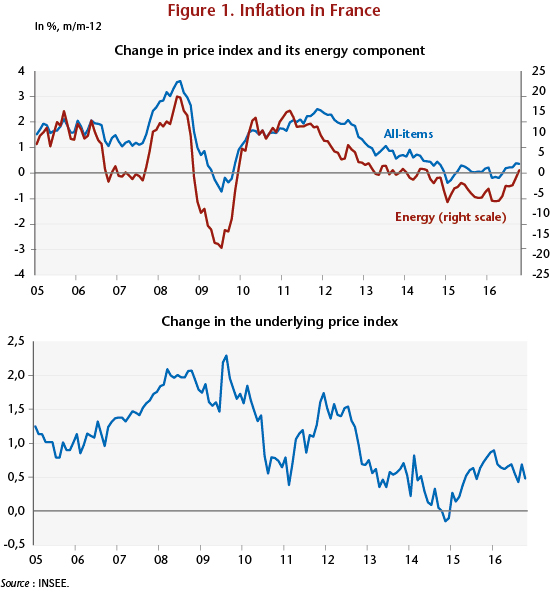
However, the euro’s depreciation against the dollar, which paralleled the fall in oil prices (from 1.35 dollars per euro on average in the first half of 2014 to 1.10 on average since spring 2015), has had a contrary inflationary effect, first by moderating the fall in the prices of energy imports after their conversion from dollars to euros, and second by increasing the price of non-energy imports. Changes in the underlying price index, which excludes products with volatile prices (energy, some fresh food products) and products with administered prices (health care, tobacco, public prices) from the overall index, reflected this second effect by rebounding from early 2015. This increase in underlying inflation was not, however, due solely to the depreciation of the euro. The gradual end of the period of stagnation that marked the French economy between Q2 2011 and Q2 2014 reactivated inflationary mechanisms that had previously been thwarted by the easing of tension and the rise in unemployment.

The inflationary upturn begun in the last few months is expected to continue until 2018. The exhaustion of the disinflationary impact of the oil counter-shock and the rise in the price of crude oil, which has already largely occurred but will continue through the forecasting horizon up to 52 euros per barrel from its low point in early 2016 (31 euros per barrel) should mark the end of the disinflationary phase linked to energy prices. On top of this, the depreciation of the European currency, also already accomplished in large part, will continue, with a fall from 1.10 euros per dollar in mid-October 2016 to 1.05 according to our forecast. This will contribute to higher import prices. Inflation should therefore have hit a low point in the second quarter of 2016 before becoming positive again in the second half of 2016. By 2017, price increases will be close to 2% year-on-year, partly due to the effect of the recovery in oil prices and the depreciation of the euro. Excluding these two effects, inflation would just exceed 1% by end 2017 and then reach 1.5% the following year.

==================================================================

The price-wage loop

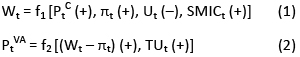
Inflation forecasts are based on the modelling of a price-wage loop that estimates the parameters of the relationship between employees and companies: employers pass wage increases on to prices to preserve their margins, while employees respond to price increases by trying to obtain higher wages to preserve their purchasing power. Two equations model this process.

The wage formation equation (1) has terms for indexing wages to prices (PC), labour productivity (π), a part of which is redistributed in the form of wages, the unemployment rate (U), which governs workers’ bargaining power, and the minimum wage (SMIC), which can have impacts on the scale of adjacent wages.

Equation (2) gives the prices of value added (PVA), a function of unit wage costs, which can be broken down into the difference between wages (W) and labour productivity. The elasticity between the value-added prices and the unit wage cost (W – π) is set to 1, which means that, in the long run, fluctuations in unit labour costs do not affect companies’ target margin rate. Since there is inflationary pressure on the productive apparatus, the rate of utilization of production capacity (TU) is added to the unit labour costs.

formule-1

The formation of prices in the domestic market also depends on the prices of imported goods excluding taxes (MP), which are a function of the price of oil expressed in euros (PPétrole) and the nominal effective exchange rate (TCEN).

formule-2

Finally, an accounting equation for the formation of domestic prices combines the value-added prices and the pre-tax import prices, with the total being increased by the rate of VAT to simulate the after-tax price index on the domestic market (here the deflator of household consumption from the national accounts). The different equations are estimated using error correction models.

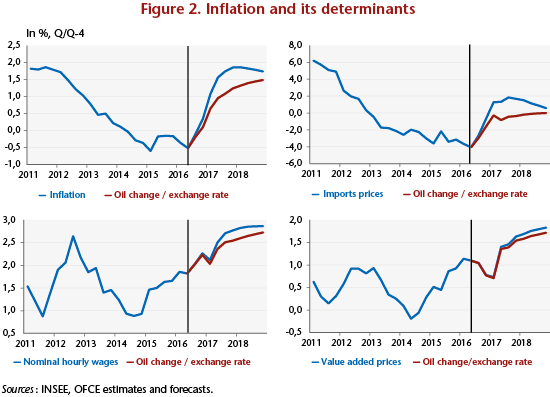
In accordance with this model, the trajectory of inflation by 2018 will be affected both by external impulses, namely changes in the effective exchange rate and in oil prices, and by internal impulses, namely the response of wages to these external shocks through indexation and the fall in unemployment. The renewed rise in oil prices and the depreciation of the effective exchange rate will revive imported inflation. Import prices will thus once again begin to rise in the first quarter of 2017, and will therefore contribute accounting-wise to the rebound in inflation. The indexing mechanisms will then push up wages, due to the added inflation. The fall in the unemployment rate begun at the end of 2015 will add to this impulse. Nevertheless, the rebound in inflation in the second half of 2016 cannot be reduced solely to the impact of external shocks. By neutralizing these effects and holding the nominal effective exchange rate and oil prices constant at their mid-2016 values, the rebound in inflation would not disappear, but it would be 0.6 percentage point lower at end 2017 (and 0.2 point lower at end 2018) relative to what comes from the central accounts (Figure 2).

graph-2


The French economy on the road to recovery

by Hervé Péléraux

The publication of the INSEE’s business surveys on October 22 confirms the French economy’s positive situation in the second half of 2015, suggesting that the negative performance in the second quarter of 2015 (0%) will turn out to have been merely “an air pocket” after the strong growth seen in the first quarter (+0.7%). The business climate in industry has exceeded its long-term average for the seventh month in a row, and the service sector has been recovering rapidly since May 2015 and has climbed back to its average, the highest level in four years (Figure 1). The business climate in the construction sector nevertheless is still suffering from the crisis that hit it, but its downward trend halted at the end of 2014; despite monthly hiccups, the sector has begun a slow recovery that could signal the end of its woes in the coming quarters.

G1_post23-10ang

The confidence indicators, which provide qualitative information summarizing the balance of opinion on the various questions posed about business activity, consumer confidence and the situation in commerce, can be converted into quantitative information by means of an econometric equation linking these to the quarterly GDP growth rate[1]. Doing this makes it possible to use these purely qualitative data to estimate the GDP growth rate in the past and near future (two quarters), given that the publication of the surveys precede that for GDP. Among the sectoral indicators available, only the business climate in industry, services and construction provide econometrically useful information to trace the trajectory of the GDP growth rate. The other series are not significant, in particular the indexes for consumer confidence and for confidence in the retail and wholesale trade.

The leading index, which has a significantly more smoothed profile than GDP growth rates, cannot fully capture the volatility of activity and therefore should not strictly speaking be considered a predictor of growth (Figure 2). On the other hand, from a more qualitative viewpoint, it manages to delineate quite correctly the phases during which growth is above or below average (or the long-term) determined by the estimate. From this perspective, the indicator can be seen as marking a turning point in the economic cycle. Since the second quarter 2011, the indicator has not depicted any crossing of the long-term growth rate, despite the false signs of recovery raised by the quarterly GDP figures for Q2 2013 and Q1 2015.

Based on the survey data available up to October, the growth foreseen by the indicator is 0.4% in the third and fourth quarter of 2015, exactly equal to long-term growth[2]. While a signal of recovery is not yet clearly given by the indicator, it should be noted that the information on the fourth quarter, which is limited to the October surveys, is quite partial. The confidence climates, which are extrapolated to the end of the year, are based on conservative assumptions and are likely to be upgraded if the surveys continue to improve from now to December.

G2_post23-10ang

The quantitative information available at this time for the third quarter of 2015 also gives cause for optimism, after the disappointment of the second quarter. Under the impact of the disinflation brought on by lower energy prices, which enabled a sharp rebound in purchasing power, household consumption of goods recovered sharply at the beginning of the year (Figure 3). The rise was interrupted in the second quarter, due to poor sales in March, which pulled down the figures, but consumption has resumed its upward trajectory continually since then. The carry-over in August for the third quarter was clearly positive (+0.6%), which suggests that the consumption of goods will again contribute positively to GDP growth for the quarter.

G3_post23-10ang

The projection of a return to growth in the third quarter is also confirmed by trends in the industrial production index (IPI), which rose sharply in August (+1.6% for the total IPI, and +2.2% for the manufacturing index itself). This rebound followed a drop in production after the peak in February-March 2015[3], which contributed to the poor performance of GDP in the second quarter (Figure 3), and nourished the idea that the second quarter was not an “air pocket” but the continuation of a long phase of stagnation for a France that was unable to take advantage of the favourable winds blowing from outside[4]. The carry-over in industrial production in August now stands at 0.3%, while it was ‑0.7% in the old series available in July.

The recent trends in the monthly indicators augur a renewal of growth in the third quarter of 2015. The extrapolation of GDP growth using the leading indicator, supplemented by the already available quantitative data, also points to a 0.4% increase in activity in the third quarter, which, if it is realized, would then put the economy on a firm track to finally initiate a recovery.


[1] For greater detail, see: « France : retour sur désinvestissement, Perspectives 2015-2017 pour l’économie française » [The 2015-2017 forecast for the French economy], pp. 34-37.

[2] The long-term growth considered here is not the potential growth estimated by its structural determinants using a production function, but the average GDP growth rate as reflected in the estimate of the indicator.

[3] It should be noted that the statistical revisions can change the perception of the economy’s dynamics in the very short term. The IPI series published on 9 October 2015 by the INSEE has revised the level of the index significantly upwards compared to the previous publication. The IPI is still on a downward trend between February and July 2015, but the trajectory described is less negative, and the quarterly average of the index in the second quarter of 2015 is affected: according to the old series, it stood at -0.7%, compared with -0.4% according to the revised series.

[4] See Heyer E. and R. Sampognaro, 2015, « L’impact des chocs économiques sur la croissance des pays développés depuis 2011 », [The impact of economic shocks on the growth of the developed countries since 2011], Revue de l’OFCE, no. 138, June 2015.


2015-2017 forecasts for the French economy

By Mathieu PlaneBruno DucoudréPierre Madec, Hervé Péléraux and Raul Sampognaro

This text summarizes the OFCE’s economic forecast for the French economy for 2015-2017

After a hesitant upturn in the first half of 2015 (with growth rates of 0.7% and 0% respectively in the first and second quarter), the French economy grew slowly in the second half year, with GDP rising by an average of 1.1% for the year as a whole. With a GDP growth rate of 0.3% in the third quarter of 2015 and 0.4% in the fourth quarter, which was equal to the pace of potential growth, the unemployment rate stabilized at 10% at year end. Household consumption (+1.7% in 2015) was boosted by the recovery in purchasing power due in particular to lower oil prices, which will prop up growth in 2015, but the situation of investment by households (-3.6%) and the public administration (-2.6%) will continue to hold back activity. In a context of sluggish growth and moderate fiscal consolidation, the government deficit will continue to fall slowly, to 3.7% of GDP in 2015.

With GDP growth in 2016 of 1.8%, the year will be marked by a recovery, in particular by rising corporate investment rates. Indeed, all the factors for a renewal of investment are coming together: first, a spectacular turnaround in margin rates since mid-2014 due to a fall in the cost of energy supplies and the impact of the CICE tax credit and France’s Responsibility Pact; next, the historically low cost of capital, which has been helped by the ECB’s unconventional monetary policy; and finally, an improvement in the economic outlook. These factors will lead to an acceleration of business investment in 2016, which will increase by 4% on average over the year. Household consumption should remain strong in 2016 (+1.6%), driven by job creation in the market sector and by a slight fall in the savings rate. Fuelled by the rise in housing starts and building permits, housing investment will pick up (+3%), after shrinking for four years in a row. Foreign trade will be boosted by the impact of the euro’s depreciation and the government’s competitiveness policies, and will make a positive contribution to growth (+0.2 GDP point in 2016, the same as in 2015). Once the impact of the downturn in oil prices has fed through, inflation should be positive in 2016, but still low (1% on an annual average, after two years of virtual stagnation), a rate that is close to underlying inflation. The pace of quarterly GDP growth in 2016 will be between 0.5% and 0.6%: this will trigger a gradual closing of the output gap and a slow fall in the unemployment rate, which will end the year at 9.8%. The public deficit will be cut by 0.5 GDP point, due to savings in public spending, notably through the contraction of public investment (-2.6%), low growth in government spending (+0.9%), and the impact of the rise in tax revenues as the economy recovers.

Assuming that the macroeconomic environment remains favourable, the output gap is expected to continue to close in 2017. With GDP growth of 2%, the government deficit will fall further to 2.7% of GDP, passing below the 3% bar for the first time in 10 years. Under the impact of the government’s employment policies and the absorption of the overstaffing by companies, the unemployment rate will continue to fall, to 9.4% of the active population by the end of 2017.


Oil: carbon for growth

By Céline AntoninBruno Ducoudré, Hervé Péléraux, Christine Rifflart, Aurélien Saussay

This text is based on the special study of the same name [Pétrole : du carbone pour la croissance, in French] that accompanies the OFCE’s 2015-2016 Forecast for the euro zone and the rest of the world.

The 50% fall in the price of Brent between summer 2014 and January 2015 and its continuing low level over the following months is good news for oil-importing economies. In a context of weak growth, this has resulted in a transfer of wealth to the benefit of the net importing countries through the trade balance, which is stimulating growth and fuelling a recovery. Lower oil prices are boosting household purchasing power and driving a rise in consumption and investment in a context where companies’ production costs are down. This has stimulated exports, with the additional demand from other oil-importing economies more than offsetting the slowdown seen in the exporting economies.

That said, the fall in oil prices is not neutral for the environment. Indeed, the fall in oil prices is making low-carbon transportation and production systems less attractive and could well hold back the much-needed energy transition and the reduction of greenhouse gas emissions (GHG).

This oil counter-shock will have a favourable impact on growth in the net oil-importing countries only if it is sustained. By 2016, the excess supply in the oil market, which has fuelled by the past development of shale oil production in the United States and OPEC’s laissez-faire policy, will taper off. Unconventional oil production in the United States, whose profitability is uncertain at prices of under 60 dollars per barrel, will have to adjust to lower prices, but the tapering off expected from the second half of 2015 will not be sufficient to bring prices down to their pre-shock level. Brent crude prices could stay at about 55 dollars a barrel before beginning towards end 2015 to rise to 65 dollars a year later. Prices should therefore remain below the levels of 2013 and early 2014, and despite the expected upward trend the short-term impact on growth will remain positive.

To measure the impact of this shock on the French economy, we have used two macroeconometric models, e-mod.fr and ThreeMe, to carry out a series of simulations. These models also allow us to assess the macroeconomic impact, the transfers in activity from one sector to another, and the environmental impact of the increased consumption of hydrocarbons. The results are presented in detail in the special study. It turns out that for the French economy a 20 dollar fall in oil prices leads to additional growth of 0.2 GDP point in the first year and 0.1 point in the second, but this is accompanied by a significant environmental cost. After five years, the price fall would lead to additional GHG emissions of 2.94 MtCO2, or nearly 1% of France’s total emissions in 2013. This volume for France represents nearly 4% of Europe’s goal of reducing emissions by 20% from 1990 levels.

The simulations using the French e-mod.fr model can be extended to the major developed economies (Germany, Italy, Spain, the USA and UK) by adapting it to suit characteristics for the consumption, import and production of oil. With the exception of the United States, the oil counter-shock has a substantial positive impact that is relatively similar for all the countries, with Spain benefitting just a little more because of its higher oil intensity. Ultimately, considering the past and projected changes in oil prices (at constant exchange rates), the additional growth expected on average in the major euro zone countries would be 0.6 GDP point in 2015 and 0.1 point in 2016. In the US, the positive impact would be partially offset by the crisis that is hitting the unconventional oil production business[1]. The impact on GDP would be positive in 2015 (+0.3 point) and negative in 2016 (-0.2 point). While lower oil prices are having a positive impact on global economic growth, this is unfortunately not the case for the environment …


[1] See the post, The US economy at a standstill in Q1 2015 : the impact of shale oil, by Aurélien Saussay, from 29 April on the OFCE site.


France: Recovery … at last!

By Mathieu PlaneBruno DucoudréPierre Madec, Hervé Péléraux and Raul Sampognaro

The OFCE’s forecast for the French economy in 2015-2016 is now available.

Not since the beginning of the subprime crisis has the French economy been in such a favourable situation for a recovery. The fall in oil prices, the ECB’s proactive and innovative policy, the easing of fiscal consolidation in France and the euro zone, the gathering impact of the CICE tax and the implementation of the Responsibility Pact (representing a tax transfer to business of 23 billion euros in 2015 and nearly 33 billion in 2016) all point in the same direction. The main obstacles that have held back French activity over the last four years (over-calibrated fiscal austerity, a strong euro, tight financial conditions, and high oil prices) should all be out of the way in 2015 and 2016, with pent-up growth finally released. The supply policy being pushed by the government, whose impact on business is still pending, will be all the more effective thanks to the positive demand shock from foreign trade, which will allow the economic rebalancing that was lacking up to now.

French GDP will grow by 1.4% in 2015, with the pace accelerating in the course of the year (to 2% yoy). The second half of 2015 will mark the turning point in the recovery, with the corporate investment rate picking up and the unemployment rate beginning to fall, ending the year at 9.8% (after 10% in late 2014). 2016 will then be the year of recovery, with GDP growth of 2.1%, a 4% increase in productive investment and the creation of nearly 200,000 private sector jobs, pushing the unemployment rate down to 9 5% by end 2016. In this positive context, the public deficit will fall significantly, and is expected to be 3.1% of GDP in 2016 (after 3.7% in 2015).

Obviously this virtuous cycle will only take effect if the macroeconomic environment remains favourable (low oil prices, a competitive euro, no new financial tensions in the euro zone, etc.) and if the government limits itself to the budget savings already announced.


France: duty-free growth

By Bruno Ducoudré , Éric Heyer, Hervé Péléraux, Mathieu Plane

This post summarizes the 2014-2015 outlook for the French economy

In early 2011, France was one of the few developed countries to have regained its pre-crisis level of GDP. Economic growth exceeded 2%, even reaching 3% yoy in the first quarter of 2011. Since then the situation has changed: the recovery was interrupted, and while the economy is experiencing positive growth, the rate is close to zero (Figure 1). Four types of shock explain why the post-recession recovery in 2011 died out. Growth was already being battered by austerity and by deteriorating credit conditions, and was then also hit by fluctuations in oil prices and by the impact of price competitiveness in 2012 as a result first of wage deflation in France’s competitors and then in 2013 of the rise of the euro (Table 1).

GRAPH1ENG


In 2014, the improvement expected on the economic front did not occur: the stimulus due to the gradual easing of austerity is being offset by the powerful brake exerted by the significant appreciation of the euro that has taken place since mid-year as well as by the collapse in consumer investment in housing. As in the previous two years, growth is expected to come to 0.4%, which is not enough to reverse the rise in unemployment or to reduce the public deficit significantly. Worse, while the public deficit has been cut by over 3 GDP points since 2009, it is now expected to rise slightly once again, reaching 4.5% of GDP (Tables 1 and 2).

TAB1ENGcorrigé


In 2015, growth will pick up some, to +1.1%, due to the weakening of the negative factors that have stifled it since 2010, in particular credit conditions and austerity. Furthermore, the effect of price competitiveness, a factor that has played a very negative role in 2014, will be reversed, due first to the depreciation of the euro, and second to the rising impact of the CICE tax credit, whose primary goal is to ensure lower export prices. But with GDP growth of 1.1% next year, the path towards expansion is still a long way from what can usually be seen during a post-crisis recovery (i.e. 2.4%). As the output gap is not closing, the anticipated growth cannot be deemed a recovery. Companies will benefit from this renewed pick-up to gradually restore their financial situation. This strategy is based primarily on increasing productivity, which will help to reduce surplus capacity and restore profit margins. The unemployment rate in metropolitan France will rise slightly to 9.9% in late 2015, and to 10.3% for France as a whole. The counterpart to loosening the austerity reins is a public deficit that is higher than what was originally programmed. It is expected to be 4.3% of GDP in 2015, departing significantly from its path back towards 3%.

TAB2ENG_corrige


In order to meet its commitments on structural efforts and nominal deficits, the government could decide to vote to make an additional effort of 8 billion euros. This would correspond to a 1.2 point hike in the standard rate of VAT. If that happens, GDP would grow no more than 0.8% next year, and the deficit would be reduced by only 0.2 GDP point, compared to our baseline scenario (Table 3).

TAB3ENG


Growth in the 4th quarter of 2013, but …

By Hervé Péléraux

According to the OFCE’s leading indicator, the French economy has grown by 0.5% in the fourth quarter of 2013. This result, which was anticipated, reflects the improvement in business surveys seen for about a year now. However, does this mark the return of GDP to a path of higher long-term growth? It is still too early to say.

The improvement in the business surveys anticipated the interruption in the second recession that took place in the first half of 2011. The national accounts then validated the signal emitted by the surveys, with renewed growth of 0.6% in the second quarter of 2013 (Table). GDP did of course fall again in the third quarter (-0.1%), but on average over the last two quarters there was growth of approximately 0.2% per quarter, a rate that, though very moderate, was still positive.

At the same time, the leading indicator, which aims to arrive at an estimate of GDP growth in the very short term by translating the cyclical information contained in the surveys, also pointed to a slow recovery in activity: on average over the last two quarters, growth was estimated at 0.1%, a figure that is slightly under the assessment of the national accounts.

TABHP_post_120214English

In the last few months, the uncontested growth in the confidence of private agents has enhanced the outlook for the end of 2013: the debate is now focusing on the possibility for the French economy to break through a turning point upwards and for growth to settle in at a level higher than the pace of long-term growth (0.35% per quarter).

Based on past experience, when the indicator has sent out warning signs of a turning point in the economic cycle, the signal issued for the fourth quarter of 2013 is indicating that the long-term growth rate of the French economy is being crossed (Figure). This signal is fragile: the still very partial information on the first quarter of 2014, i.e. the business surveys for January, point towards the growth rate falling below its potential. The possibility of a real lasting recovery that is able to create jobs and reverse the trend in unemployment is thus still very uncertain.

IMG_HP_Post_120414English

____________________________________________________________________________________

Note on the leading indicator:

The leading indicator aims to forecast the quarterly growth rate for French GDP two quarters beyond the latest available data. The components of the indicator are selected from survey data sets that are rapidly available and unrevised. The selection of the data series is made on an econometric basis, starting from the business surveys carried out in different productive sectors (industry, construction, services, retail) and among consumers. Two series related to the international environment are also significant: the rate of growth of the real exchange rate of the euro against the dollar, and the real growth rate of oil prices.

Some components are at least two quarters in advance and as such can be used to predict GDP growth. Others are coincidental, or are not sufficiently advanced to make a forecast two quarters ahead. These series need to be forecast, but over a short-term horizon that never exceeds four months.

The leading indicator is calculated at the beginning of each month, shortly after the publication of the business and consumer surveys.


Revisions of the growth potential: the impact on deficits

By Hervé Péléraux

Public finances – battered by the Great Recession

At the end of the Great Recession of 2008/09, the fiscal problem that governments had to face was seemingly simple, as was the solution put forward. The operation of the automatic stabilizers and the stimulus packages put in place to counter the 2008/09 recession sharply increased the public deficits. This situation, which was dictated by urgency, was acceptable in the short term, but not in the longer term. Logically this would lead to an adjustment in the public accounts to reduce the deficits and halt the growth of the debt. Fiscal discipline at a forced pace under the baton of the European Commission was therefore the economic policy instrument adopted by almost all the euro zone countries.

The appropriateness of this strategy, which was undertaken to solve the initial problem, i.e. the excessive deficits in the euro zone, should nevertheless be discussed. It relied on a macroeconomic diagnosis made at the end of the recession in 2008/09 that conditioned the assessment on the spontaneous capacity for an economic recovery – in effect, the fraction of the public deficit that was likely to be spontaneously absorbed by renewed growth depended on this capacity for recovery.

Part of the deficits could be absorbed on their own

The public deficit excluding interest expense, i.e. the primary deficit, can be subdivided into two components: a cyclical component and a structural component. The cyclical component results from cyclical fluctuations in GDP around its potential, that is to say, the level of GDP achievable without inflationary pressures using the available production factors: during a phase when GDP is slowing relative to its growth potential, and thus when the output gap is widening, tax revenues slow, and public spending, in particular on social welfare, picks up. What follows is a spontaneous increase in the deficit. In economic theory this self-corrective mechanism is called the “automatic stabilizers”. The other component of the deficit is deduced from the previous one as a complement to the total deficit: this is the deliberate component, which results from the impact of economic policy. This discretionary component can be eliminated only by implementing a policy that is symmetrical to what gave rise to it, that is to say, by means of an austerity policy. By its nature it has a dampening effect on the recovery, whereas the expansionary policy during the previous phase results in boosting activity. Fiscal policy is thus an instrument for smoothing the economic cycle.

The spontaneous portion of the deficit that appeared after the 2008/09 recession was destined to be automatically reduced once growth returned. Only the elimination of the discretionary component justified a restrictive policy. The extent of the effort needed to achieve this therefore depended on the measurement of the output gap, which conditioned the estimate of the cyclical deficit, and by inference the estimate of the deliberate deficit.

The cycle’s effect on the evaluation of the potential

The measurement of the output potential that is used to calculate the output gap is obviously central for calibrating as accurately as possible the budget cuts needed to eliminate the portion of the deficit that cannot be absorbed spontaneously by growth. But policymakers face a major difficulty here, i.e. the unobservable nature of the potential, which consequently must be estimated – and economists are far from unanimous about these estimates. Moreover, periodic revisions can be significant even within the same institution, which modifies the diagnosis made and – if this institution happens to be responsible for defining the rules constraining fiscal policy, as in the case of the European Commission (EC) –  the measures to be taken as well.

A review of the revisions of the growth potential calculated by the EC shows the uncertainty of this estimate (see last section below). The estimate also appears to depend on current growth, which is somewhat paradoxical for an estimate of a supply function that depends on long-term economic parameters such as increases in the labour force, productivity and the capital stock. It is understandable that the trajectory of these supply parameters is deflected slightly during cyclical hiccups, particularly through investment, which is a vehicle for technical progress and ensures the growth of capital or a loss in human capital due to long-term unemployment. But the fact that the inclusion in the estimates of a cyclical phenomenon, even one as massive as the recession of 2008/09, is leading to revisions of the growth potential on the order of that seen between Spring 2008 and Spring 2009 raises questions. This is particularly so as these revisions have also affected the years prior to the recession, which were not affected by changes in the conditions of accumulation. Thereafter, the resumption of growth in 2010 led to revisions of the growth potential in the other direction, including for the years prior to the recession. Finally, the economic downturn in 2011 led to a further series of revisions, once again downwards.

Self-sustained austerity

The reduction in growth potential led to significant revisions downwards of the estimated output gap (see chart). These are not neutral for calibrating the fiscal consolidation policy. This is because for a given deficit, the estimate of the output gap of -2% for 2010, for example, versus nearly -6% under the assumption of a continuation of the trajectory of potential GDP estimated before the recession, would increase the part of the perceived structural deficit and thus call for heightened austerity. That’s what happened in 2010, when the stimulus packages gave way to plans for drastic budget cuts. Generalized to all member countries, they nipped the nascent recovery in the bud and plunged the euro zone countries into a new recession.

IMG_eng_HP100214


The excessive sensitivity of the estimate of potential growth to current growth precipitated the commitment to austerity policies in the euro zone and subsequently pushed towards tightening fiscal restraint further. By depressing economic activity, austerity fuelled factors that undercut supply through the destruction of capital, a slowdown in investment and deskilling the labour supply. The economies’ capacity for a spontaneous recovery was thus undermined, which could only lead to an increase in the share of the structural deficit in the total deficit, and ultimately to the need for greater austerity.

The budget purge thus led to a second recession, which invalidated the deficit reduction targets set at the beginning, as the automatic stabilizers have again increased the cyclical component of the deficit. Rigour, poorly calibrated, was counter-productive and thus could not achieve the initial goal of rapid deficit reduction. The results are far from being commensurate with the sacrifices made by the European economies.

____________________________________________________________________________________

The European Commission’s estimate of the euro zone’s potential GDP

The 2008/09 recession led the European Commission to revise its estimate of the growth potential for the member countries rather significantly. For the euro zone as a whole, the revision process began between Spring 2008 and Spring 2009, when the effects of the financial crisis were expressed in real activity: the start of the recession in the euro zone in the fourth quarter of 2008 was associated with sharp downward revisions of the growth potential for 2008 and 2009, by -0.7 and -1.2 points, respectively (Table). There were also relatively substantial revisions to earlier years, from -0.3 to -0.5 points for the years 2004 to 2007. However, no major revision occurs between the estimates of Spring 2009 and Spring 2010, despite the downturn in year-on-year GDP growth, indicating that the modification of the economic landscape had already been included in the estimates.

The growth potential has been revised not only downwards, but also upwards when growth picked up after the recession. Between Spring 2010 and Spring 2011, the revisions were spread from +0.1 to +0.3 points and also affected more distant years. Finally, a new series of downward revisions took place with the second economic downturn in 2011. The years prior to 2008 changed little, but they fall within a broader range for the years 2008 to 2013, from -0.2 to -0.8 points, which for 2012 amounts to dividing the potential growth rate by two and a half.

TABenc_eng_HP_100214

The effect of current growth on the estimation of growth potential by the European Commission is thus obvious. This results in a high variability of the growth potential and therefore significant revisions of the output gap, which affects economic policy decisions since the structural balance depends on this evaluation.


What factors have put the brakes on growth since 2010?

By Eric Heyer and Hervé Péléraux

At the end of 2012, five years after the start of the crisis, France’s GDP has still not returned to its earlier level (Figure 1). At the same time, the labour force in France has grown steadily and technical progress has constantly raised workers’ productivity. We are therefore more numerous and more productive than 5 years ago when output was lower: the explosion in unemployment is a symptom of this mismatch. Why had the shoots of recovery seen in 2009 been choked off by mid-2010?

The main factor stifling the recovery has been the austerity measures that were enacted in France and Europe in 2010 and then intensified in 2011 and 2012 (Table 1). The impact of austerity has been all the more marked as it has been generalized throughout the euro zone. The effects of domestic cutbacks have combined with the effects of undercutting demand from other European partners. Given that 60% of France’s exports are to the European Union, any external stimulus had virtually vanished by mid-2012, less due to the slowdown in global growth, which is still almost 3%, than to the consequence of the poor performance of the euro zone, which is on the brink of recession.

It is austerity that is at the root of the lack of growth: after shaving -0.7 GDP point off growth in 2010, its effects increased in 2011 and 2012 (respectively -1.5 and -2.1 points) because of the stepped-up measures and the existence of high fiscal multipliers. Indeed, in a period of low economic activity simultaneously tightening fiscal policy in all the European countries while there is very little manoeuvring room for monetary policy (real interest rates close to zero) has led to raising the value of the multiplier. There is now a broad consensus that the short-term fiscal multipliers are high, especially as full employment is still out of reach (see Heyer (2012) for a review of the literature on multipliers). The theoretical debate about the value of the multiplier and the role of agents’ expectations must give way to empirical observation: the multipliers are positive and greater than 1.

In addition to the fiscal drag, there is the effect of tight monetary conditions: the easing of monetary policy – seen in particular in the lower key interest rates – is far from enough to offset the negative effect on the economy of tighter borrowing conditions and the widening of the spread between private investment and risk-free public investment.

All things considered, including taking into account the impact of the resurgence in oil prices after the onset of the recession, the spontaneous growth of the French economy would have averaged 2.6% over the past three years. The realization of this potential would have led to a further reduction in excess production capacity and would ultimately have cut short the downturn in the economy that actually took place.