Italy and the labour market: improvement, with caveats

By Céline Antonin

Since early 2015, the renewal of growth in Italy, the implementation of Act II of Matteo Renzi’s Jobs Act, and the reduction in business charges have undeniably contributed to the improvement on the country’s jobs front. Dynamic job creation, particularly with permanent (CDI) contracts, and an increase in the labour force, could give the impression that (partial) liberalization of Italy’s labour market has resolved the structural weaknesses it has been facing. Nevertheless, in the first half of 2016, the creation of permanent jobs has severely dried up, and what is driving growth in employment now is an increase in fixed-term (CDD) contracts. Moreover, stagnating labour productivity has accompanied more employment-yielding growth, particularly in the services sector. So in the absence of further action to address Italy’s structural weaknesses, the upturn in the labour market may not last.

A brief review of recent labour market measures

The Jobs Act is a continuation of a series of recent measures put in place since 2012 that are intended to create a more flexible labour market (see C. Antonin, Matteo Renzi’s Jobs Act: A very guarded optimism). In Act I, the Jobs Act led to extending the duration of fixed-term contracts from 12 to 36 months, eliminating waiting periods and allowing more renewal periods, while limiting the proportion of fixed-term contracts within a given company. Act II introduced a new type of permanent contract, with greater protection and severance pay increases in line with seniority. It also abolished the misuse of contratti di collaborazione, precarious work contracts often used to disguise an employment relationship. These were to be transformed into employment contracts from 1 January 2016 (1 January 2017 for the public administration).

Furthermore, Italy has opted for cutting the taxation of labour: in 2015, the wage share of the IRAP (regional tax on productive activities) for employees on permanent contracts was removed. Above all, the 2015 Finance Act abolished social security contributions for 3 years on the new form of permanent contracts with greater protection, up to a limit of 8,060 euros per year for new hires between 1 January and 31 December 2015 who had not been on permanent contracts in the six months preceding their employment. The total cost to the budget was 1.8 billion euros. The programme was partially extended in 2016: companies taking on employees on the new permanent contracts in 2016 will be exempted from 40% of their social contributions for 2 years, and the cap on the exemption from contributions was reduced to 3,250 euros per employee.

A sharp increase in the number of jobs created, but stagnation in the creation of permanent jobs in 2016 …

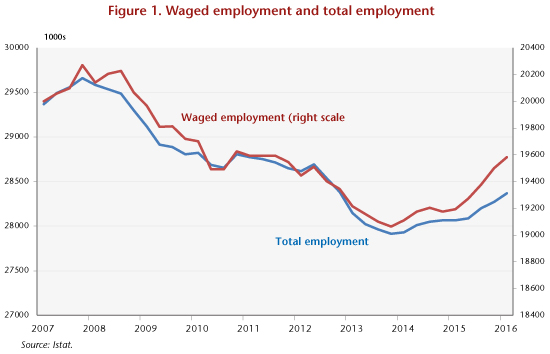
Since the beginning of 2015, the number of jobs grew strongly in Italy (Figure 1), but still falls far short of the pre-crisis level: between the first quarter of 2015 and the first quarter of 2016, the number of jobs grew by 304,000 (+391,000 permanent jobs).

graphe1_post07-09_eng

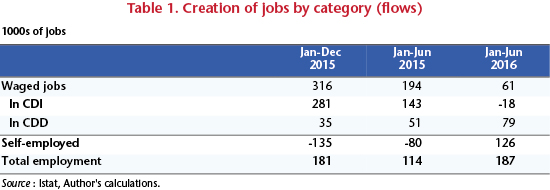
A breakdown of these figures (Table 1) reveals a major difference between 2015 and the first half of 2016: the number of new CDI jobs exploded in 2015 (+281,000 between January and December 2015), before drying up in the first half of 2016 (-18,000 from January to June 2016). In 2015, the dramatic increase in the number of CDI contracts is partly explained by the replacement of precarious jobs by permanent jobs with progressive guarantees. Thus, of the 2.0 million CDI jobs created in 2015, there were 1.4 million new CDIs and 575,000 fixed-term (CDD) contracts converted into CDIs (source: INPS). 60.8% of these new contracts benefited from the exemption from social security contributions. However, the number of new CDI contracts dropped by 33% in the first half of 2016 compared to the first half of 2015, as a result of the reduced creation of CDIs ex nihilo and a sharp fall in the conversion of CDDs into CDIs (-37%). There was nevertheless a sharp increase in the number of the self-employed in 2016, after two consecutive years of decline.

tab-1


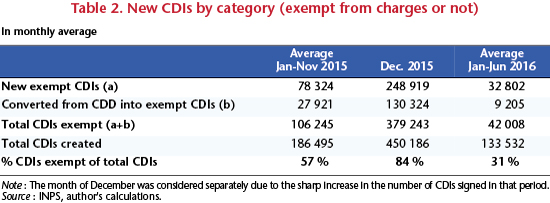
Thus, the zeal for CDIs mainly occurred in 2015, before withering in 2016. One of the reasons is the following: the reduction in social contributions for new hires on permanent contracts had a stronger impact than the Jobs Act itself. In fact, the reduction in social contributions applied only to contracts concluded in 2015. These were renewed for 2016, but on a much more limited scale (two years compared with three, with the cap on the exemption from payroll taxes cut by more than half), which may well explain the decline in enthusiasm. Moreover, an anticipation effect can be seen for the month of December 2015 (Table 2), with a steep increase in the number of CDIs fully exempt (they more than quadrupled compared to the average of the preceding eleven months). In the first half of 2016, there were on average 42,000 people hired per month who benefited from the two-year exemption on contributions, or 31% of total permanent CDI contracts[1], compared with 128,000 in 2015 (taking into account December). In 2015, the exempt contracts accounted for 61% of the total.

tab-2

 … but stagnation in the number of jobless due to the growth in the workforce …

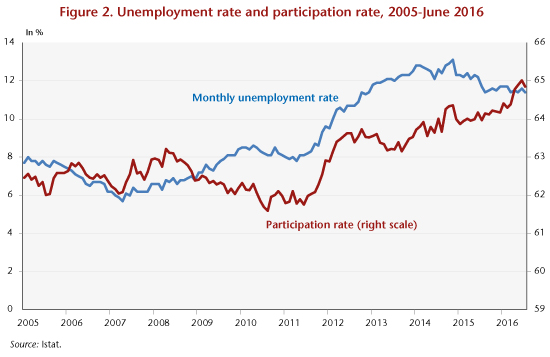
Despite the dynamic jobs market, unemployment has stagnated in Italy since mid-2015 at a level of 11.6% (Figure 2). This paradox is explained by the increase in the active population: between July 2015 and July 2016, the workforce expanded by 307,000 people. Several phenomena are behind this:

  1. The pension reform, which has led to seniors staying in their jobs;
  2. A “flexion” or bending effect: with the return of growth and the improvement in the labour market, discouraged workers have begun looking for jobs again;
  3. Immigration: positive net migration has had an impact on the labour market. The share of foreigners in Italy’s labour force rose from 10.7% to 11.1% between first quarter 2014 and first quarter 2016.

graphe2_post07-09_eng

In conclusion, although it is not reflected in the unemployment figures, there has been an undeniable improvement in Italy’s labour market, with a great deal of job creation and marked growth in the workforce. This improvement is attributable not just to the Jobs Act, but to three combined factors: 1) the return of growth since 2015, driven by the ultra-accommodative policy of the European Central Bank, less fiscal austerity and falling oil prices; 2) the reduction in labour taxes introduced in 2015 and extended in part in 2016; and 3) the implementation of the Jobs Act. In the light of Table 2, it can also be assumed that the reduction of business social charges had a stronger impact than the Jobs Act per se.

After the upturn in 2015, the figures for the first half of 2016 call for caution. The drying up of the creation of permanent jobs in 2016 shows that the Renzi reform did not resolve the underlying problem, namely the structural weaknesses of Italy’s labour market, in particular labour productivity. To restore growth and employment, Italy really needs to address the issue of structural reform, including the poor level of innovation, research and development, the low level of competitiveness and the undercapitalization of its SMEs.


[1] including the conversion of CDD contracts into CDIs.


The national living wage: a new means to boost low wages in the United Kingdom

By Catherine Mathieu

On 1 April 2016, a national living wage (NLW) took effect in the United Kingdom. This may come as a surprise to France, where the UK labour market is considered the epitome of a deregulated market. This new minimum wage, the NLW, adds 50 pence to the existing minimum hourly wage (the National Minimum Wage, NMW) for those over age 25, meaning a rise from £6.70 to £7.20, or 7.5%. This follows a 3.1% increase in the minimum wage in October 2015 for those over age 25 (from £6.50 to £6.70), for a total increase in one year of 10.8%. This sharp increase in the minimum wage does not represent a sudden change of course by the government. The Conservative election platform for the 2015 parliamentary elections already promised a raise in the minimum wage and pointed towards the introduction of a living wage. The announcement that the NLW would be established was made in July 2015, during the presentation of the budget by George Osborne, Chancellor of the Exchequer, following the Conservatives’ election victory. This is simply the first step in an effort to raise low wages, as the government has a target of increasing the NLW to 60% of the median wage by April 2020 (up from 55% at present), to about 9 pounds.[1]

This boost for low wages is part of a broader strategy of the British government: first, the government says it wants to “reward work”; not only has the minimum wage been increased, but eventually employees at the minimum wage level will no longer pay income tax (this was one of the Tories’ campaign promises in 2015). Furthermore, the government is taking measures to reduce taxes on business, including a symbolic cut in the corporation tax rate, which will be only 17% in 2020 (instead of only 20% currently), which will offset the increase in wages, at least for some companies (those that are most profitable). Finally, the government has set an ambitious target for reducing the public deficit, i.e. from 5% of GDP in 2015 to a balanced budget in 2020, in part by lowering public spending, particularly on social welfare. Raising the minimum wage would thus seem to be intended to offset, at least partially, a future reduction in benefits.

The UK’s process for setting the minimum wage is well codified. Every year the government revises the minimum wage on October 1st, based on the recommendations of the Low Pay Commission (LPC), an independent body composed of academics and representatives of employee trade unions and employers. The UK has had a minimum wage only since 1999. It was implemented according to the recommendations of the Low Pay Commission at levels that matched the low wages of that time, after broad consultation with the business sectors concerned. The implementation of the minimum wage failed to spark waves of protests from employers, nor did it have a significant impact on employment, according to various assessments by the LPC over the years. The minimum wage level was initially low, and included separate rates for adults and young people. The LPC is mandated to produce an annual report on low wages and to make recommendations to the government on adjusting the minimum wage so as to ensure that low wages do not have significant adverse impacts on the employment of the employees concerned. The government has now also charged the LPC with monitoring the implementation of the NLW and proposing future adjustments, which will take place every year in April.

The NLW applies only to those over age 25. The minimum wages of young people remain at the level set last October. There are currently five minimum wages: for apprentices (£3.30 per hour); for age 16-17 (£3.87 per hour); age 18-20 (£5.30); age 21-25 (£6.70); and over 25 (£7.20). These differences are substantial; the analyses by the LPC since 1998 have argued for lower wage rates for young people, so as to prevent them from being squeezed out of the labour market because of high salaries. This gap has won acceptance, unlike the situation in France, on the grounds that it promotes the growth of “odd jobs” for young people. The employment rate of British young people (15-24 years old) is very high (51.4% at end 2015, against 27% in France and 31% in the euro zone), and it is up significantly (it was 46.8% at end 2010).

In its March 2016 report, [2] the LPC drew some initial conclusions on the possible impacts of the NLW. In April 2016, about 1.8 million employees (out of 29 million salaried jobs) benefited from the NLW, while in 2015 one million adults over age 25 earned the minimum wage. The NLW represents an increase in the annual salary of 680 pounds (for the average working hours of the persons concerned, 1360 hours per year, 26h15 per week). The impacts will vary greatly depending on the sector. It is in the service sectors that low wages are most common (40% of jobs are paid the minimum wage in cleaning companies, 30% in the hotel-café-restaurant sector, and 34% in hairdressing). According to the LPC, this year the implementation of the NLW will impact payroll by around 0.7 billion pounds over the full year, i.e. 0.1% [3]; raising the NLW to 60% of the median wage will cost another 2.4 billion pounds, which by April 2020 will represent 0.4% of the total annual payroll. These figures include a diffusion effect on the first 25 percentiles of wage-earners. The impact of introducing the NLW on wages paid will be close to 4% in the cleaning sector and 3% in the hotel-café-restaurant and hairdressing sectors. Assuming a similar diffusion effect, the Bank of England [4] also estimated that the NLW would lead to a gradual increase in payroll of less than 0.5% in five years. About 3 million people would receive the NLW in 2020.

In July 2015, the Office for Budget Responsibility estimated that by 2020, the introduction of the NMW could result in the loss of 60,000 jobs, according to average assumptions of the elasticity of employment to its cost of – 0.4 [5], while also forecasting that over that same period the UK economy would create 1.1 million jobs. The national living wage is coming into force after several years of growth and job creation that has reduced the unemployment rate (by the ILO definition) to its pre-crisis level (5.2%), meaning that any job losses in certain sectors should be very manageable.

Criticism of the NLW is currently coming from two camps: first, the trade unions are accusing the measure of further widening the gap between the wages of young people and adults; and second, employers, particularly in low-wage sectors, are warning of the risk of expanding the informal economy if the NMW is effectively increased to 9 pounds per hour by 2020, although the current level of the NLW is generally considered acceptable.

These adjustments in the British minimum wage have led the UK to join the ranks of the OECD countries with the highest minimum wage levels, although it remains behind France, for example (Figure 1). The new national living wage still leaves the British minimum wage lower than the French minimum wage (the SMIC, which represents 60% of the median wage). At £7.20, or 9 euros, the hourly rate of the British national living wage is currently almost 7% lower than the level of France’s SMIC. After taking into account employer social contributions, the hourly cost of the NLW is also below the SMIC, because, even though France has enacted important exemptions from employer social contributions (Fillon exemption, Responsibility Pact, CICE credit, prime zero charge) on low wages, social contributions are also very low in the UK. Take the case of an adult over age 25, unmarried and childless, who works 35 hours per week (Table). The hourly cost to the employer is 9.48 euros in the UK against 10.43 euros in France; the hourly cost to the employer falls to 9.21 euros in the UK if the employee works 26h15 per week, which represents the average working time of employees on the minimum wage in the UK. If we now consider the salary received by the employee, net of employee social contributions and income tax, the NLW is higher than France’s SMIC, especially if the employee works more than 30 hours per week, which makes them eligible for the Working tax credit, which is more generous than France’s prime d’activité credit. On the other hand, French employees are entitled to a much more generous public system of pension and unemployment benefits.

The establishment of the national living wage in the UK thus represents an effort to catch wages up in sectors where low wages and part-time and precarious work are most common. This increase, in its current form, will have only a marginal macroeconomic impact on the British economy.

tab mathieu

graph mathieu


[1] As the aim is to reach 60% of the median wage, this figure of £9 is simply indicative, based on the projections of wage increases performed in March by the Office for Budget Responsibility (OBR). The OBR is an independent body that has been responsible since 2010 for performing the medium-term macroeconomic forecasts used for drawing up the UK budget and for analysing the UK public finances.

[2] See National minimum wageLow Pay Commission Report Spring 2016, March 2016.

[3] Given the low levels of working hours and hourly wages, workers on the minimum wage earned only a quarter of the average salary at end 2015. The minimum hourly wage represented only 42.8% of the average hourly wage (£6.70 against £15.70).

[4] See Inflation report, Bank of England, August 2015.

[5] This elasticity corresponds to the median of the empirical estimates made using British data. Job losses rise to 110,000 if we use the hypothesis of an elasticity of -0.75 but are only 20,000 for an elasticity of -0.15.


Give Recovery a Chance

By iAGS team, under the direction of Xavier Timbeau

The ongoing recovery of the Euro Area (EA) economy is too slow to achieve a prompt return to full employment. Despite apparent improvement in the labour market, the crisis is still developing under the covers, with the risk of leaving long-lasting “scars”, or a “scarification” of the social fabric in the EA. Moreover, the EA is lagging behind other developed economies and regardless of a relatively better performance in terms of public debt and current account, the current low rate of private investment is preparing a future of reduced potential growth and damaged competitiveness. So far, the Juncker Plan has not achieved the promised boost to investment. The internal rebalancing of the EA may fuel deflationary pressure if it is not dealt with through faster wage growth in surplus countries. Failure to use fiscal space where it is available will continue to weigh down on internal demand. Monetary policy may not succeed in the future in avoiding a sharp appreciation of the Euro against our trade partners’ currencies. Such an appreciation of the real effective exchange rate of the Euro would lock the EA in a prolonged period of stagnation and low inflation, if not deflation.

A window of opportunity has been opened by monetary policy since 2012. Active demand management aimed at reducing the EA current account combined with internal rebalancing of the EA is needed to avoid a worrying “new normal”. Financial fragmentation has to be limited and compensated by a reduction of sovereign spreads inside the euro area. Active policies against growing inequalities should complement this approach. Public investment and the use of all policy levers to foster a transition toward a zero carbon economy are ways to stimulate demand and respect the golden rules of public finance stability.

For further information, see iAGS 2016 report


The labour market on the road to recovery

By Bruno Ducoudré

A look at the figures just published by France’s Pôle Emploi job centre for the month of September 2015 shows that the number of job seekers who were registered and inactive (category A) has declined significantly (-23,800), following an increase in August (+20,000). While this is encouraging news, the decrease has to be compared with the increases seen in categories B and C (+25,600). So while employment has indeed picked up, this has not resulted in the numbers of people exiting unemployment as measured by the job centre, i.e. it has not put a stop to the continuing rise in the number of long-term unemployed (+10.4% in one year). Nevertheless, these trends do support the conclusions drawn from current analysis which indicate that a recovery has indeed begun.

After seeing 76,000 jobs created in France in 2014 due to growth in non-commercial jobs, the first half of 2015 was marked by an increase in the workforce in the commercial sector (+26,000), which resulted in an acceleration of job creation in the economy overall (+45,000) over the first half of the year. The recently released statistics on employment confirm the accelerating trend in the third quarter of 2015: hence, over a year, declarations on job hires of over one month recorded by ACOSS rose by 3.7%, following 0.7% in the previous quarter. Business surveys also point to an increase in hiring intentions in the third quarter; these have turned positive in the service sector since the year started, which is also when the low point seen in construction was probably reached (see Figure 1).

Our analysis of the labour market up to 2017, which was spelled out in the latest OFCE forecasts of October 2015, indicates that the commercial sector will continue to generate jobs up to the end of 2015 (+0.1% in the third and fourth quarters). The pace of job creation will nevertheless remain too low to foresee a fall in the unemployment rate by year end, particularly in light of our forecast for the GDP growth rate (0.3% in Q3 2015 and 0.4% in Q4) and the existence of overstaffing in companies, which we estimate at 100,000 in Q2 2015. The unemployment rate should remain stable at 10% until year end. With GDP growth of 1.8% in 2016, job creation will pick up markedly in the commercial sector once the overstaffing has been absorbed by companies, allowing the unemployment rate to fall starting in the second quarter of 2016. This decline will continue until the end of 2017.

G1_Post2610ang

The last three years of weak growth have hurt employment in the commercial sector (-73,000 jobs between the start of 2012 and the end of 2014, cf. the Table). The strength of employment in the non-commercial sector, supported by the ramp-up of subsidized contracts (the “jobs for the future” programme and non-commercial job integration contracts) helped to offset the loss of commercial sector jobs, with total employment rising by 164,000 over the same period, which slowed the increase in the ILO unemployment rate: this figure for mainland France rose from 9% of the labour force in late 2011 to 10.1% at end 2014, i.e. a 1.1 point increase.

tab1_BD2610ang_post

2015 is a year of transition, with a resumption of job creation in the commercial sector (+73,000 expected for the year as a whole) but less dynamic job creation in the non-commercial sector. For the full year, job creation will be boosted by the acceleration of growth (an annual average of +1.1% expected in 2015 but 1.4% yoy) and the implementation of policies to cut labour costs (CICE tax credit and the Responsibility Pact). The cumulative impact of the CICE and the Responsibility Pact, after taking into account the effect of financing, will create or save 42,000 jobs in 2015. However, job creation will be hampered by the presence of overstaffing[1]: as economic activity picks up pace, companies typically absorb underutilized labour before increasing the volume of employment.

As for the non-commercial sector, employment policy is continuing to support the labour market in 2015 through the increase in subsidized job contracts. This increase has nevertheless been slower than in previous years, with the number of “jobs for the future” contracts peaking in 2015 (Figure 2). Ultimately, total employment will increase by 103,000 in 2015, with the unemployment rate remaining stable at 10% till year end.

For 2016 and 2017, the acceleration of growth (at respectively 1.8% and 2%) combined with the ongoing implementation of policies to cut labour costs and the closing of the productivity cycle in the course of 2016 will lead to accelerating job creation in the commercial sector. This will increase, year on year, to 238,000 in 2016 and 245,000 in 2017 for the commercial sector alone, a rate comparable to what was seen between mid-2010 and mid-2011 (234,000 jobs created). However, in 2016, the number of subsidized contracts in the non-commercial sector set out in the 2016 Finance Bill will be down from previous years (200,000 CUI-CAE jobs and 25,000 “jobs for the future” in 2016, compared with 270,000 and 65,000 respectively for 2015). For 2017, we are assuming stability in the stock of subsidized non-commercial job contracts (see Figure 2). Overall, the long-term return of job creation by business will trigger a decline in the unemployment rate starting in the second quarter of 2016. Although sluggish, this fall should be sustainable, with the unemployment rate down to 9.8% of the labour force at end 2016 and 9.4% by end 2017.

G2_Post2610ang


[1] The presence of overstaffing in businesses derives from the gap between labour productivity and its long-term trend, called the productivity cycle. This reflects the time employment takes to adjust to economic activity. See Ducoudré and Plane, 2015, « Les demandes de facteurs de production en France » [The demand for production factors in France], Revue de l’OFCE, no.142.


Recession and Austerity: Gender Equality Jeopardized

By Anne Eydoux,[1] Antoine Math,[2] and Hélène Périvier[3]

The crisis that began in 2008 has hit European countries diversely, causing economic and labour market disequilibria of more or less magnitude. As with past global crises, the current one has gendered implications. While women’s employment is said to have been preserved relative to men’s in the early stage of a recession, austerity plans implemented in several countries to limit public deficits and debts are deemed to affect female workers more deeply. How gendered are labour market changes in recession and austerity and how should cross-country differences be analysed? This special issue of the Revue de l’OFCE notably points out the protective role of the gendered segregation of labour markets (i.e. the fact that women and men do not work in the same sectors or occupations): male-dominated sectors (construction, industry, etc.) are generally first hit in recession, while female-dominated sectors (services and the public sector) remain quite sheltered from a quick drop in the demand for labour – but are exposed to job losses at a later stage.

This collective publication aims to shed light on the differences in the gendered dimensions of past and/or present crises and related policies’ impacts on European labour markets. The issue includes several comparative papers that either deal with gender at the European Union (EU) level, encompassing a variety of European countries, or that focus on more specific groups of countries, such as those most hit by the crisis and austerity (central and eastern European (CEE) countries, southern countries) or ‘continental’ countries (France, Germany). To complete the picture, a focus on specific country cases helps understanding the great variety of crises and how related policies impact on gender in labour markets. For instance, in Germany where female employment has apparently been spared the effects of recession in quantitative terms, the focus is on the low quality of women’s jobs. In central and eastern Europe, as well as in southern countries such as Greece, Portugal and Spain, male and female employment has been so deeply affected in quantitative terms (both in the recession and in the austerity phase of policy) that poverty and material deprivation have increased for all. In the UK, the impact of the recession and austerity has been selective, increasing existing inequalities by gender and by ethnicity, as well as within each category. In Sweden, where the public sector is widespread and female-dominated, the impact of recessions on women’s employment has been delayed, occurring in austerity phases through the downsizing of the local government sector.

Various approaches are developed in this issue. First of all, many papers show the importance of the timing of recessions and define several phases with different gender implications, often distinguishing the recession and the austerity phases or adding an intermediate phase of recovery. When it comes to the analysis of crisis related policies, the phases may however sometimes appear less sharply, overlapping instead of alternating, for instance when austerity measures were implemented prior to the crisis – eventually in line with the economic governance of the euro zone or with a previous downturn. Several papers cover the long-term changes in labour market or public policies, trying to identify the impact of recession and austerity on trends in female and male employment (or foregone employment growth), and/or to question the change in public policies from a gender perspective. Others rather focus on the short-term gender impact of recession and austerity, exploring the relevance of common hypotheses regarding the demand for labour (segregation or buffer effects) or the labour supply (discouraged-worker or added-worker effects).


[1]              Centre d’études de l’emploi, anne.eydoux@cee-recherche.fr.

[2]              Ires, antoine.math@ires-fr.org.

[3]              OFCE-Presage, helene.perivier@ofce.sciences-po.fr.