Between 1999 and 2019, the eve of the Covid-19 pandemic, the public debts of the 11 oldest euro zone members had risen by an average of 20 percentage points of GDP. This increase in public debt is commonly attributed to structural budget deficits, particularly those in the pre-crisis period and in the “South”. But how much of the stock of public debt in 2019 can be attributed to structural deficits, and how much to GDP growth, interest payments or cyclical deficits? In this post, we use the December 2020 edition of the OECD’s Economic Outlook to break down the changes in public debt into its main factors: structural and cyclical primary balances, the interest burden, nominal GDP growth and stock-flow adjustments. This shows that the structural deficits generally contributed less than is commonly assumed, and that the increase in public debt over the period was largely the result of the direct and indirect consequences of the double-dip recession in the euro zone.
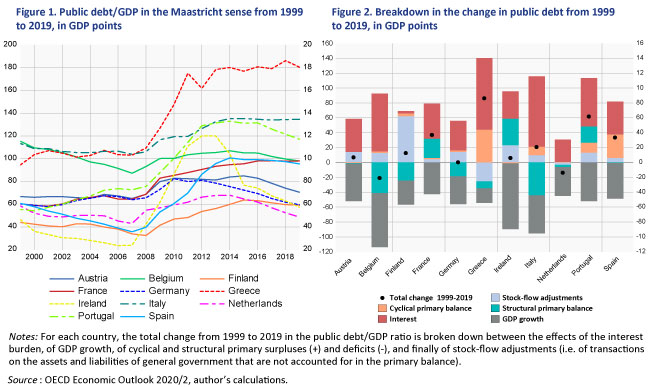
On the eve of the Covid-19 crisis, the 11 oldest euro zone countries had an average level of public debt (in the Maastricht sense) of 92% of GDP. Between 1999 and 2019, the public debt in these 11 countries increased by an average of 20 percentage points of GDP, although with considerable heterogeneity (Figure 1). On the one hand, a group of so-called virtuous countries – Germany, the Netherlands, Austria, Finland and Ireland – reduced their debt ratios to their 1999 level of 60% of GDP or even lower. In contrast to this were the countries whose public debt increased – France, Spain, Greece and Portugal – or remained at a high level – Belgium and Italy. Can we simply deduce from this that there are some countries that acted like the proverbial ant and others like the grasshopper? Probably not.
Indeed, not all countries entered the European Monetary Union (EMU) with the same level of debt: their starting point therefore biases observation insofar as it does not inform about the structural or cyclical factors or to the interest burden associated with the fiscal policy in place from 1999 to 2019. Is the rise in public debt in the “grasshopper” countries largely attributable to the accumulation of structural deficits, or on the contrary, to cyclical factors and the impact of the recessions in the euro zone (2008-2010 and 2011-2013)?
This post uses the December 2020 edition of the OECD’s Economic Outlook to break down the changes inpublic debt into the main components: structural and cyclical primary balances, the interest burden, nominal GDP growth and stock-flow adjustments. This shows that the contribution of structural deficits is generally lower than commonly assumed and that the increase in public debt over the period largely results from the direct and indirect consequences of the double-dip recession in the euro zone.
The accounting decomposition of public debt dynamics
The change in public debt (as a percentage of GDP) between year t and year t-1 can be broken down into five main factors, using the following equation:
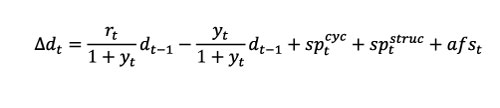
where rt / (1+yt) dt-1 is the effect of the interest burden, –yt / (1+yt)dt-1 is the effect of nominal GDP growth (and the sum of the two terms is the infamous snowball effect[1] of public debt), sptcyc is the cyclical component of the primary budget balance (excluding the interest burden), sptstruc is the structural primary balance (adjusted for the output gap) and afst represents the stock-flow adjustments, i.e. transactions on the assets and liabilities of general government that are not accounted for in the primary balance.
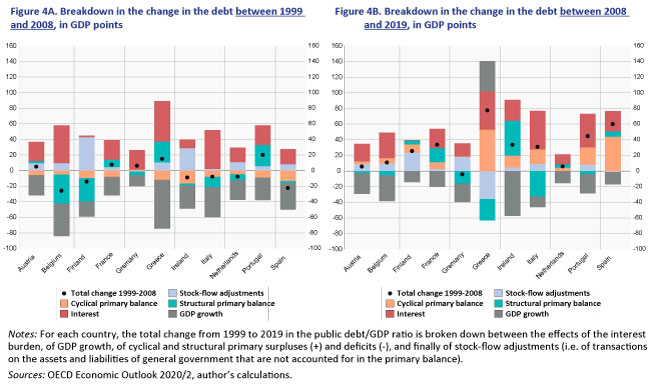
By aggregating each of these terms, we calculate the contributions to the total change in public debt between 1999 and 2019 (Figure 2) and year by year (Figure 3). Finally, Figures 4A and 4B present breakdowns of the public debt similar to Figure 2 but over two sub-periods: 1999-2008 and 2008-2019.
The scars of the double recession of 2008-2010 and 2011-2013 in the euro zone
The rise in public debt in the EMU is largely explained by the cyclical effects of the double recession of 2008-2010 and 2011-2013 (Figure 3). Between 2008 and 2019, in the three countries with the largest increases in public debt (Greece, Spain, Portugal), the rise in debt is due largely to cyclical primary deficits and the snowball effect. Greece is a striking example: the snowball effect accounts for almost 3/5 of the increase in public debt between 1999 and 2019, and this is concentrated mainly between 2008 and 2019, with the collapse of the level of GDP. In contrast, the apparent Irish “miracle” is actually due to massive nominal growth in 2015, which in turn is explained by the relocation of existing intangible assets in Ireland by multinationals.
Moreover, any positive contribution of structural deficits to debt growth during the 2008-2010 crisis is in fact an optimal countercyclical response of fiscal policy during the recession, and cannot be interpreted as a lack of fiscal seriousness per se. This was the case, however, in fewer than half of the countries studied: Spain, the Netherlands, France, Austria, and Ireland, and for the other countries this largely reflects the pro-cyclical character of discretionary fiscal policies in the euro zone over the period (Aldama and Creel, 2020).
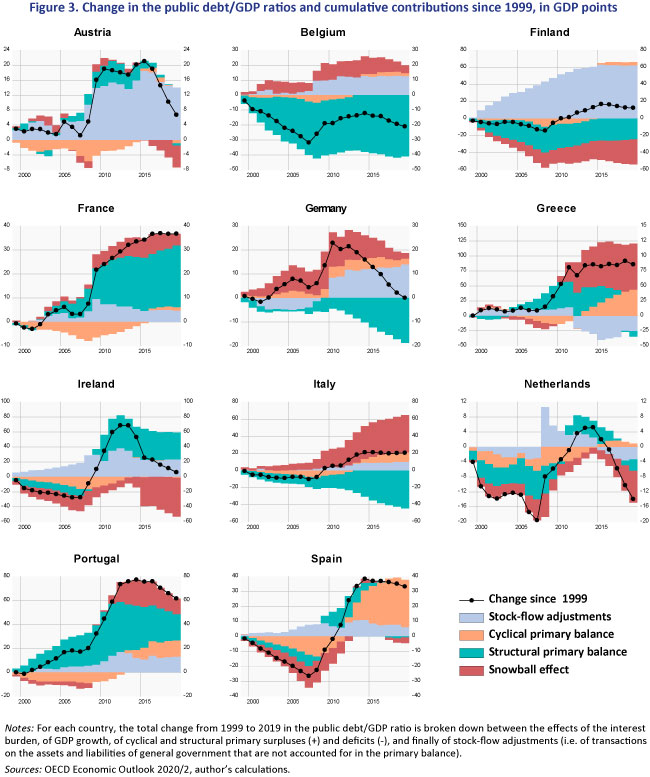
Finally, in general, the contribution of the stock-flow adjustments increases sharply after the 2008 crisis, mainly due to the banking sector rescue plan. In the case of Greece, the negative contribution of these adjustments largely corresponds to the 2012 default.
Northern surpluses vs. Southernstructural deficits in the euro zone?
Over the period 1999-2019, it appears that only three countries (France, Ireland and Portugal) showed a positive contribution of structural primary deficits to the rise in public debt. Remarkably, both Greece and Italy stand out from these countries with a negative contribution due to their structural primary surpluses, as shall be seen later, due in particular to the structural fiscal adjustment carried out since 2010 in the case of Greece. Belgium, which was heavily indebted at the time of its entry into the EMU (114% of GDP), is also characterised by the strong negative contribution of its structural primary balance to debt growth.
In the case of Greece, we observe in particular the sharp decline in the contribution of the structural primary balance, which even becomes negative in 2019: in other words, by 2010 Greece has more than offset the effect of its previous structural primary deficits. Even more remarkably, Italy has pursued a very tight fiscal policy over the entire period, in so far as the (negative) contribution of its structural primary surplus has steadily increased in absolute terms. Portugal lies in between, and started to run structural primary surpluses, without cancelling out the effect of its pre-2010 deficits. Ireland, sometimes presented as the “good pupil” in the euro area following the 2010 crisis, did not have post-crisis structural surpluses that offset the structural deficits run up during the crisis (the contribution to the change in debt was stable).
Focusing on the pre-2008 period (Figure 4A) and the so-called Southern countries, again only Greece and Portugal saw a positive contribution of their structural deficits to debt growth, while the contribution of the primary structural surpluses in Ireland, Italy and Spain was negative.
On the Franco-German side, the divergence is clear. German fiscal rigour appears almost extreme: even following the 2008-2010 crisis, the federal government’s primary structural balance did not contribute positively to debt growth, reflecting a very weak countercyclical discretionary policy (the German structural balance increased by 1 GDP point in 2010). Conversely, in the case of France, a large part of the variation in public debt can be explained by the structural deficits recorded both before and after 2008 (Figures 4A and 4B), although this slowed down in the second half of the 2010s (Figure 3). Thus, of the 37 GDP points of public debt accumulated since 1999, almost 26 points came from structural deficits accumulated over the period.
Of course, the distinction between the structural balance and the cyclical balance is critically based on the estimation of the level of “potential” GDP, i.e. of full utilization of production factors, without inflationary pressures. This measure is subject to great uncertainty, and there have been many criticisms, such as that it is too sensitive to the macroeconomic cycle and to demand shocks (Coibion et al. 2018; Fatas and Summers 2018). Some studies suggest that the level of potential activity may be underestimated. This likely bias in potential GDP estimates points to the need for a note of caution about any definitive interpretation of the structural vs. cyclical nature of budget deficits or surpluses. [2]
***
While public debt has increased overall in the euro zone since 1999, a large part of this growth is explained by the direct and indirect consequences of the 2008 crisis, through cyclical deficits, the aggravation of the snowball effect and the structural weakness of growth in certain Southern European countries.
On the contrary, most of the more indebted countries today ran high primary structural surpluses over the period, such as Italy and Belgium. Greece has even more than offset the positive contribution of its past structural deficits. This is the reason why a reading grid that is still overly used, that of the North versus the South, or of fiscal strictness versus fiscal leniency, cannot stand up to a simple accounting analysis of the dynamics of public debt.
[1] The snowball effect of public debt is the effect of the differential between the interest rate paid on the accumulated stock of debt and the economy’s growth rate. If this differential is positive, then for a given primary budget balance public debt tends to increase mechanically; conversely, if it is negative, public debt tends to decrease mechanically.
2] However, using the OECD Economic Outlook has the advantage of providing a homogeneous approach across countries, and therefore a relatively uniform bias between them. Moreover, the measure of potential GDP used by the OECD is less cyclical than the measures used by the IMF and the European Commission.
Leave a Reply