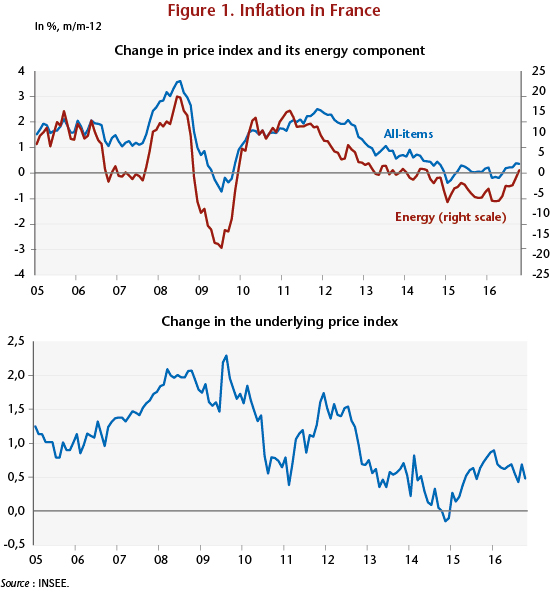
The publication of the price index by the INSEE on November 15 confirmed the return of inflation to positive territory, +0.4%, in October and September, after it oscillated around 0 since the end of 2014. The deflationary phase experienced over the past two years has in part replicated the trajectory of the energy price index, which saw the price of oil fall in early 2016 to one-third of its price in mid-2014. With a weighting of almost 8% in the all-items index, the energy price index, which incorporates the price of fuel but also of oil-indexed products such as gas and electricity, automatically pushed down inflation. This phase of energy-related disinflation now seems to have come to an end, with crude oil prices rising to between USD 45 and 50 a barrel since the low in mid-January 2016 at under USD 30. The gradual rise in the year-on-year change in the energy price index since spring has in fact pulled along the overall index.
However, the euro’s depreciation against the dollar, which paralleled the fall in oil prices (from 1.35 dollars per euro on average in the first half of 2014 to 1.10 on average since spring 2015), has had a contrary inflationary effect, first by moderating the fall in the prices of energy imports after their conversion from dollars to euros, and second by increasing the price of non-energy imports. Changes in the underlying price index, which excludes products with volatile prices (energy, some fresh food products) and products with administered prices (health care, tobacco, public prices) from the overall index, reflected this second effect by rebounding from early 2015. This increase in underlying inflation was not, however, due solely to the depreciation of the euro. The gradual end of the period of stagnation that marked the French economy between Q2 2011 and Q2 2014 reactivated inflationary mechanisms that had previously been thwarted by the easing of tension and the rise in unemployment.
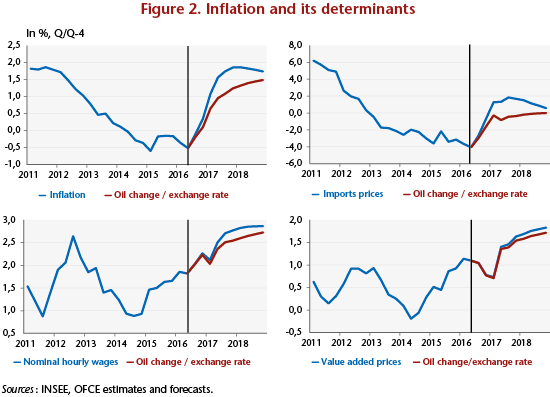
The inflationary upturn begun in the last few months is expected to continue until 2018. The exhaustion of the disinflationary impact of the oil counter-shock and the rise in the price of crude oil, which has already largely occurred but will continue through the forecasting horizon up to 52 euros per barrel from its low point in early 2016 (31 euros per barrel) should mark the end of the disinflationary phase linked to energy prices. On top of this, the depreciation of the European currency, also already accomplished in large part, will continue, with a fall from 1.10 euros per dollar in mid-October 2016 to 1.05 according to our forecast. This will contribute to higher import prices. Inflation should therefore have hit a low point in the second quarter of 2016 before becoming positive again in the second half of 2016. By 2017, price increases will be close to 2% year-on-year, partly due to the effect of the recovery in oil prices and the depreciation of the euro. Excluding these two effects, inflation would just exceed 1% by end 2017 and then reach 1.5% the following year.
==================================================================
The price-wage loop
Inflation forecasts are based on the modelling of a price-wage loop that estimates the parameters of the relationship between employees and companies: employers pass wage increases on to prices to preserve their margins, while employees respond to price increases by trying to obtain higher wages to preserve their purchasing power. Two equations model this process.
The wage formation equation (1) has terms for indexing wages to prices (PC), labour productivity (π), a part of which is redistributed in the form of wages, the unemployment rate (U), which governs workers’ bargaining power, and the minimum wage (SMIC), which can have impacts on the scale of adjacent wages.
Equation (2) gives the prices of value added (PVA), a function of unit wage costs, which can be broken down into the difference between wages (W) and labour productivity. The elasticity between the value-added prices and the unit wage cost (W – π) is set to 1, which means that, in the long run, fluctuations in unit labour costs do not affect companies’ target margin rate. Since there is inflationary pressure on the productive apparatus, the rate of utilization of production capacity (TU) is added to the unit labour costs.
The formation of prices in the domestic market also depends on the prices of imported goods excluding taxes (MP), which are a function of the price of oil expressed in euros (PPétrole) and the nominal effective exchange rate (TCEN).
Finally, an accounting equation for the formation of domestic prices combines the value-added prices and the pre-tax import prices, with the total being increased by the rate of VAT to simulate the after-tax price index on the domestic market (here the deflator of household consumption from the national accounts). The different equations are estimated using error correction models.
In accordance with this model, the trajectory of inflation by 2018 will be affected both by external impulses, namely changes in the effective exchange rate and in oil prices, and by internal impulses, namely the response of wages to these external shocks through indexation and the fall in unemployment. The renewed rise in oil prices and the depreciation of the effective exchange rate will revive imported inflation. Import prices will thus once again begin to rise in the first quarter of 2017, and will therefore contribute accounting-wise to the rebound in inflation. The indexing mechanisms will then push up wages, due to the added inflation. The fall in the unemployment rate begun at the end of 2015 will add to this impulse. Nevertheless, the rebound in inflation in the second half of 2016 cannot be reduced solely to the impact of external shocks. By neutralizing these effects and holding the nominal effective exchange rate and oil prices constant at their mid-2016 values, the rebound in inflation would not disappear, but it would be 0.6 percentage point lower at end 2017 (and 0.2 point lower at end 2018) relative to what comes from the central accounts (Figure 2).


Leave a Reply