The latest estimate of the British national accounts, published on 27 November, confirmed GDP growth of 0.8% in the third quarter of 2013, following 0.7% in the second quarter and 0.4% in the first quarter. This represents a sparkling performance for the UK economy, especially in comparison with the euro zone. GDP was up 1.5% year on year in the third quarter of 2013 in the UK, against -0.4% in the euro zone, 0.2% in France and 0.6% in Germany. In the eyes of some observers, Britain’s return to growth shows that fiscal austerity does not undermine growth … on the contrary. But the argument seems at a minimum questionable.
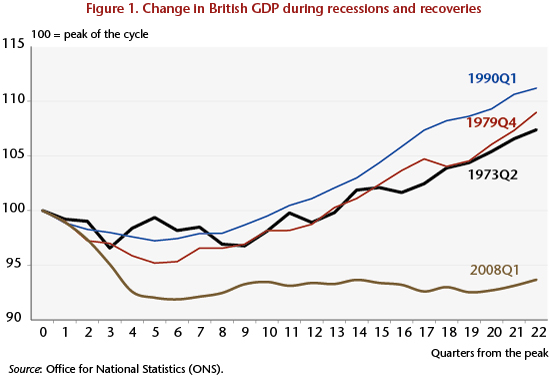
Let’s look at the numbers a little more closely. Admittedly, GDP is up 1.5% year on year in the third quarter, but it rose by only 0.1% in 2012 and is still 2.5 percentage points below its pre-crisis level: this does not really represent a great success. Even more striking has been the change in GDP since the start of the crisis: GDP initially fell 7 points between the first quarter of 2008 and the second quarter of 2009; the recovery then got underway, allowing GDP to rise 2 points in the third quarter of 2010, before it fell again. The GDP trajectory since the third quarter of 2010 has been quite unusual with respect to recoveries from previous crises (Figure 1).
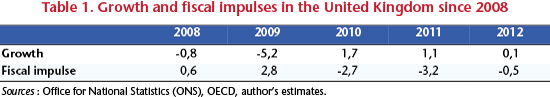
In 2008, the United Kingdom was one of the first industrialized countries to implement a recovery plan. Gordon Brown, Chancellor of the Exchequer in the Tony Blair government, lowered the standard VAT rate by 2.5 percentage points in December 2008 in an effort to boost household consumption. The measure, which was announced as temporary, was ended in late 2009. In 2009, fiscal policy was highly expansionary, with a fiscal impulse of 2.8 percent of GDP following a 0.6 point impulse in 2008 (Table 1). The public deficit increased under the dual impact of the recession and fiscal policy, as did the public debt.
In May 2010, the Conservatives won the election on a programme focused on reducing the public debt and deficit. This was supposed to ensure market confidence and maintain the AAA rating of Britain’s public debt, and thus keep the interest rate on the debt at a low level. This was combined with a very active monetary policy, with the Bank of England maintaining its key rate at 0.5%, buying government securities and making great efforts to facilitate the refinancing of banks and kick-start lending to businesses and households. The resumption of growth was supposed to come from business investment and exports.
The fiscal policy implemented by the David Cameron government has therefore been highly restrictive. At first, the measures focused on increasing revenue by raising the VAT rate and cutting spending, including on social benefits. The resumption of growth was interrupted. Fiscal policy had also become restrictive elsewhere in Europe, so economic activity slowed in the UK’s main trading partners. In 2012, fiscal austerity was sharply curtailed (Table 1). The growth figures in recent times are a long way from demonstrating the success of austerity.
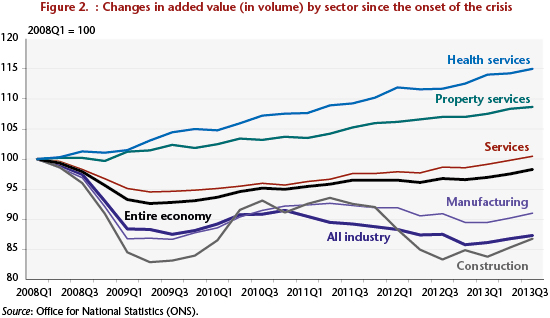
It is also important to note that David Cameron has excluded health expenditure from his cost-cutting plan. The British are attached to their public health care system, and the newly elected Conservatives were determined in 2010 not to repeat the mistake made in the 1980s when Margaret Thatcher was head of government. So fiscal austerity has not hit the health sector. The result is clear in terms of activity: value added (by volume) in the health sector is now 15 points above its pre-crisis level – in other words, it has continued to grow at an average annual rate of nearly 3% (Figure 2). The second sector where activity has remained strong since 2008, and which has even accelerated since the end of 2012, is real estate. Property prices in the UK had risen sharply before the crisis, leading to record household debt, and have not dropped much since then. Indeed, they have remained historically high and even begun to rise from 2012 (at an annual rate of about 5%). But other sectors are lagging behind. Most services have for instance only now regained the level of pre-crisis output, and some of them are still well below this level: -9% for financial services and insurance, which is comparable to the figure for manufacturing, while output in the building sector is down 13%.
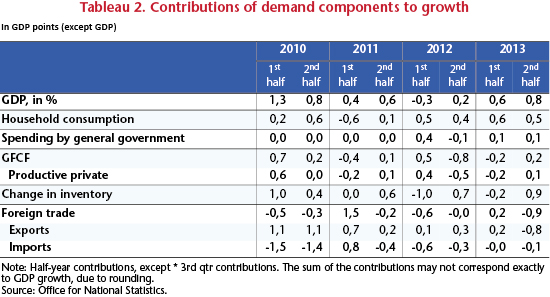
Since 2008, British growth has thus been driven in part by a public service spared from fiscal austerity and by real estate services supported by an ultra-active monetary policy… The British recovery could, moreover, give birth to a new housing bubble. Household consumption is now the main engine of growth (Table 2). The failure of investment to pick up represents one of the main setbacks suffered by the supply-side policy implemented since 2010 by the government. The government wants to make the UK tax system the most competitive in the G20, and to this end has slashed the corporate tax rate to the lowest in the G20 (the rate, lowered to 23% this year, will be only 20% in 2015). But business investment has nevertheless not picked up again. The government is also relying on exports to drive growth, but given the economic situation prevailing in Britain’s main foreign markets, in particular the euro zone, this is just not realistic. After having experienced sustained growth in previous quarters, boosted by strong sales outside the European Union until the summer, exports have contributed to a sharp fall-off in growth in the third quarter (-0.8 GDP point). As the British government prepares to present its budget on 5 December, support for fiscal policy would be welcome to help keep the UK economy on the road to recovery in the coming months…