By Céline Antonin
At a time when the subject of labour market reform has aroused passionate debate in France, Italy is drawing some initial lessons from the reform it introduced a year ago. It should be noted that the labour market reform, dubbed the Jobs Act, had been one of Matteo Renzi’s campaign promises. The Italian labour market has indeed been suffering from chronic weaknesses, including segmentation, a duality between employees with and without social protection, high youth unemployment, and a mismatch between costs and labour productivity. Renzi’s reform takes a social-liberal approach, advocating flexicurity, with the introduction of a new permanent employment contract with graduated protection, lower social charges on companies, and better compensation and support for the unemployed. Although the initial assessment is surely positive in terms of both unemployment and job creation, there’s no cause for hasty triumphalism: the reform has been implemented in especially favourable circumstances, marked by a return of growth, an accommodative policy mix, and a stagnating work force.
Jobs Act Italian-style: The key points
The Jobs Act is actually the latest in a series of measures adopted since the Fornero Act of 2012 that are aimed at a more flexible labour market. Act I of the Jobs Act, the Poletti Decree (DL 34/2014), was adopted on 12 May 2014, but went relatively unnoticed because it targeted fixed-term contracts and apprenticeships. It allowed in particular extending the duration of fixed-term contracts from 12 to 36 months, suppressing gap periods, and allowing for more fixed-term contracts to be renewed, all while limiting the proportion of fixed-term contracts within a single company[1].
The real change came with Act II of the Jobs Act, for which the Italian Senate passed enabling legislation on 10 December 2014. The eight implementing decrees adopted in the first half 2015 have four key points:
– The elimination of Article 18 of the Labour Code, which allowed reinstatement in cases of manifestly unfair dismissal: the reinstatement requirement was replaced by a requirement for indemnification that is capped[2], with reinstatement still being required in case of a dismissal involving discrimination;
– The creation of a new form of permanent (open-ended) contract and graduated protection, lying between permanent contracts and fixed-term contracts: dismissal was facilitated during the first three years on the job, with severance pay that increases with employee seniority;
– The suppression of the abuse of what are called “collaboration contracts”, [3]precarious contracts that are often used to disguise an actual employment relationship, affecting about 200,000 people. These contracts will be transformed into wage labour contracts from 1 January 2016 (1 January 2017 for public administrations), except for a few limited cases;
– The reform of unemployment insurance, with an extension of compensation schemes. The benefit period, for instance, is extended to two years (from 12 months previously). As for compensation for short-time working (“technical unemployment”), this is extended to cover apprentices and companies with 5-15 employees[4]. A National Employment Agency (ANPAL), which introduces a one-stop system that helps to link training and employment, was also established.
Note that only measures related to experimentation with a national minimum wage[5], which are contained in the enabling law in December 2014, were not addressed.
Alongside the Jobs Act, Italy opted to lower taxes on labour: in 2015, the wage part of the IRAP (equivalent to a business tax) for those employed on permanent contracts was eliminated, reducing the amount of the IRAP by about one-third. Above all, Italy’s 2015 Budget Act eliminates social security contributions for 3 years on the new open-ended contracts with graduated protection, up to a limit of 8,060 euros per year for new hires taken on between January 1 and December 31, 2015 who did not have permanent job contracts in the six months preceding their hiring. This measure is expected to cost 3.5 billion euros between now and 2018. It was extended in 2016: companies that hire employees on the new permanent contracts in 2016 will be exempt from 40% of social security contributions for 2 years.
Strong jobs growth and a lower unemployment rate
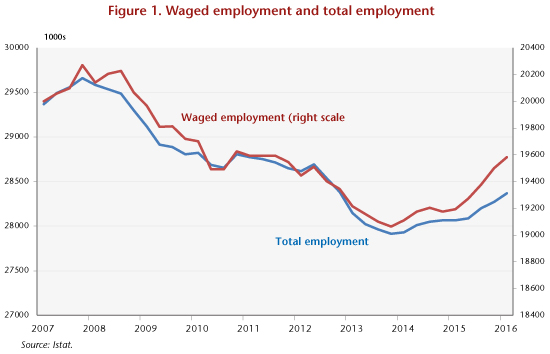
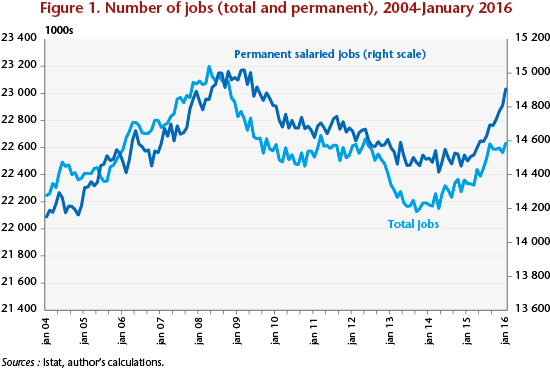
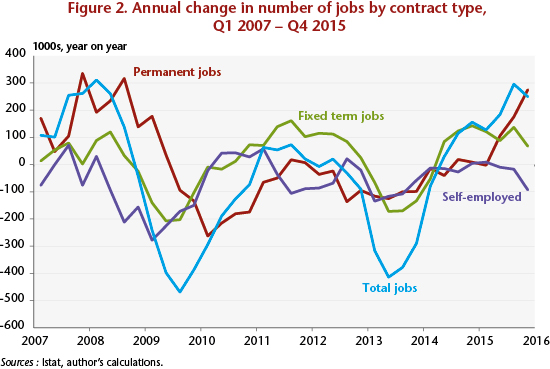
There has been strong growth in employment, in particular permanent jobs, since the start of 2015: between January 2015 and January 2016, the number of employed increased by 229,000, with strong growth in the number of salaried employees (+377,000) and a decline in the number of self-employed (-148,000). Among employees, there was a sharp increase in the number of permanent positions (+328,000). The number of permanent employees has now returned to the 2009 level of 22.6 million (Figure 1); as for total employment, even if it has not yet reached its pre-crisis level, the decline in the 2012-2014 period has been overcome. At the same time, the annual rate of job creation has returned to its pre-crisis level, with growth of about 250,000 per year (Figure 2).
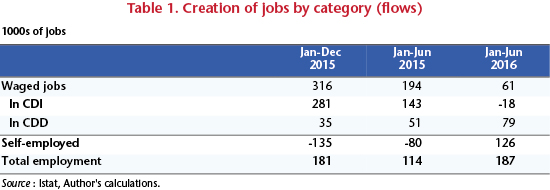
In addition to new hires on permanent contracts, the Jobs Act has led to replacing precarious jobs with permanent jobs with increasing guarantees. Thus, 5.4 million new jobs were created in 2015 (+11% compared to 2014)[6], mainly permanent jobs. Of the 2.4 million permanent jobs created, there were 1.9 million new open-ended contracts and 500,000 fixed-term contracts that were converted into open-ended contracts (including 85,000 apprenticeship contracts), up sharply from 2014. There were also fewer collaboration contracts (a 45% decrease from Q3 2014 to Q3 2015) and apprenticeship contracts (-24.6%). Note also the 4.3% increase in the number of resignations and the 6.9% decrease in layoffs.
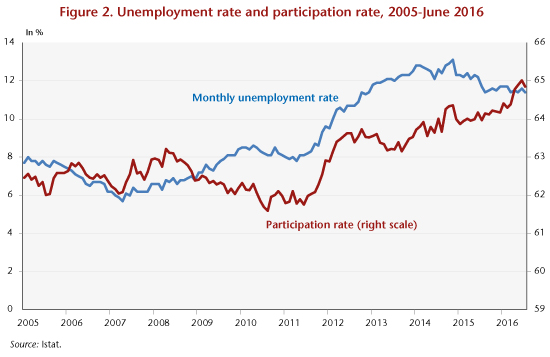
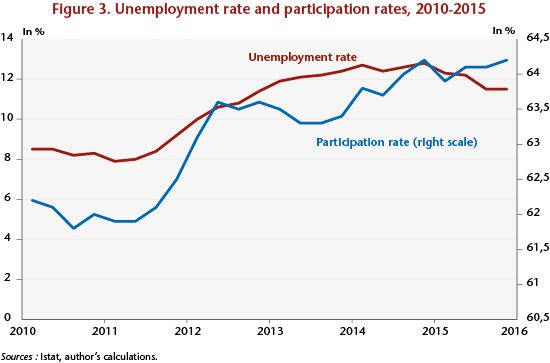
The corollary to this jobs growth is a marked fall in the unemployment rate (Figure 3), which fell to 11.4% in the last quarter of 2015 (from 12.8% one year earlier). However, the decline in unemployment was also due to stagnation in the labour force in 2015, unlike previous years that were marked by the pension reform.
Uncertainties remain
Matteo Renzi seems to have won his bet. Yet this fall in unemployment should not be over-interpreted, as a number of positive factors have undoubtedly contributed to strengthening this trend.
First, there was a windfall effect related to the announcement of the exemptions on social contributions for hiring new permanent employees, which led some companies to put off new hiring planned for 2014 until 2015 (which led to a rise in unemployment in late 2014). Moreover, part of the fall in unemployment is related to the impact of replacing precarious short-term contracts with the new permanent contracts with graduated protection (see above). The question is whether the new flexibilities allowed by these new contracts will be used over the next three years, and consequently whether there will be an increase in contract terminations.
In addition, the stagnation of the work force (Figure 3) has significantly amplified the downward trend in unemployment. With the improvement observed in the labour market, we expect in the future that the growth in the workforce that began in the last quarter of 2015 will continue due to what is called in French an “effet de flexion”, or “bending effect”, [7] which would absorb some of the impact of the job creation in 2016 and 2017.
Furthermore, the Jobs Act was adopted when the economy was emerging from a recession, with a recovery that, while soft (+0.6% growth in 2015), still exceeded the growth potential [8]. The easing of fiscal constraints had a stimulus effect in 2015, which may partially explain the fall in unemployment. As for monetary conditions, they are particularly favourable, as Italy is one of the main beneficiaries of the quantitative easing measures taken by the ECB.
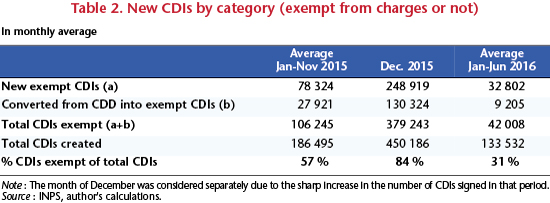
Notwithstanding these qualifications, it is undeniable that the cut in the social contributions level has had a positive impact. The February 2016 report of the National Social Security Institute (INPS) showed that, of the 2.4 million new permanent jobs created in 2015, 1.4 million benefited from exemptions on employer contributions, or almost two-thirds of these new jobs. Moreover, the reduction of precarious job contracts and their replacement by permanent contracts, even if they offer less protection than before, is a rather encouraging sign for access to long-term employment by groups that have traditionally been more marginal (self-employed, collaboration contracts).
Perhaps the main regret about this reform is the absence of a component aimed explicitly at vocational training, which is one of the main weaknesses of Italy’s labour market. The country holds a dismal EU record for the number of young people (15-24) who are neither in employment nor in school or training. Moreover, the workforce has insufficient training, and investment in research and development is low, which results in low productivity. It is legitimate to want to take action on labour costs and the duality of the labour market, but this will not be enough to solve the problem of productivity and the inadequacy of the workforce. Matteo Renzi would therefore do well to foresee an Act III in his labour reforms to finally pull the country out of its stagnation.
[1] See C. Antonin, Réforme du marché du travail en Italie : Matteo Renzi au pied du mur, [Labour market reform in Italy: Matteo Renzi with his back to the wall], Note de l’OFCE no. 48.
[2] The monetary payment is determined by a scale based on the employee’s seniority. It is equivalent to two months of the final salary per year of service, for a total that cannot be less than 4 months of salary and is capped at 24 months.
[3] “Intermediate status between salaried employment and self-employment, for workers not subject to a hierarchical subordination but ‘coordinated’ with the company and creator of certain social rights. These are self-employed workers who are, in fact, dependent on a single client company (which exercises limited management powers, for example in terms of the organization of work and the working time).” E. Prouet, Contrat de travail, les réformes italiennes [The job contract, the Italian reforms], France Stratégie, La Note d’Analyse, no. 30, May 2015.
[4] Other measures concerning short-time work (“chomage technique”) are also planned, including that an employee on short-time work may not have their hours cut by more than 80% of their total work hours. Furthermore, the period during which a company may resort to this procedure is a maximum of 24 months over five rolling years.
[5] There is no national minimum wage in Italy, with minimum wages instead set at the industry level, as was the case in Germany before 2015.
[6] This figure of 5.4 million represents gross job creation, including all forms of employment (including very short-term contracts), and without taking into account job destruction. In terms of net job creation between January 2015 and January 2016, we accept the figure of 229,000.
[7] When unemployment rises, working-age people are discouraged from reporting for the labour market. Conversely, when employment picks up again, some people are encouraged to return to the labour market, slowing the decline in unemployment; this phenomenon is called the “effet de flexion” in French, or the bending effect.
[8] Labour productivity tends to grow relatively slowly in Italy; consequently, an increase in production tends to create more jobs in Italy than in France for example, where labour productivity is higher.
 A very strong fiscal stimulus in 2019
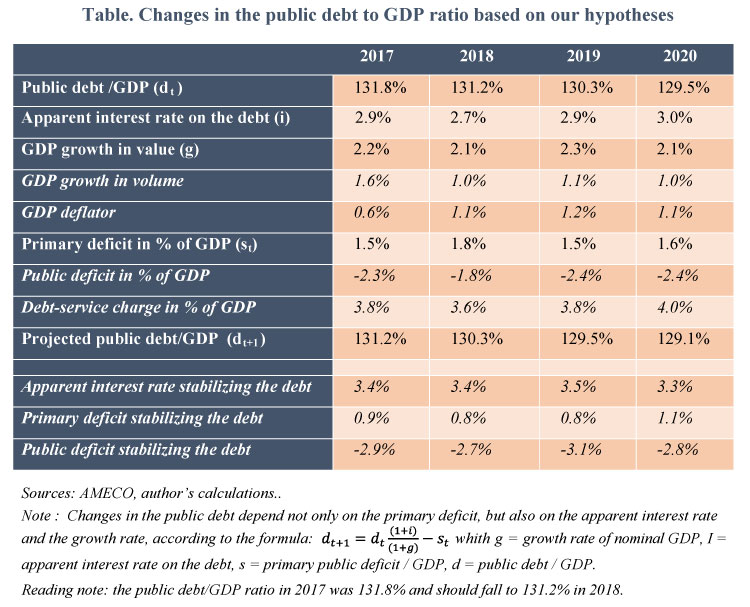
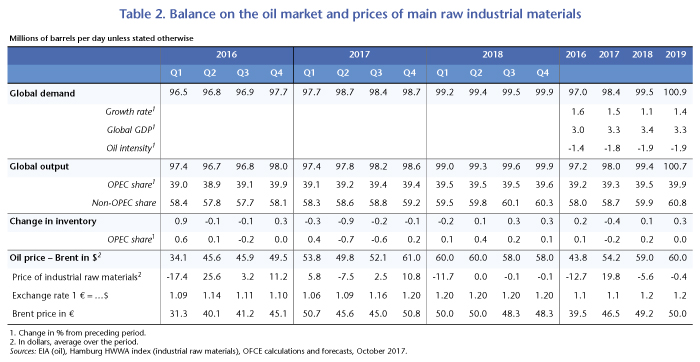
 In 2017, it was domestic demand that was driving growth; the contribution of foreign trade was zero because of the dynamism of imports and the absence of any improvement in price competitiveness. We anticipate that the contribution of foreign trade will be null in 2018 and slightly positive in 2019 thanks to an improvement in competitiveness (Table).
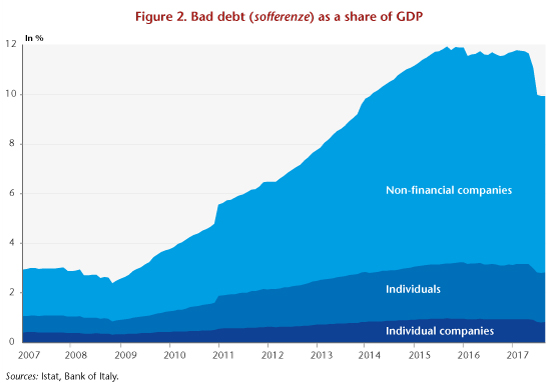
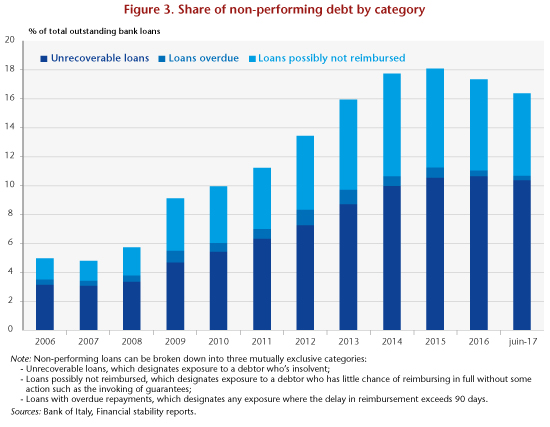 The Italian government has implemented various reforms to cope with the difficulties facing the country’s banking sector. First, it has been working to accelerate the clearance of bad debts and to reform the law on bankruptcy. Legislative Decree 119/2016 introduced the “martial pact” (patto marciano), which makes it possible to transfer real estate used as collateral to creditors (other than the debtor’s principal residence); the real estate can then be sold by the creditor if the default lasts more than 6 months. Other rules aim at speeding up procedures: the use of digital technologies for hearings of the parties, the establishment of a digital register of ongoing bankruptcy proceedings, the reduction of opposition periods during procedures, an obligation for judges to order provisional payments for amounts not in dispute, the simplification of the transfer of ownership, etc.
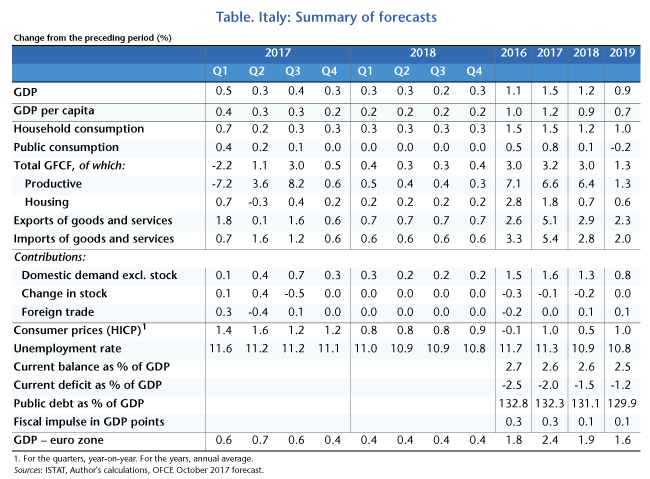
 Balancing supply and demand by 2018-2019