By Gilles Le Garrec
The problem of inequality in the face of death has become an important topic in French public discourse in recent times, in particular in autumn 2010 during debate about raising the minimum legal retirement age by two years, by gradually shifting it from age 60 to 62. The debate became focused around a politically divisive issue: should the retirement age remain unchanged for low-skilled workers on the grounds that they enter the labour market earlier and / or have more strenuous jobs and live shorter lives? Since the socialist government came to power in 2012, two exemptions have been introduced to allow less-skilled workers to continue to retire at 60. First was the introduction in summer 2012 of an exception for a “long career”, that is to say, for those who have contributed for a sufficiently long time. This September 2013 it has also been decided to set up a “hardship” account, starting in 2015, which will allow all employees who are exposed to working conditions that reduce their life expectancy to retire earlier. Nevertheless, the issue of inequality in the face of death – a taboo subject? – involves much more than simply the retirement age; before that, there are also the issues of inequality in income, housing, access to employment, education, etc. What follows is a small panorama (statistical) on inequality in the face of death in France, its causes and the difficulty of developing a political solution due to the multidimensional factors involved.
Very old – but not very reliable – statistics
From the late 18th century [1], the development of censuses, which was associated with the rise of statistics, has made it possible to build up data that show the existence of a close link between inequality in the face of death and social inequality more generally. These early studies show that inequality in the face of death is explained primarily by income (Cambois, 1999). However, the import of these studies is limited due to the low reliability of their data and methodology. It is no easy matter to develop reliable indicators on this issue. Once we have the socio-professional categories (SPC) for death statistics and censuses, we can easily calculate mortality rates by comparing the number of deaths for the year (or years) classified by SPC with the size of the population classified in the same way. For example, in France for the period 1907-1908 Huber catalogued on an annual basis the death of 129 business executives aged 25 to 64 out of a total of 10,000, compared with 218 workers. This simple and intuitive method nevertheless gives a distorted view of social inequality in the face of death, due to incompatibilities between population data and mortality data (Desplanques, 1993). The difficulty of obtaining an accurate representation of inequalities in the face of death becomes especially difficult with this method, as there is a growing trend for career paths to fragment, with alternating periods of activity and unemployment.
The longitudinal method and its lessons
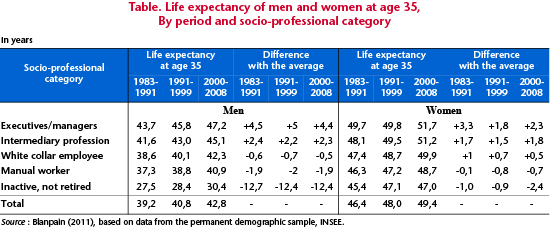
To overcome this problem, France’s INSEE has developed a longitudinal method that consists of regularly monitoring a group of individuals who have particular characteristics at a given point in time, and ultimately the date of their death. The permanent population sample thus obtained, which was initialized during the census of 1968, currently includes approximately 900,000 individual histories, ensuring a good representation of the French population (Couet, 2006, for a description of this sample and how it was constructed). This large-scale socio-demographic panel makes it possible to draw a relatively accurate picture of social inequality in the face of death in France. This shows that individual lifetime varies greatly from one socio-professional category to another, especially among men (Table 1). Male executives have a life expectancy (at age 35) that is four to five years above the average for men. Excluding inactive people [2], the most disadvantaged groups are manual workers, followed by white-collar employees, with life expectancies that are, respectively, two years and one year less than the average. Another interesting point is that the overall gain of four years in life expectancy over the period did not reduce inequalities in the face of death. The relatively stable result is that at age 35 the life expectancy of manual workers is six to seven years less (and white-collar employees five to six years less) than that of corporate executives and managers. In addition, at age 35 on average the latter experience 34 years in good health [3], 73% of their life expectancy, against 24 years for manual workers, or 60% of their life expectancy (Cambois et al., 2008). While among women, the difference in life expectancy between managerial personnel and manual workers was “only” three years at the time of the last census, the differences are comparable with those for men in terms of life expectancy in good health. The conclusion is clear: numerous social inequalities persist in the face of death, including in terms of health. This conclusion holds for every country in Western Europe that has conducted this kind of study, although it should be noted that the level of inequality in France appears to be the greatest by far (Kunst et al., 2000). The ratio of “manual to non-manual mortality” in France was 1.71 for men age 45-59, whereas it is on the order of 1.35 in most other countries (Finland, second behind France in terms of inequality, is 1.53). Leaving aside issues of data comparability, alcohol consumption is, according to Kunst et al. (2000), the most important factor behind the specific situation of France. Indeed, the greatest inequalities in mortality in France are due to major differences in mortality due to liver cirrhosis and to cancer of the aerodigestive tract, both of which are associated with excessive alcohol consumption.
The causes
Several factors have been identified to explain the difference in mortality between socio-professional categories.
First, one can easily imagine that the working conditions of manual workers are usually physically demanding and debilitating. Moreover, during the 1980s we have seen a transformation in the structure of unskilled jobs. Over this period, the increasing need for businesses to be highly responsive has led to a more widespread use of flexible and precarious forms of employment (short-term contracts; atypical schedules; development of part-time, temporary work, etc.). But the increasingly precarious nature of work, which affects low-skilled jobs above all, is contributing to a serious deterioration in working conditions. Global economic conditions may therefore play a part in explaining disparities in mortality. In any event, working conditions are not improving as quickly for manual workers as for managers. This is certainly the view that was advocated in establishing the “hardship” account that is to be implemented from 2015. So any private sector employee who is exposed to working conditions that reduce life expectancy will accumulate points that will, among other things, enable them to retire early, and potentially before the statutory threshold of 62.
It should also be noted that the most disadvantaged groups cumulate a number of risky behaviours, such as smoking, excessive alcohol consumption, poor diet and a sedentary lifestyle. In contrast, managers and the intermediate professions smoke and drink in moderation. As was already pointed out as a factor in France’s poor results in Western Europe (Kunst et al., 2000), these differences in behaviour show up clearly in the mortality rates associated with certain diseases. The risk of death due to a tumour in the aero-digestive tract (larynx, pharynx, lungs, oesophagus, liver) is especially high among manual workers, and is at the heart of a significant portion of the observed differences in mortality. For example, during the 1980s, among men aged 45 to 54, the mortality rate associated with a tumour of the pharynx was 11 times higher for skilled workers and labourers than for teachers and the intellectual professions (Desplanques, 1993).
A lack of access to healthcare for the most disadvantaged groups is another explanation offered for the disparities in mortality, first of all because of costs. Mormiche (1995) thus shows that the consumption of medical products (their quantity but also their nature) is highly dependent on income. Disparities in access to healthcare are particularly marked for care that is expensive or poorly covered (especially dental). Herpin (1992) points out that a reduction in income due to a loss of employment leads to an almost proportional reduction in consumer spending, including on health. The risk of death rises by 60% for unemployed men in the years following a job loss (Mesrine, 1999). A man in poor health is of course more likely to be unemployed, but unemployment, due to the development of financial stress and disorientation and to personal factors, may affect health by creating a physical and emotional distance with respect to obtaining care.
Finally, the social environment and the local context play an important role in the persistence of social inequalities in the face of death, as can be seen in Table 1. The idea that the behaviour of individuals is influenced by their place of residence has been developed in an extensive literature in the fields of both sociology and psychology (Roberts and DelVecchio, 2000). Mechanisms through which children identify with the behaviour of the adults surrounding them highlight a collective type of socialization. However, socio-spatial polarization, which is characterized by the creation of urban areas that cumulate all sorts of social disability, has been steadily increasing since the 1980s in France (Fitoussi et al., 2004). In these neighbourhoods, the high level of concentration of groups characterized by risky behaviours may, through this process of identification, root these behaviours in the core of people’s lifestyle. This phenomenon may explain why prevention policies among high-risk populations are ineffective. The financial difficulties that are giving rise to the under-utilization of medical facilities can also wind up leading to social distancing from health issues. The weak participation of women from disadvantaged strata in public programmes to screen for breast cancer is illustrative of this. Moreover, even in countries where there is effective universal health coverage, the differences in the consumption of healthcare persist.
What should we conclude?
Social inequality in the face of death is a sensitive issue. At the heart of this problem lie a multitude of more or less overlapping causes. To be effective, policies to combat this type of inequality must grasp them as components of an ensemble, with interactions throughout their economic, social and spatial dimensions. While awaiting the reduction of these larger inequalities, it would seem worthwhile to establish just social policies that take account of this inequality in the face of death. In this regard, setting up a “hardship” account that enables any employee who is exposed to working conditions that reduce their life expectancy to retire earlier is definitely a step in the right direction. Nevertheless, the establishment of criteria is not as easy as it seems. Indeed, it is clear that a good share of social inequality in the face of death can be explained by risky behaviour. Some might reason that such behaviours are an expression of individual freedom and that it is not up to society to compensate for the consequences. Or, it could be argued, to the contrary, that these behaviours are a response to psychosocial stress caused by, among other things, difficult working conditions. From this perspective, the compensation represented by an earlier retirement would seem more equitable. But it is not certain that we can really distinguish these two cases. You can bet that the future definition of the criteria for accumulating points to meet the “hardship” criteria giving entitlement to early retirement will be the subject of lengthy negotiations….
References
Cambois E., 1999, Calcul d’espérances de vie sans incapacité selon le statut social dans la population masculine française, 1980-1991: un indicateur de l’évolution des inégalités sociales de santé, PhD thesis.
Cambois E., Labourde C. and Robine J.-M., 2008, “La ‘double peine’ des ouvriers: plus d’années d’incapacité au sein d’une vie plus courte”, Population § Sociétés, no. 441, INED.
Desplanques G., 1993, “L’inégalité sociale devant la mort”, Données Sociales, INSEE.
Kunst A., Groenhof F. and Mackenbach J., 2000, “Inégalités sociales de mortalité prématurée: la France comparée aux autres pays européens”, in Les Inégalités sociales de santé, under the editorship of Leclerc A., Fassin D., Grandjean H., Kaminski M. and Lang T., Editions La découverte/Inserm, Recherches.
_______________________________________
* I would like to thank Sandrine Levasseur, Hélène Périvier and Evens Salies for their insightful comments.
[1] Pioneering works that could be cited include those by Moheau (1778) and Villermé (1840).
[2] A category that groups individuals who have never worked. For women, this means mainly “housewives”.
[3] Good health is defined by the absence of limitations on everyday activities and the absence of incapacity.