The ECB is extending its QE programme but mixes up its communications

By Paul Hubert

On Thursday, March 10, after the meeting of its Governing Council, the European Central Bank (ECB) announced a series of additional measures for the quantitative easing of monetary policy. The aim is to prevent the onset of deflation and to boost growth in the euro zone. The key innovation lies in the measure for bank financing at negative rates. While the measures were well received by the markets at the time of the announcement, a lapse in Mario Draghi’s communications during the press conference following the Board of Governors meeting greatly undercut some of the impact expected from the decisions taken.

What decisions were taken?

– The three key rates set by the ECB were lowered. The main refinancing rate went down from 0.05% to 0%, while the marginal lending rate was cut from 0.30% to 0.25%. Finally, the deposit facility rate, which compensates the excess reserves that banks hold on the ECB’s balance sheets, is down from -0.30% to -0.40%. It thus now costs a bank more to have cash on the ECB’s balance sheet.

Quantitative easing (QE) has been extended in terms of its scale – securities purchases rose from €60 bn to €80 bn per month – but especially in terms of the types of securities eligible for purchase. While heretofore the ECB has bought government bonds (sovereign and/or local authority bonds), it will now buy high-quality corporate bonds, based on rating agency criteria. This measure is a direct response to the drying up of the supply of government securities and is expected to directly influence the conditions for corporations active on the bond markets.

– The most significant innovation concerns the new Targeted Longer-Term Refinancing Operations (TLTRO), which are intended to reboot the channels of bank lending and to provide financing to banks on the condition that they finance the real economy. These loans to banks will be at a zero or even negative rate, based on various criteria, including the amount of loans that the banks provide to households and businesses. In other words, the ECB will pay banks meeting these criteria, so that they in turn lend.

What is the expected impact?

The effect to be expected from these measures depends on the situation of the credit market. Numerous studies show that in normal times these measures have a positive effect on the economy. However, this holds true only if it is the supply of credit that is currently constricted in the euro zone. Conversely, if the problem lies in the demand for credit on the part of consumers and businesses who have poor prospects in terms of income and profits, then these measures will have little effect. In granting banks such favourable conditions, it is easy to imagine that the ECB is betting on increasing the solvent demand for credit, that is to say, that the ECB is providing banks with strong incentives to lend to households and individuals that might have appeared non-creditworthy in previous conditions. Another expected effect of the lower deposit facility rates and the increase in QE will pass through the channel of a lower exchange rate for the euro, which will promote euro zone exports and increase imported inflation, and therefore overall inflation in the euro zone. This channel is potentially even more important given that the US Federal Reserve has initiated a period of monetary tightening.

Nevertheless, a more relevant economic policy would be to make use of fiscal policy to support demand, especially as the conditions for State financing are at historically low levels: the French state in 2016 is earning money from issuing debt of less than 4 years. Monetary policy would then have all the more effect.

Why announce that there’s no manoeuvring room left?

At the press conference following the meeting of the Governing Council, Mario Draghi announced that the ECB didn’t expect “to reduce rates further”, which had the effect of completely changing the financial markets’ interpretation of the decisions announced just before that. While the aim of these very expansionary decisions is to further ease monetary and financial conditions and to lower the exchange rate for the euro, the announcement that future changes in the ECB’s monetary policy could only be in a more restrictive direction transformed investor expectations.

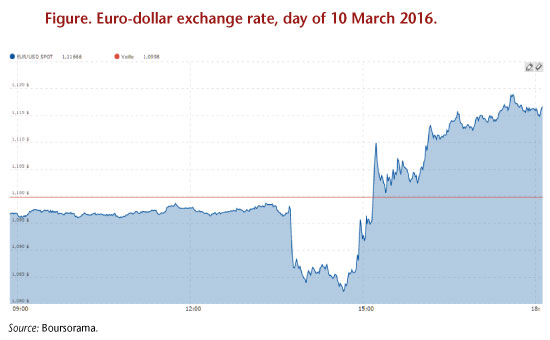
As one of the main channels for the transmission of monetary policy involves expectations, several studies conducted on data from the US [1], Britain [2] and the euro zone [3] show that a central bank’s communications need to be consistent with its decisions, otherwise the impact expected from monetary policy will be limited. This is called the “signal effect” of monetary policy. Mario Draghi’s short statement is one such example. The following graph shows the exchange rate of the euro vis-à-vis the dollar during the course of 10 March. The sharp drop at mid-day corresponds to the publication of the decisions taken by the Board of Governors, while the equally sharp rise corresponds to the contradictory message issued a few minutes later at the press conference. We thus see that as a series of highly expansionary measures – one of whose goals is to push down the euro – was announced, the euro eventually rose vis-à-vis the US dollar as if restricting measures had been put in place.

This does not necessarily mean that these decisions will have no effect, but that some of the effect will be lessened, or even disappear. Some transmission channels other than the signal effect remain operative. While the exchange rate channel has now been limited by the restrictive effect generated by the channel of expectations, we will see in the weeks and months to come whether capital movements induced by the decisions taken will have the effect expected on the euro exchange rate.

Graphe_post11-03_ENG

[1] Hubert, Paul (2015), “The Influence and Policy Signalling Role of FOMC Forecasts”, Oxford Bulletin of Economics and Statistics, 77(5), 655-680.

[2] Hubert, Paul, and Becky Maule (2016), “Policy and Macro Signals as Inputs to Inflation Expectation Formation”, Bank of England Staff Working Paper, No. 581.

[3] Hubert, Paul (2015), “ECB Projections as a Tool for Understanding Policy Decisions”, Journal of Forecasting, 34(7), 574-587, or Hubert, Paul (2016), “Disentangling Qualitative and Quantitative Central Bank Influence”, OFCE Working Paper, No. 2014-23.


The French economy on the road to recovery

by Hervé Péléraux

The publication of the INSEE’s business surveys on October 22 confirms the French economy’s positive situation in the second half of 2015, suggesting that the negative performance in the second quarter of 2015 (0%) will turn out to have been merely “an air pocket” after the strong growth seen in the first quarter (+0.7%). The business climate in industry has exceeded its long-term average for the seventh month in a row, and the service sector has been recovering rapidly since May 2015 and has climbed back to its average, the highest level in four years (Figure 1). The business climate in the construction sector nevertheless is still suffering from the crisis that hit it, but its downward trend halted at the end of 2014; despite monthly hiccups, the sector has begun a slow recovery that could signal the end of its woes in the coming quarters.

G1_post23-10ang

The confidence indicators, which provide qualitative information summarizing the balance of opinion on the various questions posed about business activity, consumer confidence and the situation in commerce, can be converted into quantitative information by means of an econometric equation linking these to the quarterly GDP growth rate[1]. Doing this makes it possible to use these purely qualitative data to estimate the GDP growth rate in the past and near future (two quarters), given that the publication of the surveys precede that for GDP. Among the sectoral indicators available, only the business climate in industry, services and construction provide econometrically useful information to trace the trajectory of the GDP growth rate. The other series are not significant, in particular the indexes for consumer confidence and for confidence in the retail and wholesale trade.

The leading index, which has a significantly more smoothed profile than GDP growth rates, cannot fully capture the volatility of activity and therefore should not strictly speaking be considered a predictor of growth (Figure 2). On the other hand, from a more qualitative viewpoint, it manages to delineate quite correctly the phases during which growth is above or below average (or the long-term) determined by the estimate. From this perspective, the indicator can be seen as marking a turning point in the economic cycle. Since the second quarter 2011, the indicator has not depicted any crossing of the long-term growth rate, despite the false signs of recovery raised by the quarterly GDP figures for Q2 2013 and Q1 2015.

Based on the survey data available up to October, the growth foreseen by the indicator is 0.4% in the third and fourth quarter of 2015, exactly equal to long-term growth[2]. While a signal of recovery is not yet clearly given by the indicator, it should be noted that the information on the fourth quarter, which is limited to the October surveys, is quite partial. The confidence climates, which are extrapolated to the end of the year, are based on conservative assumptions and are likely to be upgraded if the surveys continue to improve from now to December.

G2_post23-10ang

The quantitative information available at this time for the third quarter of 2015 also gives cause for optimism, after the disappointment of the second quarter. Under the impact of the disinflation brought on by lower energy prices, which enabled a sharp rebound in purchasing power, household consumption of goods recovered sharply at the beginning of the year (Figure 3). The rise was interrupted in the second quarter, due to poor sales in March, which pulled down the figures, but consumption has resumed its upward trajectory continually since then. The carry-over in August for the third quarter was clearly positive (+0.6%), which suggests that the consumption of goods will again contribute positively to GDP growth for the quarter.

G3_post23-10ang

The projection of a return to growth in the third quarter is also confirmed by trends in the industrial production index (IPI), which rose sharply in August (+1.6% for the total IPI, and +2.2% for the manufacturing index itself). This rebound followed a drop in production after the peak in February-March 2015[3], which contributed to the poor performance of GDP in the second quarter (Figure 3), and nourished the idea that the second quarter was not an “air pocket” but the continuation of a long phase of stagnation for a France that was unable to take advantage of the favourable winds blowing from outside[4]. The carry-over in industrial production in August now stands at 0.3%, while it was ‑0.7% in the old series available in July.

The recent trends in the monthly indicators augur a renewal of growth in the third quarter of 2015. The extrapolation of GDP growth using the leading indicator, supplemented by the already available quantitative data, also points to a 0.4% increase in activity in the third quarter, which, if it is realized, would then put the economy on a firm track to finally initiate a recovery.


[1] For greater detail, see: « France : retour sur désinvestissement, Perspectives 2015-2017 pour l’économie française » [The 2015-2017 forecast for the French economy], pp. 34-37.

[2] The long-term growth considered here is not the potential growth estimated by its structural determinants using a production function, but the average GDP growth rate as reflected in the estimate of the indicator.

[3] It should be noted that the statistical revisions can change the perception of the economy’s dynamics in the very short term. The IPI series published on 9 October 2015 by the INSEE has revised the level of the index significantly upwards compared to the previous publication. The IPI is still on a downward trend between February and July 2015, but the trajectory described is less negative, and the quarterly average of the index in the second quarter of 2015 is affected: according to the old series, it stood at -0.7%, compared with -0.4% according to the revised series.

[4] See Heyer E. and R. Sampognaro, 2015, « L’impact des chocs économiques sur la croissance des pays développés depuis 2011 », [The impact of economic shocks on the growth of the developed countries since 2011], Revue de l’OFCE, no. 138, June 2015.


The labour market on the road to recovery

By Bruno Ducoudré

A look at the figures just published by France’s Pôle Emploi job centre for the month of September 2015 shows that the number of job seekers who were registered and inactive (category A) has declined significantly (-23,800), following an increase in August (+20,000). While this is encouraging news, the decrease has to be compared with the increases seen in categories B and C (+25,600). So while employment has indeed picked up, this has not resulted in the numbers of people exiting unemployment as measured by the job centre, i.e. it has not put a stop to the continuing rise in the number of long-term unemployed (+10.4% in one year). Nevertheless, these trends do support the conclusions drawn from current analysis which indicate that a recovery has indeed begun.

After seeing 76,000 jobs created in France in 2014 due to growth in non-commercial jobs, the first half of 2015 was marked by an increase in the workforce in the commercial sector (+26,000), which resulted in an acceleration of job creation in the economy overall (+45,000) over the first half of the year. The recently released statistics on employment confirm the accelerating trend in the third quarter of 2015: hence, over a year, declarations on job hires of over one month recorded by ACOSS rose by 3.7%, following 0.7% in the previous quarter. Business surveys also point to an increase in hiring intentions in the third quarter; these have turned positive in the service sector since the year started, which is also when the low point seen in construction was probably reached (see Figure 1).

Our analysis of the labour market up to 2017, which was spelled out in the latest OFCE forecasts of October 2015, indicates that the commercial sector will continue to generate jobs up to the end of 2015 (+0.1% in the third and fourth quarters). The pace of job creation will nevertheless remain too low to foresee a fall in the unemployment rate by year end, particularly in light of our forecast for the GDP growth rate (0.3% in Q3 2015 and 0.4% in Q4) and the existence of overstaffing in companies, which we estimate at 100,000 in Q2 2015. The unemployment rate should remain stable at 10% until year end. With GDP growth of 1.8% in 2016, job creation will pick up markedly in the commercial sector once the overstaffing has been absorbed by companies, allowing the unemployment rate to fall starting in the second quarter of 2016. This decline will continue until the end of 2017.

G1_Post2610ang

The last three years of weak growth have hurt employment in the commercial sector (-73,000 jobs between the start of 2012 and the end of 2014, cf. the Table). The strength of employment in the non-commercial sector, supported by the ramp-up of subsidized contracts (the “jobs for the future” programme and non-commercial job integration contracts) helped to offset the loss of commercial sector jobs, with total employment rising by 164,000 over the same period, which slowed the increase in the ILO unemployment rate: this figure for mainland France rose from 9% of the labour force in late 2011 to 10.1% at end 2014, i.e. a 1.1 point increase.

tab1_BD2610ang_post

2015 is a year of transition, with a resumption of job creation in the commercial sector (+73,000 expected for the year as a whole) but less dynamic job creation in the non-commercial sector. For the full year, job creation will be boosted by the acceleration of growth (an annual average of +1.1% expected in 2015 but 1.4% yoy) and the implementation of policies to cut labour costs (CICE tax credit and the Responsibility Pact). The cumulative impact of the CICE and the Responsibility Pact, after taking into account the effect of financing, will create or save 42,000 jobs in 2015. However, job creation will be hampered by the presence of overstaffing[1]: as economic activity picks up pace, companies typically absorb underutilized labour before increasing the volume of employment.

As for the non-commercial sector, employment policy is continuing to support the labour market in 2015 through the increase in subsidized job contracts. This increase has nevertheless been slower than in previous years, with the number of “jobs for the future” contracts peaking in 2015 (Figure 2). Ultimately, total employment will increase by 103,000 in 2015, with the unemployment rate remaining stable at 10% till year end.

For 2016 and 2017, the acceleration of growth (at respectively 1.8% and 2%) combined with the ongoing implementation of policies to cut labour costs and the closing of the productivity cycle in the course of 2016 will lead to accelerating job creation in the commercial sector. This will increase, year on year, to 238,000 in 2016 and 245,000 in 2017 for the commercial sector alone, a rate comparable to what was seen between mid-2010 and mid-2011 (234,000 jobs created). However, in 2016, the number of subsidized contracts in the non-commercial sector set out in the 2016 Finance Bill will be down from previous years (200,000 CUI-CAE jobs and 25,000 “jobs for the future” in 2016, compared with 270,000 and 65,000 respectively for 2015). For 2017, we are assuming stability in the stock of subsidized non-commercial job contracts (see Figure 2). Overall, the long-term return of job creation by business will trigger a decline in the unemployment rate starting in the second quarter of 2016. Although sluggish, this fall should be sustainable, with the unemployment rate down to 9.8% of the labour force at end 2016 and 9.4% by end 2017.

G2_Post2610ang


[1] The presence of overstaffing in businesses derives from the gap between labour productivity and its long-term trend, called the productivity cycle. This reflects the time employment takes to adjust to economic activity. See Ducoudré and Plane, 2015, « Les demandes de facteurs de production en France » [The demand for production factors in France], Revue de l’OFCE, no.142.


Lower taxation on business but higher on households

By Mathieu Plane and Raul Sampognaro

Following the delivery of the Gallois Report in November 2012, the government decided at the beginning of Francois Hollande’s five-year term to give priority to reducing the tax burden on business. But since 2015, the President of the Republic seems to have entered a new phase of his term by pursuing the objective of reducing the tax burden on households. This was seen in the elimination of the lowest income tax bracket and the development of a new allowance mechanism that mitigates tax progressivity at the lower levels of income tax. But more broadly, what can be said about the evolution of the compulsory tax burden on households and businesses in 2015 and 2016, as well as over the longer term?

Based on data provided by the INSEE, we have broken down trends in the tax burden since 2001, distinguishing between levies on companies and those on households (Figure). While this is purely an accounting analysis and is not based on the final fiscal impact, it nonetheless gives a view of the breakdown of the tax burden[1]. In particular, this exercise seeks to identify the tax burden by the nature of the direct payer, assuming constant wages and prices (excluding tax). This accounting breakdown does not therefore take into account macroeconomic feedback and does not address the distributional and intergenerational impacts [2] of taxation.

For the period from 2001 to 2014, the data is known and recorded. They are ex post and incorporate both the effects of the discretionary measures passed but also the impact of fiscal gains and shortfalls that are sensitive to the business cycle. However, for 2015 and 2016, the changes in the tax burden for households and businesses are ex ante, that is to say, they are based solely on the discretionary measures that have an impact in 2015 and 2016 and calculated in the Social, Economic and Financial Report of the 2016 Finance Bill for 2016 [Rapport économique social et financier du Projet de loi de finances pour 2016]. They therefore do not, for both years, include potential effects related to variations in tax elasticities that could modify the apparent tax burden rates. Furthermore, under the new accounting standards of the European System of Accounts (ESA) tax credits, such as the CICE, are considered here as reductions in the tax burden, and not as a public expenditure. Furthermore, the CICE tax credit is recognized at the tax burden level in terms of actual payments and not on an accrual basis.

Several major points emerge from this analysis of the recent period. First, tax rates rose sharply in the period 2010-2013, representing an increase of 3.7 percentage points of GDP, with 2.4 points borne by consumers and 1.3 by business. Over this period, fiscal austerity was relatively balanced between households and business, with the two experiencing a tax increase that was more or less proportional to their respective weights in the tax burden [3].

However, from 2014 a decoupling arose between the trends in the tax burdens for households and for business, which is continuing in 2015 and 2016. Indeed, in 2014, due to the impact of the CICE tax credit (6.4 billion euros, or 0.3 percent of GDP), the tax burden on business began to decline (by 0.2 GDP point), while the burden on households continued to rise (by 0.4 GDP point), mainly because of the hike in VAT (5.4 billion), the increase in environmental taxes (0.3 billion with the introduction of the carbon tax) and the increase in the contribution to the public electricity service (CSPE) (1.1 billion), together with the increase in social contributions for households (2.4 billion), mainly due to the rise in contribution rates to the general and complementary social security scheme and the gradual alignment of rates for civil servant with those for private-sector employees.

In 2015, the tax burden on business will fall by 9.7 billion euros (0.5 GDP point) with the implementation of the CICE tax credit (6 billion), the first Responsibility Pact measures (5.9 billion related to the first tranche of reductions in employer social security contributions, an allowance on the C3S tax base and a “suramortissement”, an additional tax reduction, on investment), while other measures, such as those related to pension reform, are increasing corporate taxation (1.7 billion in total). Conversely, the tax burden on households should increase in 2015 by 4.5 billion (0.2 GDP point), despite the elimination of the lowest income tax bracket (-2.8 billion) and the reduction in self-employed contributions (-1 billion). The hike in the ecological tax (carbon tax and TICPE energy tax) and the CSPE together with the non-renewal in 2015 of the exceptional income tax reductions of 2014 represent an increase in taxation on households of, respectively, 3.7 and 1.3 billion. Other measures, such as those affecting the rates of contributions to general, supplemental and civil servant pension schemes (1.2 billion), along with local taxation (1.2 billion), including the modification of the DMTO tax ceiling and measures affecting tourist and parking taxes, are also raising taxes on households.

tab_Post2210ang

In 2016, the tax burden on business will fall by 5.9 billion (0.3 GDP point), mainly due to the second phase of the Responsibility Pact. Reductions in employer social security contributions on wages lying between 1.6 and 3.5 times the SMIC minimum wage (3.1 billion), the elimination of the corporate income tax (IS) surcharge (2.3 billion), the second allowance on the C3S tax base (1 billion), the implementation of the CICE tax credit (0.3 billion) and the additional tax reduction on investment (0.2 billion) have been only partially offset by tax increases on business, mainly with the hike on pension contribution rates (0.6 billion). However, as in previous years, the tax burden on households will increase in 2016 by 4.1 billion (0.2 GDP point), despite a further reduction in income tax (2 billion). The main measures increasing household taxation are similar to those in 2015, including environmental taxation, with the hike in the carbon tax (1.7 billion) and the CSPE tax (1.1 billion), measures on financing pensions (0.8 billion), and the expected increase in local taxation (1.1 billion). Note that the elimination of the PPE working tax credit in 2016 will mechanically lead to an increase in the household tax burden of 2 billion[4], but this will be offset by an equivalent amount for the new Prime d’activité working tax credit.

Ultimately, over the period 2010-2016, the household tax burden will increase by 66 billion euros (3.1 GDP points) and the burden on business by 8 billion (0.4 GDP point). The household tax burden will reach a historic high in 2016, at 28.2% of GDP. Conversely, the corporate tax burden in 2016 will amount to 16.4% of GDP, less than before the 2008 crisis. And in 2017, the last phase of the Responsibility Pact (with the complete elimination of the C3S tax and the reduction of IS corporate tax rates) and the expected CICE-related reimbursements should lead to cutting corporate taxation by about 10 billion euros, bringing the corporate tax burden down to the lowest point since the early 2000s.

The need to finance measures both to enhance corporate competitiveness and to reduce the structural deficit is placing the entire burden of the fiscal adjustment on households. Thus, the reduction in income tax in 2015 and 2016 will not offset the rise in other tax measures, most of which were approved in Finance Acts prior to 2015, and seems low in relation to the tax shock that has hit households since 2010. However, how these recent tax changes affect growth and the consequent impact on inequality will depend on the way business makes use of the new resources generated by the massive decline in its tax burden since 2014. These funds could lead to a rise in wages, employment, investment or lower prices or to higher dividends and a reduction in debt. Depending on the way business allocates these, the impact to be expected on the standard of living in France and on inequality will not of course be the same. An evaluation of the impact of these changes on the tax burden will surely lead to future studies and debate.

G1_Post2210ang


[1] The tax burden on households includes direct taxes (CSG, CRDS, IRPP, housing tax, etc.), indirect taxes (VAT, TICPE, CSPE, excise taxes, etc.), tax on capital (ISF, DMTG, property tax, DMTO, etc.), and salaried and self-employed social security contributions. The corporate tax burden includes the various taxes on production (value-added tax and corporate property tax (ex-TP), property tax, C3S tax, etc.), taxes on wages and labour, corporate income tax and employer social security contributions.

[2] For example, employer social contributions for pensions are analyzed here as a tax burden on business and not as deferred wages for households or a transfer of income from assets to retirees.

[3] In 2013, 61% of the tax burden was on households and 39% on business. However, over the 2010-2013 period, tax increases were borne 64% by households and 36% by business, which was more or less their respective weights in taxation.

[4] The PPE credit will be replaced by the Prime d’activité working tax credit, in an equivalent amount, which also encompasses the RSA activité tax credit; for accounting purposes the PPE is considered as a public expenditure. However, this new measure should not change household income macroeconomically, but only the nature of the transfer. Thus, excluding the elimination of the PPE, the tax burden on households would increase by 2.1 billion in 2016.


The upward drift in senior unemployment continued in August

Analysis and Forecasting Department (France team)

The figures for the month of August 2015 published by France’s Pôle Emploi job centre show a significant increase in the number of people registered as Category A (+20,000), i.e. an additional 156,000 job seekers over one year, following two months of relative stability. While this figure is undoubtedly disappointing, the uncertainty surrounding monthly fluctuations in enrolment at the job centre should not be forgotten. Despite the downturn in the numbers registered in categories B and C in the last month (-11,600), the number of job seekers who have carried out an active job search has risen by nearly 332,000 since August 2014.

This figure nuances the publication of the unemployment rate as defined by the International Labour Office (ILO), which gives a less negative image of the French labour market. This statistic points to a slight fall in the unemployment rate in the first six months (-0.1 point), largely due to shrinkage of the labor force (-0.2 point).

Beyond the total figure, the data published for August confirms the divergences observed between different age groups. While up to September 2010 the number of people aged 50 or over registered in Category A at the job centre was lower than for the under 25 age group, there are now 330,000 more unemployed seniors than unemployed youth (graph). The increase in this gap since 2010 is due to several factors. The implementation of a series of pension reforms (2003, 2010), coupled with the elimination of exemptions for seniors on job-seeking, has led to a longer duration of employment and a later statutory retirement age. In a context of weak growth, the rise in the rate of senior employment has been insufficient to absorb the growth in the workforce for that age group, resulting in a higher unemployment rate for the over 50s.

The weaker increase in the number of unemployed youth is the result of two main factors. First, the employment policies implemented since 2013 have targeted youth in particular, including the emplois d’avenir programme. Second, the weak job creation in the market sector has mainly taken the form of temporary jobs (CDD fixed-term and temporary contracts), an area in which young people are heavily represented (34.2% of young people in employment are on CDD contracts or temping, versus 8.4% for other age groups).

Finally, while seniors are unemployed less often than young people (4.6% of those aged 50-64 against 8.6% for 15-24-year-olds), they are more exposed to long-term unemployment. 62% of the seniors registered at Pole Emploi have been jobless for more than a year, against 21% of young people.

All this indicates that only a macroeconomic policy aimed at increasing the overall level of employment is capable of simultaneously dealing with unemployment among both young people and seniors. Otherwise, in a situation where employment is lacking overall, policies that are aimed at certain categories, even if effective for that specific target, may lead to adverse effects on other categories.

Graphe-post28-09_ENG


Wage moderation in Germany – at the origin of France’s economic difficulties

By Xavier Ragot, President of the OFCE, CNRS-PSE, together with Mathilde Le Moigne, ENS

If the future of the euro zone does indeed depend on political cooperation between France and Germany, then economic divergences between the two countries should be a cause for concern. These divergences need to be analysed, with particular attention to three specific areas: the unemployment rate, the trade balance and the public debt. Germany’s unemployment rate is falling steadily; in June it was under the 5% mark, which represents almost full employment, whereas the French rate is over 10%. Germany’s low unemployment rate does not however reflect strong consumption by German households, but rather the country’s export capacity. While France continues to run a negative trade balance (importing more than it exports), Germany is now the world’s leading exporter, ahead of China, with a trade surplus that will run close to 8% in 2015. As for the public deficit, it will be around 3.8% in France in 2015, while Germany is now generating a surplus. This has impressive consequences for the way the public debt is changing in the two countries. In 2010 they were similar, at around 80% of GDP, but in 2014 Germany’s public debt fell below 75%, and is continuing to decline, while France’s debt has continued to grow, and has now hit 97%. This kind of gap is unprecedented in recent times, and is fraught with mounting tension over the conduct of monetary policy.

This triple divergence is inevitably leading to differences in the political response, with respect to the population’s ability to take in migrants and to the understanding of countries facing economic difficulties, such as Greece, but also with respect to the ability to cope with future economic crises. Economic divergence will become political divergence. The point is not to idealize the German situation, which is characterized by a large number of workers who have failed to benefit from the fruits of growth, as is shown in a recent study by France Stratégie, as well as by a rapid decline in population. This should not stop us from taking a hard look at the economic gap arising between the two countries.

What are the reasons for Germany’s commercial success?

Many factors have been advanced to explain the divergence between the two neighbours: for some, it’s a matter of the German strategy – outsourcing value chains, aggressive wage moderation, fostering competition between companies – and for others, French weaknesses: poor geographical and / or sectoral specialization, insufficient public support for exporters, and a lack of competition in certain sectors. Our recent study  emphasizes the delayed impact of German wage moderation and suggests that this could explain almost half of the Franco-German divergence. To understand the mechanisms involved, it is necessary to distinguish between the sectors exposed to international competition and the sectors that are sheltered. The exposed sectors include industry, but also agriculture, including animal husbandry, which is currently in the news, and some services that can be traded. The sheltered sector includes transportation, real estate, retailing and a large part of personal services.

While unit labour costs in France have risen regularly and at similar levels in the two above-mentioned sectors, they have remained extraordinarily stable in Germany for nearly ten years. This wage moderation is the result of both poor management of German reunification, which tipped the balance of power during wage negotiations in favour of employers, and, to a much less extent, the introduction of the Hartz reforms in 2003-2005, which aimed to create low-paid work in the less competitive sectors (particularly the sheltered sector). The cost of German reunification is estimated at 900 billion euros, in terms of transfers from former West Germany, or slightly less than three times the Greek debt. Faced with this kind of challenge, the wage moderation initiated in 1993 represented a strategy for re-convergence between the two parts of Germany. In 2012, German nominal wages were 20% lower than French wages in the exposed (tradable) sector and 30% lower in the sheltered sector, compared to the 1993 levels. A look at French and German margin levels shows that in the exposed sector, French exporters have made significant efforts by reducing their margins in order to maintain their price competitiveness. In the sheltered sector, French margins are on average 6% higher than German margins. The bulk of France’s loss of price competitiveness is therefore a loss of cost competitiveness.

How much have these differences contributed to unemployment and the trade balance in the two countries? Our quantitative analysis shows that if German wage restraint had not taken place between 1993 and 2012, today’s 8% gap in the trade balances would instead be 4.7% (2.2% of this being due solely to German wage moderation in the sheltered sector). Thus, Germany’s wage moderation policy explains almost 40% of the difference in trade performance between the two countries. We also found that this wage moderation accounts for more than 2 points of France’s unemployment.

The non-price competitiveness gap

This leaves nearly 60% of the difference in the trade balances still needing to be explained. Our study suggests that this difference is due to the quality of the goods produced, so-called non-price competitiveness. Between 1993 and 2012, the German quality-price ratio increased by around 19% compared with that of France, which has therefore more than offset the rise in German export prices relative to French prices. There is clearly a “quality” effect in this non-price competitiveness: Germany produces “high end”, more innovative goods than France does in the same sectors. It is also possible to see an impact due to the outsourcing of some German production (nearly 52% of production volume in 2012) to countries where costs are lower: Germany today is a centre for design and assembly, which saves money on its intermediary costs, enabling it to invest more in brand strategies and efforts to move upscale.

This effect is nevertheless probably endogenous, that is to say, it flows in part from Germany’s advantage in cost competitiveness. Low labour costs have enabled German exporters to maintain their margins in the face of external competition. The funds generated have led to investments which French companies have probably had to forego in order to maintain their price-competitiveness, thus losing the opportunity to catch up with German products in terms of non-price competitiveness over the longer term.

A positive way out and up

The root cause of the gap in economic performance between Germany and France lies in the nominal divergence observed between the two countries since the early 1990s. One way to reduce these differences would be to promote convergence in wages in Europe and in its labour markets more generally. Germany would need to allow wage inflation that was higher than in the periphery countries, thereby dealing with the increase in social inequalities in Germany, while France must not fall into the trap of competitive deflation, which would destroy its domestic demand, while keeping wage movements under control. In this respect, the report of the five Presidents presented by the European Commission on 22 June 2015 proposes the establishment of national competitiveness authorities, which hopefully would allow greater cooperation on social welfare and employment.

The difference in wages between France and Germany has profound implications in terms of economic thought. The increased trade integration that followed the introduction of the euro led not to a convergence but to a divergence in labour markets. It is then up to each State to once again bring about convergence of the economies while supporting economic activity. This State intervention in the economy is more complex than the simple Keynesian framework for the management of aggregate demand, and now involves the convergence of labour markets. Heretofore, Europe’s response has been systematic cuts in labour costs, while what is really needed is to increase wages in surplus countries, such as Germany, for example by using the minimum wage as a tool. All this, it is true, is economics. The politics begins when we realize that only long-term cooperation can bring about a convergence in national interests.


Unemployment: a fall by temping

by Analysis and Forecasting Department (France team)

The unemployment figures for the month of July 2015 indicate a slight fall (-1900) in the number of people registering in category A. There is still too much uncertainty about monthly changes in enrolment at France’s Pôle Emploi job centre to conclude that there has been a lasting improvement in the state of the labour market. However, the increase observed since January 2015 (+50,900 registered in category A) is smaller in scale than the figures recorded for this same period during the past three years (+128,500 on average for the first seven months of the previous three years). It is comparable to the situation in 2010-2011 (+44,300 on average in the first seven months of both years), which were years of renewed growth.

Seen in the context of the first buds of recovery, this trend in unemployment is not surprising. First, the pick-up in GDP growth observed in the first six months (+0.7% according to preliminary accounts published by the INSEE) is expected to gain pace in the coming quarters. For now, this recovery has meant a rise in salaried employment of +26,600 in the competitive sector during the first six months of 2015. This has been sufficient to limit the increase in unemployment, without however reversing it, as labour force numbers have increased by about 75,000 during the half year.

Furthermore, the increase in registrations in categories B and C [1] has been more marked than for category A (+145,600 since the year’s start). This is due partly to some switching by the jobless in category A into these other categories, which reflects an increase in precarious employment that is consistent with the increase in temporary jobs in the first half year (+11,600): historically, an improvement in the labour market starts with an increase in precarious jobs (fixed term, temporary). This is also coinciding with an increase in job offers collected by Pôle Emploi, as well as with exits from the job centre due to a return to work, a figure that reflects a return to levels comparable to those observed in 2010-2011.

Graphe_Post25-08_ENG

Finally, the trends differ by age group: the number of people under age 25 registered in category A is 4,600 lower than its level at year-end 2014. In fact, the young, who are over-represented in so-called temporary jobs (34.2% of young people in work are on fixed-term CDD contracts or are temping, compared with 8.4% of those in other age groups), benefit from the creation of this type of job, and from the increase in subsidized jobs that are targeted specifically at their age group. Conversely, the enrolment in category A of people aged 50 and over is rising steadily (+36,100 since the year started). 62% of those aged 50 and older have been enrolled in the job centre for over a year, versus an average of 39% for other age groups.


[1] These categories group people who have worked on reduced hours during the month, but are still registered at Pôle emploi.


Still no halt to the rise in unemployment

OFCE Analysis and Forecasting Department

The unemployment data for the month of May once again show a rise in the number of job seekers registering at the Pôle Emploi job centre in Class A, up 16,200. Although this is certainly fewer than in April (26,200), it still leaves no glimpse on the horizon of a reversal in the unemployment curve. This continuous increase in unemployment, despite some initial shoots of recovery, is not surprising. The renewed GDP growth in the first quarter (+0.6% according to the detailed accounts published by the INSEE Thursday morning) has yet to have an impact on employment, which has stagnated. For the moment, companies are taking advantage of the pick-up in activity to absorb the excess labour they inherited from the crisis (in English see the post introducing this study). Only once the recovery has proved to be sustainable will an increase in employment translate into a reduction in unemployment. The time it takes employment to adjust to economic activity, i.e. about three quarters, does not point towards a turnaround in the labour market in the short term.

The last period of growth in France just following the 2008-2009 recession was moreover too brief to lead to a decline in the number of job seekers. With average growth of 0.7% per quarter from Q4 2009 to Q1 2011, the number of unemployed stabilized at best (Figure 1).

Since Q2 2011, growth has fallen to a very low level (0.1% per quarter), and unemployment has started rising again. However, a shift occurred in early 2013, with the monthly increase halved on average thanks to a renewal of the social treatment of unemployment through the creation of about 100,000 subsidized jobs in non-market sectors, as well as through enriching the growth in employment due to the implementation of the CICE tax credit and the Responsibility Pact.

Graphe1_post24-06ang

As growth gradually accelerates and the various measures to boost employment begin to kick in, a (slow) improvement will be seen in the second half of 2015.

The spectacular decline in exits from the Pôle Emploi agency

The 69,600 increase in the number of jobless registered with Pôle Emploi in Class A, B and C in the month of May, which is the worst figure recorded since the depths of the recession in April 2009, is surprising. The number of the unemployed broadly speaking, i.e. including unemployed people but also those working reduced hours, has been affected by unusual changes in the numbers of those exiting the job centre. About 43% of exits from the job centre are attributable to a termination of enrolment due to the non-renewal of the monthly job application for unspecified reasons, but which may be related for example to a resumption of activity, discouragement, temporary unavailability or even simply an oversight.

On average over the last five years, every month there were 200,000 terminations of enrolment due to this failure to renew. Some months, the grounds for termination can vary sharply, temporarily throwing off the unemployment statistics. For example, in August 2013, the “SFR bug” (Figure 2), i.e. a computer failure at the mobile phone operator, prevented many jobseekers from updating their status, which resulted in a sharp rise in the terminations of enrolment (+260,100). Due to the effect of a very high flow of exits from Pôle Emploi, the number of job seekers in Classes A, B and C fell by 43,800 in August 2013. The following month, as the number of terminations of enrolment returned to a level that was close to its long-term average, the unemployment figures logically rose sharply (+56,400 in September 2013), correcting for the effect of the artificial fall in the previous month.

In terms of the figures for May 2015, the phenomenon was the opposite of what happened during the SFR bug in August 2013. In fact, having noticed that the number of job seekers who updated their status following the normal reminder was significantly lower than usual, Pôle Emploi issued two additional reminders, which led to an unusually low level of terminations of enrolment (+160,600) compared with the historical trend (201,300). This mechanically increased the numbers in class A, B and C, at a rate that Pôle Emploi calculates at between 28,000 and 38,000.

But if next month the number of terminations of enrolment returns to a level close to its long-term average, this would wind up lowering the number of job seekers in class A, B and C without this reduction being the result of any change in the labour market. We must therefore insist on the need for caution in making any month-by-month interpretation of the unemployment data.

G2_Post2506ang


Investment behaviour during the crisis: a comparative analysis of the main advanced economies

By Bruno DucoudréMathieu Plane and Sébastien Villemot

This text draws on the special study, Équations d’investissement : une comparaison internationale dans la crise [Investment equations : an international comparison during the crisis], which accompanies the 2015-2016 Forecast for the euro zone and the rest of the world.

The collapse in growth following the subprime crisis in late 2008 resulted in a decline in corporate investment, the largest since World War II in the advanced economies. The stimulus packages and accommodative monetary policies implemented in 2009-2010 nevertheless managed to halt the collapse in demand, and corporate investment rebounded significantly in every country up to the end of 2011. But since 2011 investment has followed varied trajectories in the different countries, as can be seen in the differences between, on the one hand, the United States and the United Kingdom, and on the other the euro zone countries, Italy and Spain in particular. At end 2014, business investment was still 27% below its pre-crisis peak in Italy, 23% down in Spain, 7% in France and 3% in Germany. In the US and the UK, business investment was 7% and 5% higher than the pre-crisis peaks (Figure).

Our study estimates investment equations for six major countries (Germany, France, Italy, Spain, the UK and USA) in an effort to explain trends in investment over the long term, while paying particular attention to the crisis. The results show that using the traditional determinants of corporate investment – the cost of capital, the rate of profit, the rate of utilization of production capacity and business expectations – it is possible to capture the main developments in investment for each country in recent decades, including since 2008.

Thus, since the onset of the crisis, differences in decisions on taxation and on how tight to make fiscal policy and how expansive to make monetary policy have led to differences between countries in terms of the dynamics of the economy and real capital costs and profit rates, which account for the current disparities in corporate investment.

Graphe-post17-06_investENG


Is Emmanuel Macron approving a new industrial policy for France?

By Sarah Guillou

Support for industry is an economic issue that wins adherence from both Right and Left. The entire French political spectrum agrees on the importance of industry for the economy’s future. There is also a consensus among economists, who bring together a variety of sensitivities in recognizing the leading role industry plays in driving growth, mainly through exports and innovations – the manufacturing sector is responsible for over 70% of total exports and more than 75% of total R&D spending. This consensus is even international, to such an extent that, paraphrasing Robert Reich, it could be said that, “on the battlefield of national economic ambition, industry is the new boots on the ground”.

In France, everyone also agrees on deploring the decline in industrial jobs and more generally the de-industrialization that has seen industry’s share of total employment fall from 25% in 1990 to 10% in 2014. Deindustrialization, which has intensified since the 2007 crisis, crystallizes all the concerns about globalization and all the reproaches made to the French fiscal and regulatory environment.

Governments in general have been quick to support industry and have set up programmes to support innovation, SMEs and R&D spending. The research tax credit (CIR) set up in 1983 has been reinforced by government after government, and perfectly illustrates the political consensus on the matter. But since then numerous programmes to aid companies have been added, creating a tangle of schemes and local and national institutions, leading a recent OECD report to label the result relatively incoherent.

Unfortunately, it is clear that France’s economic and political consensus has not led to making its industry a global singularity in terms of performance. The country’s industrial policy has been unable to counteract the inexorable decline of industry in the face of the service sector.

But judging industrial policy in this way misconstrues its possible objectives. To understand what industrial policy involves, we need to shed our old habits.

On the one hand, opposing industry to services is outdated and is merely a statistical artefact. The services sector is poised to take over innovation and exports, but our statistics have not yet taken stock of these changes. We are still not very clear on how to measure productivity in services or how to understand the channels for innovation in this sector, which do not necessarily pass through R&D. Note, however, that among the companies that benefit from the CIR research tax credit, the number of services firms is increasing every year, reflecting their growing contribution to private R&D spending. Services are a very heterogeneous category: the “Information and communication” category, for example, is less distant from the manufacturing sector than from the real estate business. Furthermore, exports of services are still not well measured (or declared) and are not always very distinguishable from movements of capital. Veiled behind these imperfections in statistics, globalization is not sparing the services sector, which will form an increasing share of international transactions.

Still, for the moment, it is undeniable that the manufacturing sector governs R&D’s share of GDP and that the decline in France’s market share reveals the productive difficulties companies are experiencing. But we must begin now to anticipate the changes taking place in the boundaries between sectors and not become locked into a reading of economic activity that is incapable of grasping the areas where added value will be created in the future. Re-industrialization in the sense of increasing the role of manufacturing (or “a return to the age of doing”) is not necessarily the salvation of the economy of the future.

At the same time, industrial policy as such was not responsible for de-industrialization, nor is it able to counteract the decline in industrial employment.

The reasons for de-industrialization – beyond the important role played by technical progress – are to be found in the conditions governing the exercise of economic activity in France relative to the rest of the world: from the incentives to innovate to the incentives to invest, from taxation to regulation, from skills to productivity.

To put it another way, industrial policy was not the cause of the difficulties of Alstom, of AREVA or of Nokia’s takeover of Alcatel-Lucent, and even less so of the logistics merger of Norbert Dentressangle and XPO.

It should be recognized that France’s industrial policy is sometimes erroneously confused with what some call “industrial engineering”. As public companies have historically been the spearhead of industrial policy, policy had the distinctive feature of combining industrial logic with the logic of the economic and political powers, and the two were not always in synch. These inconsistencies could exacerbate the difficulties facing State-owned enterprises.

Industrial policy should content itself with boosting technological trajectories and promoting business growth. The renovation of industrial policy will involve a comprehensive approach to future technologies. The mechanisms for this will include the development of public-private partnerships and the outsourcing of operations to long-term independent administrative agencies. In this respect the political consensus needs to be extended to include the means for this in order to ensure the continuity of these agencies, so as to stabilize the institutional landscape in which business operates.

Industrial policy is the expression of technological orientations. It can be more or less interventionist and can go beyond more or less simple declarations of intent based on the budgets it is given, depending on overall budgetary constraints. It is especially critical that public funds are committed or private funds are directed so as to finance the demand placed on business. But it is necessary for this public financing to correspond to a genuine request by the State, such as the need for defence equipment to meet foreign policy or the conquest of space, or to a real decision to involve society in its use, such as green energy. Furthermore, in a democracy, the State’s request needs to have the support of society, which should be willing to finance, for example, green energy by paying more for carbon and fuel, along the lines of what has been done in Germany.

In this sense, Emmanuel Macron’s approach to industrial policy reflects a positive development. Cutting 34 future projects down to fewer than a dozen is relevant, because it helps to clarify the State’s commitments and make them more credible. In addition, the digital commitment is the transcription of a technological choice. At the moment “re-industrialization” is focused around the industries of the future, the digitization and modernization of industrial facilities. It would be more honest to dispense with the goal of “re-industrialization” since what is needed is to deal with the economy as a whole and modernize the means of production in order to make France’s productive tissue out of a new stronger fabric.

However, the stated objectives are not based on very risky technological choices and do not commit many resources: a 2.5 billion euro tax benefit for companies investing in their productive facilities over the next 12 months (the accelerated capital cost allowance – “sur-amortization” – announced a month ago) and 2.1 billion euros in additional development loans by BPI France for SMEs and ETI over the coming two years. This will thankfully not entail creating another intermediation body for the new policy. As for the role of the State shareholder, the speech was more serene vis-à-vis globalization and more encouraging with regard to European cooperation – as has been shown in the reaction to Nokia’s merger process with Alcatel Lucent. The Minister’s decisions do not however seem to be departing from a full neutrality, as can be seen in the case of the double voting shares that the State has imposed on Renault.

The overhaul of industrial policy remains modest in terms of resources and goals, but it has the merit of setting objectives for policy that it might actually be able to meet.