From the suburbs of London to global conflagration: a brief history of emissions

By Aurélien Saussay

A new interactive map of global CO2 emissions from 1750 to 2010 is helpful in understanding the historical responsibilities of the world’s different regions for the climate crisis.

The 21st Conference of Parties (COP 21) ended on 12 December 2015 with a historic agreement. As 195 countries come to an accord on the need to limit global warming to 2 degrees by the end of the century, it is a good time to review the history of CO2 emissions since the beginning of the Industrial Revolution. Right to the end of the negotiations, the question of the historical responsibility of the different countries has remained one of the main obstacles blocking the path to a global climate agreement. The recently industrialized emerging countries and the developing countries that are just beginning their economic take-off rightly refuse to provide efforts comparable to those of the developed countries.

This feeling is confirmed by a new interactive map retracing 260 years of CO2 emissions from fossil fuel combustion and cement production on the surface of the planet[1]. This map can be used interactively to explore the emissions of each country and their distribution in space over the last two centuries, both in their entirety and per capita. It can also be used to follow trends in global emissions and the gradual consumption of the total carbon budget for holding global warming to below 2 degrees.

post aurélien

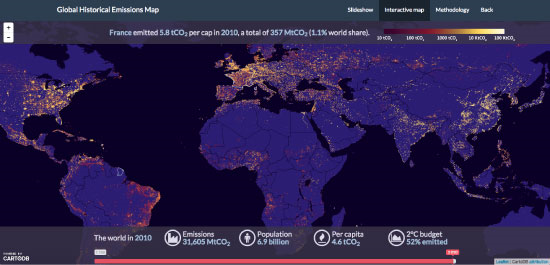
By combining historical data on emissions per country issued by the CDIAC (from 1750-2010) with decadal data on population density produced by the European HYDE project (also 1750-2010), it is possible to estimate the distribution of emissions over space and time around the planet’s surface – on a grid with a resolution of 5’ of arc (5′ being equal to 1/12th of a degree, i.e. about 10 km by 10 km at the equator).

This interactive map shows the contribution of each of the world’s regions since the mid-18th century – while at the same time offering a gripping account of the gradual spread of the industrial revolution over the last two centuries.

These data illustrate several key points that help to understand the debate about differentiated historical responsibilities:

– Up to the mid-20th century, only Europe and the United States (and to a lesser extent Japan) contributed significantly to global emissions.
– It was only in the last 30 years that, led by China, the rest of the world “turned on”.
– Driven by rapid economic growth in the emerging countries, emissions have taken off in the last fifteen years.
– When weighted by distribution of the world population, emissions are highly concentrated spatially. This conclusion is bolstered when using even finer data, notably the location of power stations and the most energy-consuming manufacturing plants (cement, aluminium, and paper, for example).

This brief history of CO2 emissions across the globe reminds us of the West’s special responsibility in the fight against global warming. The precocity of the Industrial Revolution in the West allowed the economy to take-off much earlier than in the rest of the world, but it also led to the emission of a disproportionate share of the total emissions budget that we are entitled to if we are not to exceed the target of two degrees of warming.

This differentiated historical responsibility, which was recognized by the Paris Agreement, requires Western countries to make a special effort in the fight against global warming. This responsibility must thus be reflected in a greater effort in terms of financial and technological transfers so as to ensure that the emergence of the developing countries minimizes the use of fossil fuels, without hindering their economic take-off.


[1] These emissions do not include emissions from changes in land use (LUCLUF) or fertilizer use. Unfortunately, it is very difficult to reconstruct these emissions for the period under consideration.


After the Paris Agreement – Putting an end to climate inconsistency

By Eloi Laurent

If the contents of the 32-page Paris Agreement (and the related decisions) adopted on 12 December 2015 by COP 21 had to be summarized in a single phrase, we could say that never have the ambitions been so high but the constraints so low. This is the basic trade-off in the text, and this was undoubtedly the condition for its adoption by all the world’s countries. The expectation had been that the aim in Paris was to extend to the emerging markets, starting with China and India, the binding commitments agreed in Kyoto eighteen years ago by the developed countries. What took place was exactly the opposite: under the leadership of the US government, which dominated this round of negotiations from start to finish right to the last minute (and where the EU was sorely absent), every country is now effectively out of Annex 1 of the Kyoto Protocol. They are released from any legal constraints on the nature of their commitments in the fight against climate change, which now amount to voluntary contributions that countries determine on their own and without reference to a common goal.

In doing this, the Paris Agreement gives rise to a new global variable, which we can accurately track over the coming years: the factor of inconsistency, which compares objectives and resources. At the end of COP 21, this ratio was in the range of 1.35 to 2 (the climate objective chosen, specified in Article 2, lies between 1.5 and 2 degrees, whereas the sum of national voluntary contributions declared to reach this would lead to warming of 2.7 to 3 degrees). The question facing us now is thus the following: how to deal with this climate inconsistency by bringing the resources deployed into line with the ambitions declared (bringing the climate inconsistency factor to 1)?

The answers to this question were actually set out during the two weeks of COP 21, but they did not survive the negotiations between states and therefore were not included in the final text in an operational form. They are three in number: climate justice, the carbon price and the mobilization of territories.

Climate justice, whose decisive importance was rightly highlighted in particular in the opening speech of the French President (“It is in the name of climate justice that I speak to you today”) is actually contradicted in the text of the Agreement: while the text mentions the term “justice” only a single time, it provides that the parties recognize “the importance for some of the concept of ‘climate justice’”. The whole point of climate justice is precisely that its importance is not confined to only a few nations but concerns all the world’s countries. So there is still a huge amount to be done in this field, particularly on the question of the distribution of efforts at mitigation and adaptation.

The need to put a price on carbon (and thus give it social value), which has been gaining in support, as was highlighted from the opening of COP 21 under the aegis of Angela Merkel and the new Canadian government, still appeared in the penultimate version of the text. It disappeared from the final version (under the combined pressure of Saudi Arabia and Venezuela). Yet there is no doubt that it is by internalizing the price of carbon that we will put the economy at the service of the climate transition. But it seems at this point that the world’s governments have decided to outsource this internalization function to the private sector. It is necessary to quickly take this in hand, both internally and globally.

Finally, the way the Agreement deals with the crucial role of decentralized territories, both to compensate for the shortcomings of the nation states and to be laboratories for a low-carbon economy, is too brief and too vague. The summit organized by the Mayor of Paris on December 4 nevertheless showed clearly that towns, cities and regions have become full participants in the fight against climate change, reviving the spirit of the 1992 Rio Summit. It is essential to set up as quickly as possible an organization for genuine cooperation between the territories and the nation states, in France and elsewhere, to breathe life into the Paris Agreement.

It can be seen clearly in the light of these three decisive issues, that the most severe criticism that can be levelled at an architectural agreement, which is a programme of intentions rather than an actual plan for action, is not to be progressive and dynamic enough and not to anticipate sufficiently its own shortcomings and its coming outdatedness by opening the way for new principles, new instruments and new players. Moreover, what are we to make of the fact that we have to wait until 2020 for its implementation, while the signs of climate change are visible all around us?

The easing of this time constraint may well come from the big country that proved to be the most constructive before and during COP 21: China. It was China that, five days before the conclusion of the Agreement, was the source of the best climate news since the announcement of the slowing of Amazon deforestation in the 2000s: global CO2 emissions, after almost stabilizing in 2014, should decrease slightly in 2015. This decrease is due to their reduction in China under the combined impact of the economic slowdown (the decision to end hyper-growth) and the de-carbonization of growth (related to lower consumption of coal). This is in turn due to the increasingly strong pressure being placed by the Chinese people on their government, because they have understood that the economic development of their country is destroying the human development of their children. It can thus be hoped that China will contain global emissions over the five years between now and 2020 and thereby make the Paris Agreement more acceptable… on the condition of using this to put an end to climate inconsistency.


Our house is on fire and we are only watching Paris

By Paul Malliet

As the 21st Conference of the Parties, COP21, began last week, all eyes were on Paris in the expectation of an ambitious global agreement that would limit the increase in global average temperature to 2°C and lead countries to begin swiftly to decarbonize their economies. But there is another battle taking place right now that is being ignored, even though it could have catastrophic consequences.

The primary forests and peatlands of Indonesia, located mainly on the islands of Sumatra and Kalimantan (and considered one of the Earth’s three green lungs), have been ravaged by fire for months as a result of an unexpectedly long dry season, which was in turn fueled by an extremely large-scale El Niño phenomenon[1], but also and above all by the continuation of slash and burn practices, which, though illegal, are intended to deforest the land needed to expand the cultivation of palm oil.

This led to the release of 1.62 gigatons of CO2 into the atmosphere in the space of a few weeks, tripling Indonesia’s annual emissions and pushing the country up from the planet’s 6th largest emitter to 4th, behind China, the US and India and ahead of Russia[2].  By way of comparison, this represents nearly 5% of global emissions for the year 2015.

Yet the issue of deforestation was central to Indonesia’s contribution to the global effort to reduce greenhouse gas emissions, accounting for more than 80% of the effort agreed[3] up to now. Moreover, under the UN REDD+ (Reduction Emissions from Deforestation and Forest Degradation) mechanism, launched in 2008, Indonesia has benefitted from $1 billion of international funding since 2011 precisely in order to fight against deforestation and to promote the management of sustainable forests.

However, due to the lack of a rapid and substantial response that would undoubtedly have contained the fires, this effort has literally gone up in smoke in recent months. Three reasons for this can be put forward at this stage. The first concerns the material capacities that Indonesia has for responding to disasters like this. For example, the authorities had only 14 aircraft, and relied mainly on the local population to fight the spread of forest fires by building containment basins. The second element concerns regional geopolitical issues. Indonesia has some diplomatic tension with its neighbors, and the fires raged for a number of weeks before the government agreed to accept international aid. Finally, the existence of a culture of corruption at various levels of government has led to years of deforestation, further weakening the ecosystems facing fire hazards.

Nevertheless, it is utterly clear today that discussion about the ways and means for dealing with climate disasters like this are completely missing from the discussions going on in the COP 21 process. It is more urgent than ever that the international community is capable of providing a framework that includes the capabilities for responding to these types of events, which unfortunately are likely to occur with increasing frequency, with consequences liable to profoundly affect regional relations. Strengthening funding for the fight against deforestation is of course paramount, especially since in this case the cost of avoiding a ton of CO2 is very low; but it is mainly at the level of practices that substantial progress can still be made, either by introducing greater transparency in fund management or through greater integration of local communities and NGOs in the implementation of new practices.

In his opening speech at COP 21, Francois Hollande declared that, “what is at stake with this climate conference is peace”. The conditions for peace are indeed likely to depend increasingly on societies’ capacity to adapt to climate risks. The disaster of World War II led the international community to create a body of peacekeepers with a mandate for “the maintenance or restoration of peace and international security”. How many ecological disasters will be required before we see the appearance of green helmets?


[1] According to the World Meteorological Organization (WMO), the 2015-2016 El Niño is listed as one of the three most powerful recorded since data began to be collected in 1950, and the coming decades are likely to see extreme events occur with heightened frequency as a result of climate change.

[2] World Resources Institute, With Latest Fires Crisis, Indonesia Surpasses Russia as World’s Fourth-Largest Emitter, 29 October 2015.

[3] In 2009 Indonesia undertook to reduce its greenhouse gas emissions by 29%, or even 41% (with international aid), compared to a baseline scenario (Source: National Action Plan for Greenhouse Gas Emissions Reduction (RAN-GRK)).


The end of oil and coal

By Xavier Timbeau

The idea that we must put an end to the use of oil and coal is not new. It has been pushed for a long time by NGOs like 350.org and its gofossilfree campaign. What is more striking is that the Democratic primary candidate Senator Bernie Sanders has put the proposal at the heart of the US presidential election debate. Institutional investors and large fund holders have also announced their intention to limit or terminate their investments in coal (for example, Allianz and ING) and oil (the Dutch pension fund ABP). The urban development policies of some large cities are also leaning in that direction. Asked about this option, the head of the US Environmental Protection Agency (EPA), Gina McCarthy, noted (cautiously) that this option was not irrational.

Figure: Scenarios of CO2 emissions

post-XT3

  Source: Figure SMP 11, AR5, IPCC, p. 21.

That said, Figure SPM 11 of the 5th IPCC report says much the same thing. If global warming is to be kept to 2 degrees, our carbon budget since 1870 amounts to 2900 ± 250 GtCO2e; we have consumed around 1900 GtCO2e up to now. So staying below the 2°C level (relative to pre-industrial times) with a probability of 66% leaves about 1000 GtCO2e. Given an annual flow of emissions of about 50 GtCO2e, a simple rule of three give us 40 years of linearly decreasing emissions. The inclusion of carbon sinks, climate inertia and negative radiative forcings on the climate extends the time horizon to 2090 ± 10 years, but it would be prudent to get down to zero emissions earlier. For the record, there are still about 5000 ± 1400 GtCO2 of recoverable reserves in coal alone, enough to greatly exceed our current carbon budget. Note that stopping the use of fossil fuels does not solve everything. A portion of current greenhouse gas emissions (of CO2, but also of methane and other gases) is not linked to fossil fuels but to farming, deforestation and industrial processes. In the case of a nearly 100% system of renewable energy, the gas would be necessary during consumption peaks. These non-fossil emissions can be cut down, but not eliminated. It is possible to have negative emissions, but the only “technology” available today is reforestation, which can help lower emissions by only 2 GtCO2 annually. Carbon capture and storage is also a way to conserve the use of fossil fuels provided that it works and that it has enough storage capacity (once the storage capacity is depleted, the problem remains).

The principle of “common but differentiated responsibility” would lead the developed countries to apply constraints more quickly (by say around 2050). Some see this prospect as the explanation for the fall in oil prices. Since not all fossil fuel reserves will be burned, the only ones worth anything are those that will be exploited before 2050, meaning that this price is lower than what would result from rising demand. Saudi Arabia therefore has an interest in increasing production rather than keeping worthless reserves. Mark Carney, Governor of the Bank of England and Chairman of the Financial Stability Board, has evoked “stranded reserves” in the same way that a coal plant is a “stranded asset”, i.e. a blocked asset that has to be depreciated prematurely.

The end of oil and coal is no longer just a fad of a handful of green activists. This is also seen in the persistent and nearly convergent calls of many economists about a carbon price. A high and rising price of carbon would force economic agents to disinvest in the capital that emits carbon or even to prematurely depreciate existing facilities. When a high carbon price is demanded (say between 50 and 100 € / tCO2, with the price of carbon steadily increasing over time as the carbon budget runs out), the point is that this sends a strong price signal to economic agents, with the consequence of this price being that emissions are reduced in an amount consistent with warming of less than 2°C compared to pre-industrial times. So, from this viewpoint, saying that “the price of carbon should be 50 € / tCO2 or more” is equivalent to saying “everything must be done so that we stop using coal and oil within the next half century”. The price of carbon thus gives us valuable information about the cost of the transition. It will be on the order of (a few) 1000 billion euros per year (on the scale of the global economy). Proposing a price means proposing the “polluter pays” principle (carbon emitters must pay), even though it is not clear exactly whom the polluters must pay. Hence the debate on the Green Fund and climate justice that is at the centre of COP21.

It would be a shame to focus on the carbon price and make it the central issue of COP21. A zero-carbon economy is our future, and we will have no excuses if we continue to burn fossil fuels. As Oscar Wilde remarked: “Nowadays people know the price of everything and the value of nothing.”


European Semester: assessing the aggregate fiscal stance is good, discussing about its economic impact is better

by Raul Sampognaro

On November the 26th, the ECFIN launched the European Semester and published the 2016 Annual Growth Survey and the Euro Area policy recommendation. The ECFIN states that the large spillovers from fiscal policy decisions and the current constraints on the single monetary policy call for strengthened attention to the aggregate fiscal stance at the euro area level. The recommended aggregate fiscal stance should take into account the cyclical position of the euro area. Moreover, a broadly neutral aggregate fiscal stance for the next years in the euro area appears appropriate to ECFIN in light of downside risks to growth and the persistent economic slack.

Opening the debate about the aggregate fiscal stance constitutes an important step in the improvement of the macroeconomic policy framework in the EA. In fact, the crisis that Euro zone has been facing since 2012 can be explained to a large extent by the fragilities in the monetary union. The lack of economic policy coordination emerged as one of the most important weaknesses. Before the crisis, the ECB was left alone to deal with common shocks while the fiscal policy was supposed to manage asymmetric shocks. Furthermore, the fiscal policy was supposed to safeguard public debt sustainability. This double objective was supposed to be assured by the compliance with the Stability and Growth Pact (SGP) rules. This framework failed during the crisis. First, the rules of the SGP were focused only on public debt sustainability and neglected the impact of fiscal policy on macroeconomic stabilization. Second, the decentralization of the procedures resulted in a bad aggregate outcome. The asymmetry in the rules implies ill-calibrated adjustments in deficit countries while anything forces countries with fiscal space to implement growth supportive policies.

In order to assess about the global orientation of fiscal policy the weighted sum of changes in structural balances is the traditional indicator used in the European Semester. This figure evaluates the evolution of deficits in the long run, once the cyclical effects are purged. This figure depends crucially on the way structural deficits are calculated and hence on the assumptions about the potential output used: even under common budgetary assumptions, the evolution of structural balance can evolve in different ways (see lines 2 and 3 of the table 1, which are computed using the same assumptions in terms of fiscal policy). On the basis of this indicator, the aggregate fiscal stance in the euro area is neutral or slightly expansionary in 2015 and 2016. This assessment is shared by the 2016 independent Annual Growth Survey (iAGS).  On the basis of the announcements of the Member States in their Stability Programmes, the iAGS team forecast that the fiscal consolidation will start again in 2017. This result differs with ECFIN forecasts, based on a no-policy change scenario that only takes into account the measures already implemented.

tab1_0412 (2)

If the change of the structural balance shows that fiscal policy is broadly neutral in the euro area as a whole, the assessment of its economic impact needs to be completed. In the 2016 independent Annual Growth Report, we propose a new way to compute the aggregate fiscal stance that takes into account the most recent advances in the literature. According to several authors the multipliers of public expenses – which are decreasing in most of the bigger euro area economies– are higher than those associated with tax changes –which are decreasing and should have an expansionary impact. This is particularly true when output gaps are negative. Hence, the proposed indicator of the aggregate fiscal stance proposed is based on a weight that takes into account the macroeconomic impact of fiscal policy.

When the composition and the localisation of the fiscal impulses are taken into account, the assessment of the aggregate fiscal stance is modified. According to our calculation, fiscal policy will be slightly contractionary in 2016 (-0.1 point of GDP, table 2) in spite of the decrease in the aggregate structural balance. This paradox can be explained by the localisation of the impulsion, which has low impact in Germany and the composition of the expansion in Italy and in Spain (based on large tax cuts with a low multiplier partially compensated by an effort in expenses with a high multiplier).

tab2_0412 (2)

The apparent paradox of a fiscal loosening with recessionary effects raises the matter of the fiscal space –expansionary policies should be larger in unconstrained countries– and the flexibilities in the application of SGP –expansion should be done in countries with high multipliers. Analyzing the situation of each Member State vis-à-vis the SGP, it appears that very few countries have fiscal space with respect to the rules of the SGP. According to the ECFIN analysis of Draft Budgetary Plans, only Germany would have some fiscal space but the efficiency of a timid German based stimulus would be limited, at least from a GDP point of view. This raises new questions and particularly about the creation of a common fiscal capacity that would enable implementation of a counter-cyclical budgetary policy, especially when there is no scope for monetary policy like a situation of liquidity trap and deflation. This is the rational of the Juncker Plan that aims to increase investment in the euro zone. However, the plan relies on unrealistic leverage assumptions and the selection of investment projects, based on the profitability of the project, may lead to a pro-cyclical bias. This plan may not be sufficient to generate the demand shock needed to escape from the Zero Lower Bound, suggesting that a permanent is needed.Taking into account the very high levels of unemployment and underemployment, even the highest value of the fiscal impulse (+0.1% GDP) is far too low to deliver significant stimulus. A coordinated increase of public investment with a focus on the Europe 2020 targets would be a proper policy change for a more balanced economic policy. With the implementation of the golden rule of public investment, such a stimulus could be achieved in line with the European fiscal rules.


What would be the risks of extending QE?

By Christophe BlotPaul Hubert and Fabien Labondance

Following the last meeting of the ECB Governing Council on 22 October, Mario Draghi said that on Thursday, December 3rd, the Bank would review the orientation of its monetary policy in the light of economic and financial developments and the new Eurosystem staff forecasts, which will be disclosed at that time. The main issue facing the meeting is whether the ECB will take new steps to support activity. It could for instance announce further cuts in the deposit facility rate or an extension of quantitative easing (QE). Up to now the ECB has been careful to show its determination to meet its primary objective of price stability, even though in return it is encountering criticism that these waves of monetary expansion have had little effect on inflation but are fuelling asset price bubbles.

With inflation at 0.1% in October, the ECB is far from meeting its goal of achieving inflation rates below but close to 2% over the medium term. While the low level of euro zone inflation is due in part to lower oil prices, the fact remains that, even when adjusted for energy and food components, so-called “headline inflation” has not exceeded 1% since September 2013, reflecting a persistent state of low inflation. Note that the figure for October is the last observed value of inflation and provides only imperfect information about how it is changing in the medium term. The central banks are thus particularly sensitive to changes in inflation expectations. Market indicators however point to a further decline in long-term inflation expectations, whereas these rose in January after the announcement of QE (see graphic). So while there has been only very gradual confirmation of a recovery in the euro zone, the fear of deflation has not abated, which should push the ECB to strengthen its support. In a previous analysis, which was based on quantitative easing programmes undertaken by the US Federal Reserve and the Bank of England, we emphasized the positive effects that QE was expected to have in the euro zone. The trends in euro exchange rates seen after the ECB’s announcements in January 2015 and at the October meeting suggest that there is an impact via exchange rate channels.

Beyond these channels is the question of how QE affects asset prices. Several studies show that an expansionary monetary policy based on asset purchases supports financing and results in higher asset prices. However, some observers are also concerned about the risks associated with these operations, arguing that they feed asset price bubbles, that is to say, increases in prices that are not justified by economic fundamentals. Nevertheless, this kind of analysis relies solely on the rise in share prices to support these arguments. In a recently published study (Revue de l’OFCE, issue 144, November 2015, in French), we focus on the effects of monetary policy on three asset prices in the euro zone: the markets for equities, bonds and property. Our analysis suggests that monetary policy decisions would have no impact on asset prices that is not due to fundamentals. Thus, an interest rate cut does not seem to fuel bubbles, just as a tightening of monetary policy does not lead to a decline beyond what is indicated by the usual determinants of asset prices. While the channel of asset prices [1] does seem to be at work, monetary policy has no additional effects on the component of asset prices beyond what is due to economic fundamentals.

GraphEng_0112


[1]  This channel may be divided in two: Tobin’s Q channel and the channel of wealth effects. The first suggests that a reduction in interest rates is likely to have a favourable impact on share prices, since share prices correspond to the present value of future dividends. An increase like this in share prices lowers the cost of capital for businesses, and supports their investments (like traditional capital, but via a different mechanism, as higher share prices make share issues more attractive). The second suggests that household consumption may also benefit from lower interest rates: the increase in the prices of financial or property assets resulting from lower interest rates increases their total value and promotes consumption. In a model where households seek to smooth consumption over the life cycle, they spend more when their wealth rises.


A standard contract for France: a potluck approach?

By Jacques Barthélémy and Gilbert Cette

The debate over a single standard contract [contrat unique] generally arises in relation to the duality of the labour market, with on the one hand employees who are highly protected, such as civil servants and permanent employees (“CDI” contracts), and on the other hand workers shifting between periods of unemployment and poorly protected precarious jobs (fixed-term “CDD” and temporary contracts). This contrast reflects gross inequalities, and has important social and economic consequences.

To deal with this dual labour market, proposals are often made for a “single contract” that would reduce the differences in status and rights between precarious and permanent contracts. But the concept of a “single contract” is often poorly defined. If we closely examine the major differences that exist in the content of the various proposals, it even begins to look like a potluck approach!

The three stated objectives of the proposal for a single contract are: (1) to reduce inequalities in status arising from the coexistence of so-called “precarious” contracts (fixed-term and temporary contracts) and permanent contracts; (2) to reduce the complexity and the costly uncertainties surrounding the legal treatment of redundancies; and (3) to partially internalize the social costs of redundancies. In an article in the Revue de l’OFCE, we show that a single contract cannot really meet these objectives, which would be better served by other means, and that it would give rise to major legal risks.

For more information, see: J. Barthélémy and G. Cette, 2015, « Le contrat unique: une auberge espagnole », Revue de l’OFCE no.146.


Should we be worried about the slowdown in China?

By Eric Heyer

China’s growth is slowing. This does not really come as a surprise: the slowdown was announced by the Chinese authorities; it can be seen in the national accounts; and it was predicted in all the medium-term scenarios of the major international organizations. It corresponds to a new phase in China’s economic and social development, towards growth that the authorities want to be more “qualitative, inclusive and innovative”.

However, many analysts and experts believe that the Chinese economy has slowed down more than is reflected in the country’s national accounts. According to a survey conducted in 2015 by Bank of America Merrill Lynch, 75% of investors are convinced that the real growth rate of the Chinese economy was less than 6% in the second quarter of 2015 on an annualized basis. For some, the overestimation of growth is due to an underestimation of inflation, particularly in the service sector. For others, China’s GDP growth rate needs to be correlated with the rate for electricity generation and be in line with freight by road, rail, sea or air. However, all these values have experienced ​​a significant decline since the start of 2014, and the stable relationship between GDP and these elements tends to indicate lower annual growth for the Chinese economy, of around 2% in early 2015 according to Artus, which is more in line with the observed fall in imports. This steeper slowdown would have a violent impact on the global economy, endangering the shoots of recovery in the developed economies.

In a recent article, we estimated the link between Chinese GDP and different economic variables not taken from the national accounts, using an error correction model (ECM) to evaluate the slowdown, before giving an evaluation of its impact on the GDP of the major developed countries.

Just how much is the Chinese economy slowing down?

Drawing on the Li Keqiang index, we estimated China’s GDP from variables for freight and the production of electricity and cement. While our results confirm that the Chinese economy has been slowing down since 2011, from a yoy rate of 12% to less than 8% in early 2013, the stabilization of the growth rate observed since then in the national accounts is not re-traced in this simulation, which indicates instead a continued slowdown in Chinese growth (Figure 1, equation 1).

However, this modelling of GDP does not take into account the major transformation of the Chinese economic model towards a new growth model, which began three years ago and which involves high indebtedness of domestic agents and an orientation towards more services. An enhanced analysis of variables that also draw on the labour market situation (wages, jobs) confirms the slowdown in the Chinese economy as traced by the national accounts, reflecting the difficulty of the transition between the two growth models, and not the beginnings of a slide into recession (Figure 1, equation 2). On the other hand, the country’s “industrial” part should continue to decelerate, thwarting any significant rebound in Chinese imports.

ENGgraph_chine1711

What impact will the slowdown have on the developed countries?

Three channels for the transmission of the slowdown of the Chinese economy to the developed countries can be identified:

  1. Direct and indirect effects via the trade channel: Given China’s weight in world trade, the sharp slowdown in its output, particularly in industry, is significantly reducing the country’s imports (through intermediate consumption and household consumption) and is consequently cutting demand for the rest of the world’s goods. To this direct effect can be added an indirect effect due to the slowdown in partner countries affected by the reduced demand;
  2. Effects via the financial channel: The Chinese slowdown may hit direct investment in the developed countries; conversely, the withdrawal of capital from China might be an occasion for reallocating it to other developed countries;
  3. Effects via the channel of raw materials prices: As China buys more than half of all metals traded in the world and accounts for two-thirds of the increase in global oil consumption, the slowdown of its economy is hurting the prices of raw materials, especially oil, thereby causing a transfer of income from the countries producing commodities to the countries consuming them.

Looking only at the first transmission channel, trade, our results are as follows: Japan and Germany are the countries most affected by the slowdown in China. The cumulative impact from 2014 to 2017 will amount to more than 2 percentage points of GDP. The impact on Japan is due to its significant exposure to Chinese trade (3% of exports to China compared with 2.4% for Germany), whereas the impact on the German economy is due more to its degree of openness (39.1% against 14.6% for Japan). Next come the United Kingdom, Italy and France, with a cumulative impact of close to 1 GDP point. Spain and the United States are least affected, with a cumulative impact of around 0.5 GDP point: the United States has a low exposure (0.7%) and a low degree of openness (8.2%). Finally, the annual peak for the impact of China’s slowdown would hit in 2015, and knock 0.8 GDP point off the German economy and 0.9 GDP point off the Japanese economy.

ENGTab_EH_0911


The potential headache of measuring economies in public expenditure

By Raul Sampognaro

Since 2009, the French budget deficit has been cut by 3.3 GDP points, from 7.2 percent of GDP in 2009 to 3.9 points in 2014, even though the economic situation has been weighing heavily on the public purse. This improvement was due to the implementation of a tighter budget policy. Between 2010 and 2013, most of the consolidation effort came from higher taxes, but since 2014 the effort has largely involved savings in public expenditure. In 2014, public expenditure excluding tax credits[1]  recorded its weakest growth since 1959, the year when INSEE began to publish the national accounts: in value, spending excluding tax credits increased by 0.9%, though only 0.3% in volume terms (deflated by the GDP deflator).

At first glance it may seem counter-intuitive to talk about savings on spending even though the latter has been rising constantly. This rise is, however, well below potential growth, which reflects a real long-term effort to reduce the ratio of spending to GDP. Indeed, the formula usually used to calculate the effort on spending depends on the hypothesis adopted on potential growth:

To understand why the extent of the effort on public expenditure is dependent on potential growth, one must understand the underlying concept of the sustainability of the debt. There is a consensus on the theoretical definition of the sustainability of the public debt: it is sustainable if the current stock of debt could be repaid by the anticipated future stream of the State’s net revenues[2]. While the concept is clear, its practical application is more difficult. In practice, fiscal policy is deemed sustainable when it makes it possible to stabilize the ratio of public debt to GDP at a level deemed consistent with maintaining refinancing by the market.

Thus, changes in spending that are in line with that goal should make it possible to stabilize the share of public expenditure to GDP over the long term. However, as public spending essentially responds to social needs that are independent of the economic situation (apart from certain social benefits such as unemployment insurance), stabilizing its share in GDP at any given time (which would imply it changes in line with GDP) is neither assured nor desirable. In order to deal with this, changes in the value of public expenditure are compared to the nominal growth rate of potential GDP[3] (which depends on the potential growth rate and the annual change in the GDP deflator).

An increase in expenditure that is above (respectively below) the potential reflects a positive (negative) impulse, because in the long run it leads to an increase (decrease) in the ratio of public spending to GDP. While the application of this concept may seem easy, potential growth is unobservable and uncertain because it is highly dependent on the assumptions made about demographic variables and future changes in productivity. In the 2016 Budget Bill (PLF), the government revised its potential growth assumptions for the years 2016 and 2017 upwards (to 1.5% instead of 1.3% as adopted at the time of the vote on the LPFP supplementary budget bill in December 2014).

This revision was justified on the basis of taking into account the structural reforms underway, in particular during the vote on the Macron Act. This was the second revision of potential since April 2014 when it was estimated at 1.6% (2014-2017 Stability Programme). The government is not the only one to repeatedly revise its assessments of potential growth. When the European Commission published its latest projections[4], it revised its assessment of potential growth even though its previous assessment had been issued only in May[5]. It is not easy to see what new information could change its assessment now. These recurring revisions generally complicate the economic debate[6]  and cloud discussion of the budget.

Hence using identical sets of hypotheses about the public finances, a measurement of savings on spending, and thus of the structural adjustment, would depend on the potential growth adopted (Table). Assuming a value for the growth in public spending (excluding tax credits) of +1.3% in 2016 and in 2017, the scale of the effort on spending was evaluated at 0.7 GDP point in October 2015 (using the hypotheses in the 2016 PLF) but 0.6 point in December 2014 (2014-2019 LPFP).

tabpost0911ang

While the differences identified above may seem small, they can have significant consequences on the implementation of fiscal rules, which can lead the various players to act on their assumptions in order to change the effort shown [7]. Even though this notion should guide the vision of the future trajectory of Europe’s economies, the debate winds up being hijacked. Recurrent revisions in potential growth focus discussion on the more technical aspects, even though the method of estimating potential growth is uncertain by definition and there is not even a consensus among economists. Thus, the European Semester, which should set the framework for discussion and coordination between Member States in determining the economic policy that best suits the macroeconomic context, for France and for the euro zone as a whole, gets lost amidst technical discussions that are of no particular interest.


[1] Reimbursable tax credits – essentially the CICE and the CIR credits – are recognized in public expenditure on the basis of the 2010 national accounts. In order to remain closely in line with economic concepts, public spending will be analyzed excluding tax credits, which will be considered as a component of taxation.

[2] This definition is accepted both by the academic literature (see for example, D’Erasmo P., Mendoza E. and Zhang J., 2015, “What is a Sustainable Public Debt?”, NBER WP, no 21574, September 2015, and by international organizations (see IMF, 2012, “Assessing Sustainability”).

[3] It can also be compared to an underlying trend in public expenditure which itself takes into account the changing needs to which spending responds.

[4] The European Commission expects France to grow by 1.1% in 2015, 1.4% in 2016 and 1.7% in 2017.

[5] The evaluation has changed to the second decimal.

[6] For this debate, see H. Sterdyniak, 2015, “Faut-il encore utiliser le concept de croissance potentielle?” [Should the concept of potential growth still be used?], Revue de l’OFCE, no. 142, October 2015.

[7] The revisions of potential growth may have an impact on the implementation of procedures. These revisions cannot give rise to penalties. At the sanctions stage, the European Commission’s hypothesis on potential growth, made at the recommendation of the Council, is used in the discussion. However, it is likely that a difference of opinion on an unobservable variable could generate friction in the process, reducing the likelihood of sanctions and making the rules less credible.


The euro zone in crisis: challenges for monetary and fiscal policies

By Catherine Mathieu and Henri Sterdyniak

The 9th EUROFRAME conference [1] was held on 8 June 2012 in Kiel on issues concerning the economic policy of the European Union. The topic was: “The euro zone in crisis: challenges for monetary and fiscal policies”. The conference was, of course, dominated by the issue of the sovereign debt crisis in the euro zone. How did it come to this? Should the blame be put on mistakes in national economic policies? Must the way the euro zone is organized be changed?

A number of fault lines appeared (cf. also the related Note in French):

  • Some believe that it is irresponsible domestic policies that are the cause of the imbalances: the southern countries were allowed to develop real estate and wage bubbles, while the northern countries carried out virtuous policies of wage moderation and structural reform. The southern countries must adopt the strategy of the northern countries and accept a prolonged dose of austerity. For others, the single currency has allowed the development of mirror opposite imbalances: too much austerity in the North, and too many wage increases in the South; what is needed is a convergence where stimulus in the North facilitates the absorption of the external imbalances in the South.
  • For some, every country must implement policies that combine fiscal consolidation and structural reform. For others, what is needed is an EU-wide growth strategy (in particular by financing an ecological transition) and a guarantee of public debt so as to promote a convergence of national interest rates at lower levels.
  • Some believe that any new solidarity measures involve developing a Union budget, which means the inclusion of binding rules in the Fiscal Compact; for others, what is needed is the open coordination of economic policies, without pre-established standards.

We provide a report that includes brief comments [2] in a lengthy Note.


[1] EUROFRAME is a network of European economic institutes that includes: DIW and IFW (Germany), WIFO (Austria), ETLA (Finland), OFCE (France), ESRI (Ireland), PROMETEIA (Italy), CPB (Netherlands), CASE (Poland), NIESR (United Kingdom).

[2] Most of the articles are available at: http://www.euroframe.org/index.php?id=7. Selected articles will be published in an issue of the Revue de l’OFCE, in the “Débats et Politiques” collection, at the end of 2012. The report reflects the views of the authors alone.