The ECB is still worried about the weakness of inflation

By Christophe Blot, Jérôme Creel and Paul Hubert

The President of the European Central Bank, Mario Draghi, recently announced that the increase in the ECB’s key interest rate would come “well past” the end of the massive purchases of bonds (scheduled for September 2018), mainly issued by the euro zone countries, and at a “measured pace”. The increase in the key rate could therefore occur in mid-2019, a few weeks before the transfer of power between Mario Draghi and his successor.

In his quarterly hearing with MEPs, Mario Draghi proved to be cautious about the intensity and sustainability of the economic recovery [1]. Listening to him, the euro zone has not necessarily closed its output gap (actual GDP would have remained below its potential) despite the recovery in recent quarters. This is not the time to change the direction of monetary policy at the risk of weakening the recovery. It is also undeniable that the effects of the recovery are only materializing slowly and gradually in wage increases, which partly explains why the euro zone inflation rate remains below its mid-term target.

The ECB President has also been confident that companies are gradually anchoring their price (and wage) expectations on the ECB’s inflation target of 2% per year. Mario Draghi also appeared very confident in the effectiveness of monetary policy. He announced that the measures undertaken since 2014 would contribute to a (cumulative) increase of 2 percentage points, respectively in real growth and inflation between 2016 and 2019.

If the ECB’s forecast of inflation back to its target in 2019 is contradicted by Hasenzagl et al. (2018), we find these same determinants of European inflation. In a recent study, we also show that the two main determinants of inflation in the euro area are inflation expectations and wage growth. Without anchoring the former on the medium-term target of the ECB and without a second-round effect of monetary policy on wages, inflation will not return to its target in the short term. Structural reforms may have increased potential GDP, as argued by Mario Draghi, but they have so far more certainly weighed on wage and price developments.


[1] Once a quarter, a monetary dialogue is organized between the President of the ECB and the members of the Monetary Affairs Committee of the European Parliament. This dialogue allows the President of the ECB to explain the direction of monetary policy in the euro area and to express his point of view on topics defined upstream. Une fois par trimestre un dialogue monétaire est organisé entre le Président de la BCE et les membres de la Commission des Affaires monétaires du Parlement européen. Ce dialogue permet au Président de la BCE d’expliquer l’orientation de la politique monétaire dans la zone euro et d’exprimer son point de vue sur des sujets définis en amont.


Missing deflation – unique to America?

By Paul Hubert, Mathilde Le Moigne

Was the way inflation unfolded after the 2007-2009 crisis atypical? According to Paul Krugman: “If inflation [note: in the United States] had responded to the Great Recession and aftermath in the same way it did in previous big slumps, we would be deep in deflation by now; we aren’t.” Indeed, after 2009, inflation in the United States remained surprisingly stable given actual economic developments. Has this phenomenon, which has been described as “missing deflation”, been observed in the euro zone?

Despite the deepest recession since the 1929 crisis, the inflation rate remained stable at around 1.5% on average between 2008 and 2011 in the United States, and 1% in the euro zone. Does this mean that the Phillips curve, which links inflation to real activity, has lost its empirical validity? In a note in 2016, Olivier Blanchard recalls on the contrary that the Phillips curve, in its simplest original version, remains a valid instrument for understanding the links between inflation and unemployment, despite this “missing disinflation”. Blanchard notes, however, that the link between the two variables has weakened because inflation is increasingly dependent on expectations of inflation, which are themselves anchored in the US Federal Reserve’s inflation target. In their 2015 article, Coibion ​​and Gorodnichenko explain the missing deflation in the United States by the fact that inflation expectations tend to be influenced by the most visible price changes, such as changes in the price of a barrel of oil. Since 2015, we have seen a drop in inflation expectations concomitant with the decline in oil prices.

The difficulty in accounting for recent changes in inflation by using the Phillips curve led us in a recent article to evaluate its potential determinants and to consider whether the euro zone has also experienced a phenomenon of “missing deflation”. Based on a standard Phillips curve, we did not find the conclusions of Coibion and Gorodnichenko when we consider the euro zone as a whole. In other words, real activity and inflation expectations give a good description of the way inflation is behaving.

This result seems to come, however, from a bias in aggregation between national inflation behaviours in the euro zone. In particular, we find a notable divergence between the countries of northern Europe (Germany, France), which show a general tendency towards missing inflation, and the more peripheral countries (Spain, Italy, Greece), which are exhibiting periods of missing deflation. This divergence nevertheless shows up from the beginning of our sample, that is to say, in the first years when the euro zone was created, and seems to be absorbed from 2006, without undergoing any notable change during the 2008-2009 crisis.

In contrast to what happened in the United States, it seems that the euro zone did not experience missing deflation as a result of the 2008-2009 economic and financial crisis. On the contrary, it seems that divergences in inflation in Europe predate the crisis and tended to be absorbed by the crisis.


What role for central bank balance sheets in the conduct of monetary policy?

By Christophe BlotJérôme Creel and Paul Hubert

By adjusting the size and composition of their balance sheets, the central banks have profoundly changed their monetary policy strategy. Although the implementation of these measures was initially envisaged for a period of crisis, questions are now arising about the use of the balance sheet as an instrument of monetary policy outside periods of crisis.

The central banks’ securities purchase policy has resulted in significantly expanding the size of their balance sheets. In September 2017, the balance sheets of the Federal Reserve and the European Central Bank amounted, respectively, to nearly 4,500 billion dollars (23.3% of US GDP) and 4,300 billion euros (38.5% of euro zone GDP), while in June 2007 they were 870 billion dollars (or 6.0% of GDP) and 1,190 billion euros (12.7% of GDP). The end of the financial crisis and the economic crisis calls for a gradual tightening of monetary policy, which is already underway in the United States and forthcoming in the euro zone. The Federal Reserve, for instance, has raised the key interest rate five times since December 2015, and in October 2017 it began to reduce the size of its balance sheet. However, no precise indication has been given as to the size of the bank’s balance sheet once the process of normalization has been completed. Beyond simply size, there is also the question of the role that these balance sheet policies will play in the conduct of monetary policy in the future.

Initially, the measures taken during the crisis had to be exceptional and temporary. The aim was to satisfy a need for substantial liquidity and to act directly on the prices of certain assets or on the long end of the yield curve at a time when the standard monetary policy instrument – short-term interest rates – was constrained by the zero lower bound (ZLB). The use of these measures over a prolonged period – the last ten years – suggests, however, that the central banks could continue to use their balance sheets as a tool of monetary policy and financial stability, including in so-called “normal” periods, that is to say, even when there is enough maneuvering room to lower the key rate. Not only have these unconventional measures demonstrated some effectiveness, but their transmission mechanisms do not seem to be specific to periods of crisis. Their use could thus both enhance the effectiveness of monetary policy and improve the central banks’ ability to achieve their macroeconomic and financial stability objectives. We develop these arguments in a recent publication that we summarize here.

In an article presented at the 2016 Jackson Hole conference, Greenwood, Hanson and Stein suggested that the central banks could use their balance sheets to provide liquidity to meet a growing need in the financial system for liquid, risk-free assets. The extra reserves thus issued would increase the stock of safe assets that could be drawn on by commercial banks, enhancing financial stability. The central banks could also intervene more regularly in the markets to influence the price of certain assets or risk premiums or term premiums. What is involved here is not necessarily a matter of increasing or reducing the size of the balance sheet, but of modulating its composition in order to correct any distortions or to strengthen the transmission of monetary policy by intervening in all segments of the rate curve. During the sovereign debt crisis, the ECB launched a Securities Market Programme (SMP) aimed at reducing the risk premiums on the yields of several countries (Greece, Portugal, Ireland, Spain and Italy) and at improving the transmission of the common monetary policy to these countries. In 2005, the Chairman of the Federal Reserve encountered an enigma on the bond markets when noting that long-term rates did not seem to be responding to the ongoing tightening of US monetary policy. The use of targeted purchases of securities with longer maturities would no doubt have improved the transmission of the monetary policy, as was being sought at that time by the Federal Reserve.

In practice, the implementation of a strategy like this in “normal” times raises several issues. First, if the balance sheet policy complements the interest rate policy, the central banks will have to accompany their decisions with the appropriate communications, specifying both the overall direction of monetary policy and the reasons justifying the use and the goal of such a policy. It seems that they managed to do this during the crisis, even as the number of programmes proliferated; there is therefore no reason to think that suddenly communications like this would become more difficult to implement in a “normal” period. Furthermore, using the balance sheet as a monetary policy instrument more frequently would result in holding more, and potentially riskier, assets. In these circumstances, there would be a trade-off between the efficacy that could be expected from monetary policy and the risks being taken by the central bank. It should also be noted that using the balance sheet does not necessarily mean that its size would be constantly growing. Central banks could just as easily choose to sell certain assets whose price was deemed to be too high. However, in order to be able to effectively modulate the composition of the central bank’s assets, its balance sheet must be large enough to facilitate its portfolio operations.

It should be recognized that economists have not yet fully analyzed the potential effects of balance sheet policies on macroeconomic and financial stability. But the remaining uncertainty should not prevent the central banks from making use of balance sheet policies, as only experience can lead to a comprehensive assessment of the power of balance sheet policies. The history of the central banks is a reminder that the objectives and instruments used by central banks have changed steadily [1]. A new paradigm shift thus seems possible. If balance sheet policies are able to enhance the effectiveness of monetary policy and improve financial stability, central banks should seriously consider their use.

For more, see: Christophe Blot, Jérôme Creel, Paul Hubert, “What should the ECB ‘new normal’ look like?”OFCE policy brief 29, 20 December.

[1] See Goodhart (2010).


Does the impact of economic policy depend on what we know?

By Paul Hubert and Giovanni Ricco

Do the effects of monetary policy depend on the information available to consumers and business? In this note we analyze how the way in which the central bank surprises economic actors affects the impact of its policy and the extent to which the central bank’s publication of its private information modifies the effects of its policy.

In an economy that had perfect information and where the expectations of private agents were rational, monetary policy announcements would have no real effect (on activity) unless they constitute “surprises”, that is, unanticipated decisions. To the extent that private agents know the economic reasons behind monetary policy decisions, a surprise in monetary policy thus corresponds to a temporary change in the preferences of the central bankers.

However, in the presence of informational friction, and especially when the information sets of the central bank and of private agents differ, the private agents do not know the central bank’s information and therefore do not know what the central bankers are responding to. When agents are surprised by a monetary policy decision, they cannot determine whether this surprise comes from a re-evaluation of the central bank’s macroeconomic information or from a change in the central bankers’ preferences. So for private agents, a monetary policy decision can reflect either their response to a preference shock or their response to macroeconomic information that has just been revealed to them. For example, an increase in the central bank’s key rate may signal to private agents that an inflationary shock will affect the economy in the future, pushing up private expectations of inflation. However, the same increase in the central bank’s key rate could be interpreted as a preference shock indicating that the central bankers want to tighten up, which would reduce private expectations of inflation. More generally, whenever the central bank and private agents have different sets of information, a monetary policy decision could convey information from the central bank about future macroeconomic developments.[1]

The way private agents interpret monetary policy surprises is therefore crucial in determining the sign and the magnitude of the impact of monetary policy. Based on this intuition, a recent work by G. Ricco and S. Miranda-Agrippino proposes a new approach to studying the effects of monetary policy shocks that takes into account the problem that agents face in understanding central bank decisions. Despite years of research, there is still considerable uncertainty about the effects of monetary policy decisions. In particular, several works have shown that, counterintuitively, an increase in output or prices follows monetary tightening –a phenomenon that is also called the price puzzle.

In this work the authors show that to a large extent the results in the existing literature lack robustness due to the implicit assumption that the central bank or private agents have perfect information about the state of the economy. It turns out that it is the central bank’s transmission of information about economic conditions to private agents that could be generating the price puzzle highlighted in the literature.

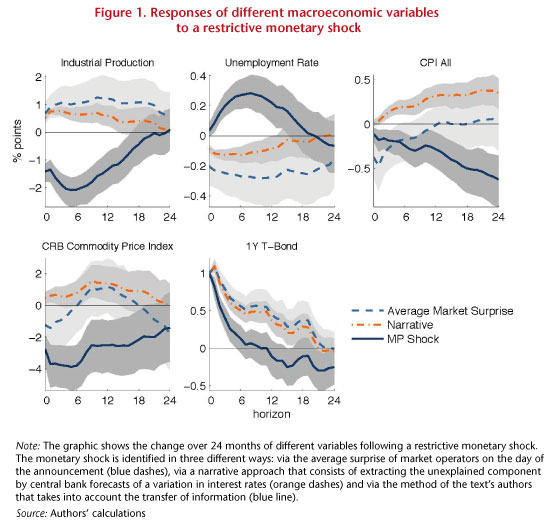
In the United States, it is five years afterwards that the central bank discloses the forecasts by its economists (the Greenbook forecasts) which have been used to inform its monetary policy decisions. This allows us to separate ex post the reactions of the financial markets to the new information on the state of the economy transmitted by the action of the central bank from reactions to monetary policy shocks. We use these responses to study the effects of monetary policy on the US economy in an econometric model that is flexible and robust to poor specifications.

In Figure 1, we compare our approach with methods that do not take into account the transmission of information between the central bank and private agents. While these methods generate the price puzzle, with our approach we find that a monetary tightening reduces both prices and output.

IMG1_post21-09_ENG

On the basis of these results, and in order to study whether private agents’ interpretation of monetary policy surprises depends on the information available to them, another recent working paper assesses whether the publication by the central bank of its macroeconomic forecasts could affect the way that private agents understand monetary policy surprises and thus ultimately influence the impact of the monetary policy decision.

More specifically, this paper assesses whether and how the interest rate term structure of inflation expectations responds differently to Bank of England (BoE) decisions when they are accompanied or not by the publication of the BoE’s macroeconomic forecasts (of inflation and growth) and when these are corroborated or contradicted by its forecasts.[2]

IMG2_post21-09_ENG

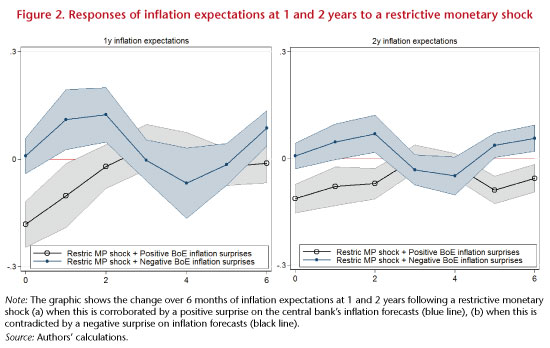
It can be seen that, on average, private inflation expectations respond negatively to restrictive monetary shocks, as expected given the mechanisms for transmitting monetary policy. The main result of Figure 2, however, is that the central bank’s inflation forecasts change the impact of monetary shocks. Monetary shocks (in the example here, restrictive) have a greater negative impact when they interact with a positive surprise on the central bank’s inflation forecasts. On the other hand, a restrictive monetary shock that interacts with a negative surprise on inflation projections has no effect on private inflation expectations.

This observation suggests that, when monetary shocks and forecast surprises corroborate one another, monetary shocks have a greater impact on private inflation expectations, possibly because private agents can deduce the preference shock of the central bankers and respond more strongly. On the other hand, when monetary shocks and forecast surprises contradict each other, monetary shocks have no (or less) impact, possibly because private agents receive opposing signals and are unable to determine the direction of monetary policy. They are thus also responding to the macroeconomic information disclosed.

These results show that the publication by central banks of their macroeconomic information helps private agents to process the signals that they receive and thus modifies their response to monetary policy decisions. This study thus suggests that providing guidance on future changes in inflation rather than on future interest rate developments (Forward Guidance policy) can make monetary policy more effective by enabling private agents to better distinguish the central bank’s macroeconomic information from its preferences.


Notes

[1] See Baeriswyl, Romain and Camille Cornand (2010), “The signalling role of policy actions”, Journal of Monetary Economics, 57(6), 682-695; Tang, Jenny (2015), “Uncertainty and the signalling channel of monetary policy”, FRB Boston Working Paper, no. 15-8; and Melosi, Leonardo (2017), “Signalling effects of monetary policy”, Review of Economic Studies, 84(2), 853-884.

[2] This study focuses on the United Kingdom because the BoE’s forecasts have a specific characteristic that makes it possible to econometrically identify their own effects. Indeed, the question asked demands that the central bank’s forecasts do not depend on the current policy decision, so that monetary surprises and forecast surprises can be identified separately. The BoE’s projections are conditional on market interest rates and not on the key rate, meaning that the BoE’s forecasts are independent of monetary policy decisions.


The European Central Bank is readying the future

By Christophe Blot and Paul Hubert

At the press conference following the meeting of the ECB’s Governing Council on Thursday, 8 June, Mario Draghi announced that the Bank’s key interest rates would remain unchanged (0% for the main refinancing operations rate, a negative 0.40% for the deposit facility rate and 0.25% for the lending facility rate). In particular, Draghi gave some valuable insights into the future direction of the euro zone’s monetary policy by changing its message. Whereas he had systematically stated that rates could be cut (“at lower levels”), he now stated that they would be maintained at the “present level” for an “extended period of time” and “well past the horizon of our net asset purchases”.

By announcing that there would be no further rate cuts, the ECB believes that the current monetary policy stance should enable it to achieve its objectives, and it is taking the first step towards a further tightening of monetary conditions. However, it should be noted that at the same time the ECB does not expect inflation to return to its 2% target by 2019. The Eurosystem’s new macroeconomic projections published during the press conference foresee inflation at 1.5% in 2017, 1.3% in 2018 and 1.6% in 2019[1]. Although the recovery is continuing, inflation will remain below its target level for a period of at least three years, which justifies maintaining an expansionary monetary policy. By clarifying that the rates will not go up upon the termination of the net asset purchases[2], the ECB clearly intends to continue to support economic activity.

Then comes the matter of the date when the asset purchase programme will end. According to the current discourse, the purchases will continue until December 2017, but they could be extended if the ECB deems it necessary. What strategy will the ECB adopt after that? It is possible that the asset purchases will diminish gradually along the lines of what the Federal Reserve did in 2014 [3]. In this case, the end of quantitative easing would take a few more months. This is currently the most likely option, which would push off the interest rate hike until the end of 2018. It is possible, however, that announcements of a reduction in purchases could be made by year end, which could lead to winding up QE by early 2018. Whichever option is chosen, the ECB will undoubtedly take care to communicate its strategy in order to gradually shape expectations about the first rate rise.

However, while this is one important element in the strategy for the normalization of the euro zone’s monetary policy, the matter is not limited to the issue of rate rises. The ECB must also provide information about its intentions regarding its negative interest rate policy or about the moment it will decide to no longer satisfy all the requests for fixed-rate refinancing, as it has done since October 2008. Finally, it also needs to indicate the pace at which it plans to cut down the size of its balance sheet as the Federal Reserve has recently begun to do (see here). The ECB also needs to be transparent on these issues.


[1] These expectations have even been revised downwards since March 2017.

[2] Since April 2017, net asset purchases have come to 60 billion euros per month, compared with 80 billion in the months before that.

[3] The Federal Reserve spread out the reduction of its securities purchases from January to October.


What factors are behind the recent rise in long-term interest rates?

By Christophe Blot, Jérôme Creel, Paul Hubert and Fabien Labondance

Since the onset of the financial crisis, long-term sovereign interest rates in the euro zone have undergone major fluctuations and periods of great divergence between the member states, in particular between 2010 and 2013 (Figure 1). Long-term rates began to fall sharply after July 2012 and Mario Draghi’s famous “whatever it takes”. Despite the implementation and expansion of the Public Sector Purchase Programme (PSPP) in 2015, and although long-term sovereign interest rates remain at historically low levels, they have recently risen.

graph 1

There may be several ways of interpreting this recent rise in long-term sovereign interest rates in the euro zone. Given the current economic and financial situation, it may be that this rise in long-term rates reflects the growth and expectations of rising future growth in the euro zone. Another factor could be that the euro zone bond markets are following the US markets: European rates could be rising as a result of rising US rates despite the divergences between the policy directions of the ECB and of the Fed. The impact of the Fed’s monetary policy on interest rates in the euro zone would thus be stronger than the impact of the ECB’s policy. It might also be possible that the recent rise is not in line with the zone’s fundamentals, which would then jeopardize the recovery from the crisis by making debt reduction more difficult, as public and private debt remains high.

In a recent study, we calculate the contributions of the different determinants of long-term interest rates and highlight the most important ones. Long-term interest rates can respond to private expectations of growth and inflation, to economic fundamentals and to monetary and fiscal policy, both domestic (in the euro zone) and foreign (for example, in the United States). The rates may also react to perceptions of different financial, political and economic risks[1]. Figure 2 shows the main factors that are positively and negatively affecting long-term interest rates in the euro zone over three different periods.

Between September 2013 and April 2015, the euro zone’s long-term interest rate decreased by 2.3 percentage points. During this period, only expectations of GDP growth had a positive impact on interest rates, while all the other factors pushed rates down. In particular, the US long-term interest rate, inflation expectations, the reduction of sovereign risk and the ECB’s unconventional policies all contributed to the decline in euro zone interest rates. Between June 2015 and August 2016, the further decline of about 1 percentage point was due mainly to two factors: the long-term interest rate and the expectations of GDP growth in the United States.

Between August 2016 and February 2017, long-term interest rates rose by 0.7 percentage point. While the ECB’s asset purchase programme helped to reduce the interest rate, two factors combined to push it up. The first is the increase in long-term interest rates in the United States following the Fed’s tightening of monetary policy. The second factor concerned political tensions in France, Italy and Spain, which led to a perception of political risk and higher sovereign risk. While the first factor may continue to push up interest rates in the euro zone, the second should drive them down given the results of the French presidential elections.

graph 2


[1] The estimate of the equation for the determination of long-term rates was calculated over the period January 1999 – February 2017 and accounts for 96% of the change in long-term rates over the period. For details on the variables used and the parameters estimated, see the study.


Where are we at in the euro zone credit cycle?

By Christophe Blot and Paul Hubert

In December 2016, the European Central Bank announced the continuation of its Quantitative Easing (QE) policy until December 2017. The continuing economic recovery in the euro zone and the renewal of inflation are now raising questions about the risks associated with this programme. On the one hand, isn’t the pursuit of a highly expansionary monetary policy a source of financial instability? Conversely, a premature end to unconventional measures could undermine growth as well as the ECB’s capacity to achieve its objectives. Here, we study the dilemma facing the ECB [in French] based on an analysis of credit cycles and banking activity in the euro zone.

The ECB’s announcement gives us two signals about the direction of monetary policy. On the one hand, by delaying the end date of QE, the ECB is implicitly announcing that the normalization of monetary policy, in particular a hike in its key rate, will not take place before early 2018. The ECB will thus continue its expansionary policy of increasing the size of its balance sheet. On the other hand, the reduction in monthly purchases is also a sign that it is toning down its expansionary character. The announcement is similar to the “tapering” that began in January 2014 by the US Federal Reserve. Purchases of securities were cut back gradually, until they actually stopped at the end of October 2016.

The undeniably expansionary nature of monetary policy in the euro zone suggests that the ECB still considers it necessary to implement a stimulus in order to achieve its ultimate monetary policy objectives. The first of these is price stability, which is defined as inflation that is lower than but close to 2% per year. There are no signs of either runaway inflation or growth [1] [2]. The securities buyback programme should help to consolidate growth and push inflation towards the 2% target. At the same time, the liquidity issued by the central bank in its securities purchase programmes and the low level of interest rates (short and long term) are fuelling fears that monetary stability might have an adverse effect on financial stability[3].

The result leaves the ECB facing a dilemma. Putting a premature end to quantitative easing could keep the euro zone in a state of low inflation and low growth. Unnecessarily prolonging QE, while the US Federal Reserve has begun normalizing its monetary policy, could create a risk of financial instability, resulting in an uncontrolled surge in asset prices, credit, and more broadly the risk taken on by the financial system.

We assess this dual risk using indicators on the activity of the banking system of the euro zone as a whole and of the countries that make it up. Credit, whether granted to households or to non-financial enterprises, is central to bank assets and often at the heart of risks to financial instability[4]. Here we propose extending the analysis to the size of the balance sheet and to total loans granted – including credit to other monetary and financial institutions – which makes it possible to measure the risk associated with the banking system as a whole[5].

These different variables are related either to GDP, which makes it possible to capture the disconnection between banking activity and real activity, or to the capital and reserves of the banking system, which makes it possible to capture the leverage effect, i.e. the capacity of the system to absorb losses. Here we focus on quantities rather than prices, using indicators such as the ratio of credit granted on equity and the ratio of credit received on income. These are central to reflecting the transmission of monetary policy and to assessing the risk of financial instability.

Graphe_post30-05_ENG

The graph shows the changes in the credit cycle, relative to GDP (blue line) and relative to the capital and reserves of the banking system (red line) [6]. The green areas indicate periods when credit deviates significantly above or below its long-term trend. In general, the analysis of credit and of the size of the banking system’s balance sheet points to a recovery in activity but it does not suggest either a credit boom or an excessive contraction in the euro zone in the recent period. While credit is evolving in a relatively more favorable direction relative to its trend in France and Germany, the cycle does not indicate an excessive increase. The Netherlands and Spain are distinguished by a low level of credit relative to GDP. For the Netherlands, this trend is confirmed by the indicators relative to the banking system’s capital and reserves, while in Spain, outstanding loans relative to capital and reserves are at a historically high level, suggesting an excessive level of risk-taking given the economic situation.

[1] Translation errorDespite the recent rebound in inflation, which is largely linked to the rise in oil prices and inflation expectations, inflationary pressures are still moderate, and getting inflation back to the 2% target is not sufficiently sure to warrant a change in the direction of monetary policy.

[2] Unemployment is still high, fuelling deflation.

[3] A recent analysis by Borio and Zabai (2016) of the effectiveness of unconventional monetary policy suggests that its effectiveness could decrease even as the risks involved increase. The role of asset prices has been studied by Andrade et al. (2016), showing that asset prices had reacted, as expected, following the measures taken by the ECB, and by Blot et al. (2017) on an assessment of the risk of bubbles.

[4] See Jorda et al., 2013 and 2015.

[5] Translation errorThe Basel III legislation is based on risk indicators calculated at the level of banking establishments, while our approach is based on macroeconomic indicators.

[6] Translation errorThese cycles are obtained using a principal component analysis (PCA) of several types of trend / cycle breakdowns: the Hodrick-Prescott filter, the Christiano-Fitzgerald filter, and the moving average.


How negative can interest rates get?

By Christophe Blot and Paul Hubert

On 11 June 2014, the European Central Bank decided to set a negative rate on deposit facilities and on the excess reserves held by credit institutions in the euro zone. This rate was then lowered several times, and has been -0.40% as of March 2016. This raises questions about the reasons why agents, in this case the commercial banks, agree to pay interest on deposits left with the ECB. In an article on the causes and consequences of negative rates, we explain how the central bank has come to impose negative rates and how far they can go, and then we discuss the costs of this policy for the banks.

To conduct its monetary policy, the ECB requires commercial banks in the euro zone to have an account with the Bank, which is used to meet the minimum reserve requirements[1]  and to participate in operations to provide liquidity. This account can also be used to perform clearing transactions between commercial banks. The required reserves are remunerated at a rate set by the ECB. Beyond this amount, in normal circumstances the banks do not receive any other compensation. Moreover, the ECB also provides a deposit facility allowing the banks to deposit cash with the ECB for a period of 24 hours, with remuneration paid at a deposit facility rate.

Prior to 2008, the commercial banks held only the reserves that they needed to meet the minimum reserve requirements (see the graph). Any stock of excess reserves[2] was very small: less than 1 billion euros on average until 2008. The same was true for the balance of deposit facilities, which was 321 million euros on average. Since the crisis, the ECB has replaced the interbank market and has intervened to provide a large amount of liquidity. Through the banks’ participation in various ECB programmes to purchase securities (quantitative easing, QE), they also receive liquidities that are placed in their reserve account, to such an extent that by September 2016 the accumulated stock of excess reserves and deposit facilities reached 987 billion euros. The negative rates do not apply to all monetary policy operations but only to the portion of the cash left on deposit by the banks (total assets of the euro zone banks are 31 trillion euros). At the current rate, the direct annual cost to the banks is thus 3.9 billion euros.

Given that the banks are not required to hold these excess reserves, it is reasonable to ask why they accept to bear this cost. To answer this question, it is necessary to examine the possibilities for trade-offs with other assets that could be used as a substitute for the excess reserves. The reserves are in fact money[3] issued by the central banks solely for the commercial banks and are therefore a very liquid asset. But the rates on the money market are also negative, to such an extent that it is a matter of indifference to the banks whether they have excess reserves and place their liquidities on the interbank market for a week or buy Treasury securities issued by the French or German government, for example, with yields that are also negative.


graph

Actually, the best substitute for the reserves would be to hold the cash directly. The substitution could therefore take place within the monetary base if the banks called for the conversion of their excess reserves and deposit facilities into cash, which has the same properties in terms of liquidity and zero nominal interest. Currently this would mean converting 987 billion euros of reserves into banknotes, nearly doubling the amount outstanding, as the volume of notes in circulation in September 2016 was 1,096 billion euros.

The fact that these agents can have an asset that is not interest-bearing is the argument for why nominal rates cannot be negative. In practice, because there are costs to holding currency in the form of notes, this trade-off does not take place when the threshold for negative rates is exceeded. The nominal rate can therefore be negative. It is clear however that there is a threshold at which holding cash would be preferable. The cost of holding large amounts of cash is not known precisely, but it seems that it is not insignificant, and in any case is higher than the 0.4% currently charged by the ECB.

It seems that in practice there has not yet been any such substitution, since the volume of outstanding notes in circulation has not risen particularly since negative rates were first set (graph). Jackson (2015) has made an assessment indicating that the various costs of holding money in the form of notes and coins could be up to 2%, which would act as an effective lower bound (ELB) for a reduction in rates.

Beyond the costs that negative rates represent for banks, the expected benefits of such a policy need to be considered, as well as the overall context in which they have been set. Together with negative rates, the ECB is using its targeted long-term refinancing operations (TLTRO II) to enable the banks to finance themselves at negative rates, and is thus urging them doubly (via the cost of their excess reserves and via the rate at which they are financed) to grant credit to the real economy.


[1] Credit institutions are in practice required to leave reserves in this account in the amount of a certain fraction of deposits collected from the non-financial sector. See here for more details.

[2] Amount of reserves beyond the required reserves.

[3] Together with the banknotes issued, these form what is called the monetary or money base, M0.


Does central bank optimism move financial markets?

By Paul Hubert and Fabien Labondance

“Animal spirits”, also called “errors of optimism and pessimism” or “sentiments”, contribute to macroeconomic fluctuations, as has been pointed out by Pigou (1927) and Keynes (1936) and more recently by Angeletos and La’O (2013) [1]. Quantifying these kinds of unobservable concepts is crucial for understanding how economic agents form their expectations and arrive at decisions that in turn influence the economy. In a recent working paper, “Central Bank Sentiment and Policy Expectations”, we examine this issue by analysing central bank communications and assessing their impact on expectations about interest rate markets.

Our study aims to quantify the “sentiment” conveyed by central bank communications using the monetary policy statements of the European Central Bank (ECB) and the US Federal Reserve (Fed). We then test whether the optimism or pessimism transmitted in these statements affects the term structure of short-term interest rate expectations.

The main challenge is measuring a concept like the “sentiment” of a central bank, which is not very tangible. We first quantified the tone used by the ECB and the Fed in their monetary policy statements by using a computational linguistics approach based on three dictionaries of “positive” and “negative” words [2]. Note that the goal here is not to measure the orientation of the discourse (whether, for example, expansionary or restrictive) but rather to quantify the use of words with a positive or negative tone in order to measure the overall tonality of the speech, regardless of its ultimate message. Sentiment is thus conceived as a component that is independent of economic fundamentals and the monetary policy decisions actually taken [3]. In other words, we look at whether the use of certain words rather than others, regardless of the message communicated, affects the financial markets.

Figure 1 shows changes in the tone of central bank statements, calculated on the basis of the three dictionaries, for the ECB and the Fed from 2005 to 2015. The tone is correlated with the economic cycle: the speech is more optimistic (positive tone) during periods of growth and more pessimistic (negative tone) during periods of recession. Using this measure of tonality, we can see the 2008-2009 recession in the euro zone and the US, as well as the sovereign debt crisis in the euro zone in 2012-2013. The tone adopted by central bankers seems therefore to be the product of a combination of the central banks’ assessment of the current and future state of the economy and of the sentiment that they are conveying.

graph-1

After isolating the “sentiment” component of the variables quantifying the tone, we measured the impact of this sentiment on changes in short-term interest rate expectations, as measured by interest rate swaps (OIS – Overnight Indexed Swaps) for maturities ranging from 1 month to 10 years. Since this sentiment is communicated on the day of the monetary policy decision, we also checked that we are not measuring the effect of the decision itself.

Our results show that a discourse with a positive (i.e. optimistic) sentiment has a positive effect on interest rate expectations for maturities ranging from 3 months to 10 years in the euro zone and on maturities from 1 to 3 months and from 1 to 3 years in the United States. The peak effect is for maturities of around 1 to 2 years both in the euro zone and the United States. We also show that this effect is persistent and tends to grow over time (see Figure 2). We also find that the impact of the sentiment depends on the precision of the signal, its size and its sign (the effect of pessimism is stronger than that of optimism, for example), as well as on the level of inflation and growth.


graph-2

graph-2-bis

These results show that market reactions are not due solely to the substance of the message but also to the way that it is expressed by the central bankers. Central bankers’ sentiments influence the formation of interest rate expectations and seem to set the future prospects for rate policy. In a context where observers attentively scrutinize the slightest detail that might reveal the date when the Fed will once again raise rates, this study opens new avenues for research and suggests that it might be useful to test whether the sentiment conveyed in the last speech by Janet Yellen might be a good indicator.


[1] Angeletos, George-Marios, and Jennifer La’O (2013), “Sentiments”, Econometrica, 81(2), 739-780 ; Keynes, John Maynard (1936), General Theory of Employment, Interest and Money, London, Palgrave Macmillan; and Pigou, Arthur Cecil (1927), Industrial Fluctuations, London, Palgrave MacMillan.

[2] We use three different dictionaries: one by Apel and Blix-Grimaldi (2012) that focuses on the communications of the central banks; one developed by Loughran and McDonald (2011) for a financial context; and the General Inquirer’s Harvard dictionary, which lists positive and negative words used in everyday life. These dictionaries list words or phrases with positive or negative connotations. The difference between the numbers of positive and negative words indicates the tone of the text: if there are more positive than negative expressions, the tone is optimistic, and vice versa. See Apel, Mikael and Marianna Blix-Grimaldi (2012), “The information content of central bank minutes”, Riksbank Research Paper Series, no. 92; Loughran, Tim and Bill McDonald (2011), “When is a Liability not a Liability? Textual Analysis, Dictionaries, and 10-Ks”, Journal of Finance, 66 (1), 35-65; and http://www.wjh.harvard.edu/~inquirer/.

[3] Cf. Angeletos and La’O (2013).


The effects of the oil counter-shock: The best is yet to come!

By Eric Heyer and Paul Hubert

After falling sharply over the past two years, oil prices have been rising once again since the start of the year. While a barrel came in at around 110 dollars in early 2014 and 31 dollars in early 2016, it is now close to 50 dollars.

Will this rise in oil prices put a question mark over the gradual recovery that seems to have begun in France in 2016?

In a recent study, we attempted to answer three questions about the impact of oil prices on French growth: will a change in oil prices have an immediate effect, or is there a time lag between the change and the impact on GDP? Are the effects of rises and falls in oil prices asymmetrical? And do these effects depend on the business cycle? The main results of our study can be summarized as follows:

  1. There is a time lag in the impact of oil price variations on French GDP. Over the period 1985-2015 the lag was on average about 4 quarters;
  1. The impact, whether downward or upward, is significant only for variations in oil prices greater than 1 standard deviation;
  2. The asymmetric effect is extremely small: the elasticity of growth to oil prices is the same whether the price rises or falls. Only the speed at which the impact is transmitted differs (3 quarters in the case of a rise, but 4 in the case of a fall);
  3. Finally, the impact of oil price changes on economic activity depends on the phase in the business cycle: the elasticity does not differ significantly from zero in situations of a “crisis” or a “boom”. However, the elasticity is much greater in absolute terms when the economy is growing slowly (an economic slump).

Let us now apply these results to the situation since 2012. Between the first quarter of 2012 and first quarter of 2016, the price of a barrel of Brent crude plummeted from 118 dollars to 34 dollars, a fall of 84 dollars in four years. If we factor in the euro/dollar exchange rate and changes in consumer prices in France, the fall amounts to a 49 euro reduction over the period (Figure 1).

IMG1_post28-05-ENG

We evaluated the impact of a decline like this on France’s quarterly GDP, taking into account the above-mentioned time lag, asymmetry and phase of the business cycle.

Factoring all this in indicates that the oil counter shock ultimately did not show up much in 2015. As illustrated in Figure 2, the impact should make itself felt from the first quarter of 2016, regardless of the hypotheses adopted. The positive effect of the oil counter-shock is yet to come!

IMG2_post28-05-ENG