Trump’s budget policy: Mortgaging the future?

By Christophe Blot

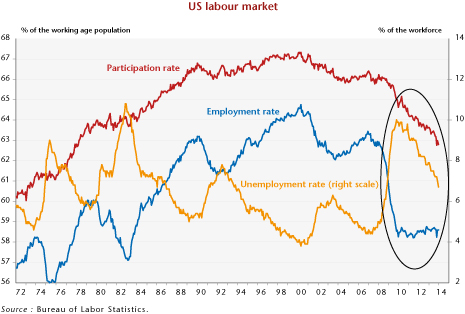
While the momentum for growth has lost steam in some countries – Germany, France and Japan in particular – GDP in the United States is continuing to rise at a steady pace. Growth could even pick up pace in the course of the year as a highly expansionary fiscal policy is implemented. In 2018 and 2019, the fiscal stimulus approved by the Trump administration – in December 2017 for the revenue component, and in February 2018 for the expenditure side – would amount to 2.9 GDP points. This level of fiscal impulse would come close to that implemented by Obama for 2008. However, Trump’s choice has been made in a very different context, since the unemployment rate in the United States fell back below the 4% mark in April 2018, whereas it was accelerating 10 years ago, peaking at 9.9% in 2009. The US economy should benefit from the stimulus, but at the cost of accumulating additional debt.

Donald Trump had made fiscal shock one of the central elements of his presidential campaign. Work was begun in this direction at the beginning of his mandate, and came to fruition in December 2017 with the passing of a major tax reform, the Tax Cuts and Jobs Act [1], which provided for a reduction in household income tax – in particular by reducing the maximum marginal income tax rate – and corporation tax, whose effective rate would fall from 21% to 9% by 2018 [2]. In addition to this initial stimulus, expenditure will also rise in accordance with the agreement reached with the Democrats in February 2018, which should lead to raising federal spending by USD 320 billion (1.7 GDP points) over two years. These choices will push up domestic demand through boosting household disposable income and corporate profitability, which should stimulate consumption and investment. The multiplier effect – which measures the impact on GDP of a one dollar increase in public spending or a one dollar cut in taxes – will nevertheless be relatively small (0.5) because of the US position in the cycle.

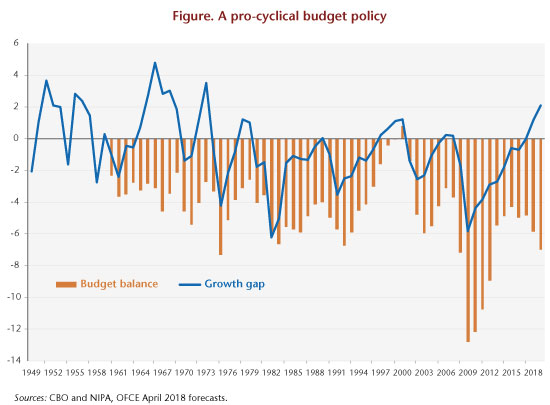
Moreover, the public deficit will expand sharply, to reach a historically high level outside a period of crisis or war (graph). It will come to 5.8% of GDP in 2018 and 7.0% in 2019, while the growth gap will become positive [3]. While the risk of overheating seems limited in the short term, the fact remains that the fiscal strategy being implemented could push the Federal Reserve to tighten monetary policy more quickly. However, an excessive rise in interest rates in a context of high public debt would provoke a snowball effect. Above all, by choosing to re-launch the economy in a favourable environment, the government risks being forced to make adjustments later when the economic situation deteriorates. This pro-cyclical stance in fiscal policy risks amplifying the cycle by accelerating growth today while taking the risk of accentuating a future slowdown. With a deficit of 7% in 2019, fiscal policy’s manoeuvring room will actually shrink.

IMG1_post28-05_ENG


[1] See the section on Budget policy: Crisis-free acceleration [“Politiques budgétaires : accélération sans crise”] in our April 2017 forecast for greater detail.

[2] See here for more on this.

[3] The growth gap expresses – as a % of potential GDP – the difference between observed GDP and potential GDP. Recall that potential GDP is not observed but estimated. The method of calculation used by the Congressional Budget Office (CBO) is explained here.


Missing deflation – unique to America?

By Paul Hubert, Mathilde Le Moigne

Was the way inflation unfolded after the 2007-2009 crisis atypical? According to Paul Krugman: “If inflation [note: in the United States] had responded to the Great Recession and aftermath in the same way it did in previous big slumps, we would be deep in deflation by now; we aren’t.” Indeed, after 2009, inflation in the United States remained surprisingly stable given actual economic developments. Has this phenomenon, which has been described as “missing deflation”, been observed in the euro zone?

Despite the deepest recession since the 1929 crisis, the inflation rate remained stable at around 1.5% on average between 2008 and 2011 in the United States, and 1% in the euro zone. Does this mean that the Phillips curve, which links inflation to real activity, has lost its empirical validity? In a note in 2016, Olivier Blanchard recalls on the contrary that the Phillips curve, in its simplest original version, remains a valid instrument for understanding the links between inflation and unemployment, despite this “missing disinflation”. Blanchard notes, however, that the link between the two variables has weakened because inflation is increasingly dependent on expectations of inflation, which are themselves anchored in the US Federal Reserve’s inflation target. In their 2015 article, Coibion ​​and Gorodnichenko explain the missing deflation in the United States by the fact that inflation expectations tend to be influenced by the most visible price changes, such as changes in the price of a barrel of oil. Since 2015, we have seen a drop in inflation expectations concomitant with the decline in oil prices.

The difficulty in accounting for recent changes in inflation by using the Phillips curve led us in a recent article to evaluate its potential determinants and to consider whether the euro zone has also experienced a phenomenon of “missing deflation”. Based on a standard Phillips curve, we did not find the conclusions of Coibion and Gorodnichenko when we consider the euro zone as a whole. In other words, real activity and inflation expectations give a good description of the way inflation is behaving.

This result seems to come, however, from a bias in aggregation between national inflation behaviours in the euro zone. In particular, we find a notable divergence between the countries of northern Europe (Germany, France), which show a general tendency towards missing inflation, and the more peripheral countries (Spain, Italy, Greece), which are exhibiting periods of missing deflation. This divergence nevertheless shows up from the beginning of our sample, that is to say, in the first years when the euro zone was created, and seems to be absorbed from 2006, without undergoing any notable change during the 2008-2009 crisis.

In contrast to what happened in the United States, it seems that the euro zone did not experience missing deflation as a result of the 2008-2009 economic and financial crisis. On the contrary, it seems that divergences in inflation in Europe predate the crisis and tended to be absorbed by the crisis.


The Janus-Faced Nature of Debt

by Mattia Guerini, Alessio Moneta, Mauro Napoletano, Andrea Roventini

The financial and economic crises of 2008 have been intimately interwined with the dynamics of debt. As a matter of fact, a research by Ng and Wright (2013) reports that in the last thirty years all the U.S. recessions had financial origins.

Figure 1 shows that both U.S. corporate (green line) and mortgage (blue line) debts have been growing steadily from the sixties to the end of the century. In the 2000s, however, mortgage debt increased from around 60% to 100% of GDP in less than a decade. The situation became unsustainable in 2008 with the outburst of the subprime real asset bubble. The trend in debt changed since then. Mortgage debt declined substantially, while the U.S. public debt-to-GDP ratio (red line) skyrocketed from 60% to a level slightly above than 100% in less than 5 years, as a consequence of the Great Recession.

IMG1_post24-01_ENG

This surge in public debt has been raising concerns about the sustainability of public finances, and more generally, about the possible detrimental effects of public debt on economic growth. Some economists argued indeed that there exist a 90% threshold after which public debt harms GDP growth (see Reinhart and Rogoff, 2010). Notwithstanding a large number of empirical studies contradicting this hypothesis (see Herdon et al., 2013 and Égert, 2015 as recent prominent examples), the debate is still open (see Ash et al., 2017 and Chudik et al., 2017).

We have contributed to this debate with a new empirical analysis that jointly investigates the impact of public and private debt on U.S. GDP dynamics and that will appear on “Macroeconomic Dynamics” (see Guerini et al., 2017). Our analysis keeps the a priori theoretical assumptions as minimal as possible by exploiting new statistical techniques that identify causal structures from the data under quite general conditions. In particular, we employ a causal search algorithm based on the Independent Component Analysis (ICA) to identify the structural form of the cointegrated VAR and to solve the double causality issue.[1] This has allowed us to keep an “agnostic” perspective in the econometric analysis, avoiding restrictions on the model, thus “letting the data speak”.

The results obtained suggest that public debt shocks positively and persistently affect output (see Figure 2, left panel).[2] In particular, our results provide evidence against the hypothesis that upsurges in public debt hamper GDP growth in the U.S. In fact, increases in public debt—possibly channeled through an increase in public spending in investments—crowd-in private investments, (see Figure 2, right panel) confirming some results already brought to the fore by Stiglitz (2012). This implies that government spending and, more generally, expansionary fiscal policy spur output both in the short- and in the medium-run. In that, austerity policies do not seem to be the appropriate policy answer to overcome a crisis.

IMG2_post24-01_ENG

On the contrary, these positive effects are not fully observed when we look at the effects of private debt and in particular when we focus on mortgage debt. More specifically, we find that the positive effects of private debt shocks are milder than public debt’s ones, and they fade out over time. Furthermore, increasing the levels of mortgage debt have a negative impact on output and consumption dynamics in the medium-run (see Figure 3), while their positive effects are only temporary and relatively mild. Such a result appears to be fully consistent with the results of Mian and Sufi (2009) and Jordà et al. (2014): mortgage debt fuels real asset bubbles, but when these bubbles burst, they trigger a financial crises that visibly transmit their negative effects to the real economic system for longer periods of time.

IMG3_post24-01_ENG

Another interesting fact that emerges from our research, is that the other most important form of private debt—i.e. non-financial corporations (NFCs) debt—does not generate negative medium-run impacts. As a matter of fact (as it is possible to see in Figure 4) surges in the level of NFCs debt seems to have a positive effect both on GDP and on gross fixed capital formation, hence directly increasing the level of investments.

IMG4_post24-01_ENG

To conclude, our results suggest that debt has a Janus-faced nature: different types of debts impact differently on aggregate macroeconomic dynamics. In particular, possible threats to medium- and long-run output growth do not come from government debt (which might well be a consequence of a crisis), but rather from increasing too much the level of private one. More specifically, surges in the level of mortgage debt appear to be much more dangerous than the building up of corporate debt.


[1] For details about the ICA algorithm see Moneta et al. (2013); for details about its statistical properties see Gourieroux et al. (2017).

[2] When computing the Impulse Response Functions, we apply a 1 standard deviation (SD) shock to the relevant debt variable. Hence, for example, on the y-axis of Figure 2, left panel, we can read that a 1 SD shock to public debt has a 0.5% positive effect on GDP in the medium run.


Do QE programmes create bubbles?

By Christophe Blot, Paul Hubert and Fabien Labondance

Has the implementation of unconventional monetary policies since 2008 by the central banks created new bubbles that are now threatening financial stability and global growth? This is a question that comes up regularly (see here, here,  here or here). As Roger Farmer shows, it is clear that there is a strong correlation between the purchase of securities by the Federal Reserve – the US central bank – and the stock market index (S&P 500) in the United States (Figure 1). While the argument may sound convincing at first glance, the facts still need to be discussed and clarified. First, it is useful to remember that correlation is not causation. Secondly, an increase in asset prices is precisely a transmission channel for conventional monetary policy and quantitative easing (QE). Finally, an increase in asset prices cannot be treated as a bubble: developments related to fundamentals need to be distinguished from purely speculative changes.

Higher asset prices is a factor in the transmission of monetary policy

If the ultimate goal of central banks is macroeconomic stability [1], the transmission of their decisions to the target variables (inflation and growth) takes place through various channels, some of which are explicitly based on changes in asset prices. Thus, the effects expected from QE are supposed to be transmitted in particular by so-called portfolio effects. By buying securities on the markets, the central bank encourages investors to reallocate their securities portfolio to other assets. The objective is to ease broader financing conditions for all economic agents, not just those whose securities are targeted by the QE programme. In doing this, the central bank’s actions push asset prices up. It is therefore not surprising to see a rise in equity prices in connection with QE in the US.

Every increase in asset prices is not a bubble

Furthermore, it is necessary to make sure that the correlation between asset purchases and their prices is not just a statistical artefact. The increase observed in prices may also reflect favourable fundamentals and be due to improved growth prospects in the United States. The standard model for determining the price of a financial asset identifies its price as equal to the present value of anticipated income flows (dividends). Although this model is based on numerous generally restrictive assumptions, it nevertheless identifies a first candidate, changes in dividends, to explain changes in stock prices in the United States since 2008.

Figure 1 shows a clear correlation between the series of dividends [2] paid and the S&P 500 index between April 2010 and October 2013. Part of the rise in equity prices can be explained simply by the increase in dividends: the usual determinant of stock market prices. Looking at this indicator, only the period starting at the beginning of 2014 could then indicate a disconnect between dividends and share prices, and thus possibly point to an over-adjustment.

Graphe1_post-25-02_ENG

A correlation that isn’t found in the euro zone

If the theory that unconventional monetary policies create bubbles is true, then it should also be observed in the euro zone. Yet performing the same graph as the one for the United States does not reveal a link between the liquidity provided by the European Central Bank (ECB) and the Eurostoxx index (Figure 2). The first phase in the increase in the size of the ECB’s balance sheet, via its refinancing operations starting in September 2008, came at a time when stock markets were collapsing, following the bankruptcy of Lehman Brothers. Likewise, the very long-term refinancing operations carried out by the ECB at the end of 2011 do not seem to be correlated with the stock market index. The rise in share prices coincides in fact with Mario Draghi’s statement in July 2012 that put a halt to concerns about a possible breakup of the euro zone. It is of course possible to argue that the central bank has played a role, but any link between liquidity and asset prices is simply not there. At the end of 2012, the banks paid back their loans to the ECB, which reduced the cash in circulation. Finally, the recent period is once again illustrating the fragility of the argument that QE creates bubbles. It is precisely at a time when the ECB is undertaking a programme of large-scale purchases of securities, along the lines of the Federal Reserve, that we are seeing a fall in world stock indices, in particular the Eurostoxx.

Graphe2_post-25-02_ENG

So does this mean that there is no QE-bubble link?

Not necessarily. But to answer this question, it is necessary first to identify precisely the portion of the increase that is due to fundamentals (dividends and companies’ share prospects). A bubble is usually defined as the difference between the observed price and a so-called fundamental value. In a forthcoming working paper, we endeavour to identify periods of over- or undervaluation of a number of asset prices for both the euro zone and the United States. Our approach involves estimating different models of asset prices and thereby to extract a component that is unexplained by fundamentals, which is then called a “bubble”. We then show that for the euro zone, the ECB’s monetary policy broadly speaking (conventional and unconventional) does not seem to have a significant effect on the “bubble” component (unexplained by fundamentals) of asset prices. The results are stronger for the United States, suggesting that QE might have a significant effect on the “bubble” component of some asset prices there.

This conclusion does not mean that the central banks and the regulators are impotent and ignorant in the face of this risk. Rather than trying to dissect every movement in asset prices, the central banks should focus their attention on financial vulnerabilities and on the ability of agents (financial and non-financial) to absorb sharp fluctuations in asset prices. The best prevention against financial crises thus consists of continuously monitoring the risks being taken by agents rather than trying to limit variations in asset prices.

[1] We prefer a broad definition of the end objective that takes into account the diversity of institutionalized formulations of the objectives of central banks. While the mandate of the ECB is primarily focused on price stability, the US Federal Reserve has a dual mandate.

[2] The series of dividends paid shows strong seasonality, so this has been smoothed by a moving average over 12 months.


Investment behaviour during the crisis: a comparative analysis of the main advanced economies

By Bruno DucoudréMathieu Plane and Sébastien Villemot

This text draws on the special study, Équations d’investissement : une comparaison internationale dans la crise [Investment equations : an international comparison during the crisis], which accompanies the 2015-2016 Forecast for the euro zone and the rest of the world.

The collapse in growth following the subprime crisis in late 2008 resulted in a decline in corporate investment, the largest since World War II in the advanced economies. The stimulus packages and accommodative monetary policies implemented in 2009-2010 nevertheless managed to halt the collapse in demand, and corporate investment rebounded significantly in every country up to the end of 2011. But since 2011 investment has followed varied trajectories in the different countries, as can be seen in the differences between, on the one hand, the United States and the United Kingdom, and on the other the euro zone countries, Italy and Spain in particular. At end 2014, business investment was still 27% below its pre-crisis peak in Italy, 23% down in Spain, 7% in France and 3% in Germany. In the US and the UK, business investment was 7% and 5% higher than the pre-crisis peaks (Figure).

Our study estimates investment equations for six major countries (Germany, France, Italy, Spain, the UK and USA) in an effort to explain trends in investment over the long term, while paying particular attention to the crisis. The results show that using the traditional determinants of corporate investment – the cost of capital, the rate of profit, the rate of utilization of production capacity and business expectations – it is possible to capture the main developments in investment for each country in recent decades, including since 2008.

Thus, since the onset of the crisis, differences in decisions on taxation and on how tight to make fiscal policy and how expansive to make monetary policy have led to differences between countries in terms of the dynamics of the economy and real capital costs and profit rates, which account for the current disparities in corporate investment.

Graphe-post17-06_investENG


The coming recovery

By the Analysis and Forecasting Department, under the direction of Eric Heyer and Xavier Timbeau

This text summarises the OFCE 2015-2016 economic outlook for the euro zone and the rest of the world

While up to now the euro zone had not been part of the global recovery, the conjunction of a number of favourable factors (the fall in oil prices and depreciation of the euro) will unleash a more sustained process of growth that is shared by all the EU countries. These developments are occurring at a time when the massive and synchronised fiscal austerity that had pushed the euro zone back into recession in 2011 is easing. The brakes on growth are gradually being lifted, with the result that in 2015 and 2016 GDP should rise by 1.6% and 2%, respectively, which will reduce unemployment by half a point per year. This time the euro zone will be on the road to recovery. However, with an unemployment rate of 10.5% at the end of 2016, the social situation will remain precarious and the threat of deflation is not going away.

The expected demand shock

After a period during the Great Recession of 2008-2009 when growth was boosted by expansionary fiscal policy, the euro zone countries quickly reversed their policy orientation and adopted a more restrictive one. While the United States also chose to reduce its budget deficit, austerity has had less effect there. First, the negative demand shock at the euro zone level was amplified by the synchronisation of the consolidation. Second, in a context of rising public debt, the lack of fiscal solidarity between the countries opened up a breach for speculative attacks, which pushed up first sovereign rates and then bank rates or the non-financial agents market. The euro zone plunged into a new recession in 2011, while globally the momentum for growth gathered pace in the other developed countries (chart). This episode of consolidation and financial pressure gradually came to an end. In July 2012, the ECB made a commitment to support the euro; fiscal austerity was eased in 2014; and the Member States agreed on a draft banking union, which was officially initiated in November 2014, with new powers on banking supervision entrusted to the ECB. All that was lacking in the euro zone then was a spark to ignite the engine of growth. The transfer of purchasing power to households that resulted from the fall in oil prices – about one percentage point of GDP if oil prices stay down until October 2015 – represents this positive demand shock, which in addition has no budget implications. The only cost resulting from the shock comes from the decline in income in the oil-producing countries, which will lead them to import less in the coming quarters.

An external demand shock will combine with this internal demand shock in the euro zone. The announcement of a quantitative easing programme in the euro zone represents a second factor accelerating growth. This programme, under which the ECB is to purchase more than 1,000 billion euros of securities at a pace of 60 billion per month until September 2016, not only will amplify the fall in sovereign yields but more importantly will also lead to a reallocation of portfolio assets and drive the euro (further) down. Investors looking for higher returns will turn to dollar-denominated securities, especially as the prospect of a gradual monetary tightening in the US improves the outlook for earnings on this side of the pond. The rising dollar will lift the currencies of the Asian countries with it, which will increase the competitive advantage of the euro zone at the expense this time of the United States and some emerging countries. It is unlikely that the fragility induced in these countries and in the oil-producing countries by the oil shock and by the decline in the euro will offset the positive effects expected in the euro zone. On the contrary, they will also be vectors for the rebalancing of growth needed by the euro zone.

Investment is the factor that will complete this growth scenario. The anticipation of higher demand will remove any remaining reluctance to launch investment projects in a situation where financing conditions are, overall, very positive, representing a real improvement in countries where credit constraints had weighed heavily on growth.

All this will lead to a virtuous circle of growth. All the signals should turn green: an improvement in household purchasing power due to the oil impact, increased competitiveness due to the lower euro, an acceleration in investment and, ultimately, growth and employment.

A fragile recovery?

While the elements promoting the euro zone’s growth are not mere hypotheticals about the future but represent a number of tangible factors whose effects will gradually make themselves felt, the fact remains that they are somewhat fragile. The falling price of oil, for instance, is probably not sustainable. The equilibrium price of oil is closer to USD 100 than USD 50 and, ultimately, a rise in energy prices is in the cards: what has a positive effect today could undermine the resumption of a recovery tomorrow. The decline of the euro seems more long-term; it should last at least until the end of the ECB’s quantitative easing programme, which officially is at least September 2016. The euro should not, however, fall below a level of 0.95 dollar per euro. The time it takes for changes in exchange rates to translate into trade volumes, however, should allow the euro zone to benefit in 2016 from a gain in competitiveness.

It is worth noting that a Greek exit from the euro zone could also put a halt to the nascent recovery. The firewalls set up at the European level to reduce that risk should limit any contagion, at least so long as the political risk has not been concretised. It will be difficult for the ECB to support a country where a party explicitly calling for leaving the euro zone is at the gates of power. The contagion that is now considered extinguished could then catch fire again and reignite the sovereign debt crisis in the euro zone.

Finally, the constraints of the Stability Pact have been shifted so as to leave more time to the Member States, particularly France, to get back to the 3% target. They have therefore not really been lifted and should soon be reinforced once it comes to assessing the budgetary efforts being made by the countries to reduce their debt.

G1_Post2804ang


Who has the best playing field for tax competition: the United States or the European Union?

By Sarah Guillou

Two recent events demonstrate the differences in the American and European views on tax competition. First was the case of Boeing, which the European Union (EU) has brought before the World Trade Organization (WTO). The EU is challenging the tax incentives offered by the State of Washington to the American aircraft maker. Then there is the European Commission’s investigation of Luxembourg’s tax provisions that benefit Amazon, the Internet retailer. Boeing and Amazon both make massive use of tax competition. While this is widespread and accepted in the United States, it is being increasingly questioned in the EU, and even excluded by law if it is classified as illegal State aid.

In the Boeing affair, in December 2014 the EU filed a request for consultations with the WTO regarding the tax subsidies paid by the State of Washington for the manufacture of the new Boeing 777X. This aid would amount to 8.7 billion dollars for assembly in the State. This programme was set up in November 2013 by the State of Washington, and the governor has now decided to extend it until 2040! The incentives are conditioned on the use of local products, i.e. the aid is linked “to local content requirements “. However, these requirements are contrary to the WTO Agreement on Subsidies and Countervailing Measures. We are not going to discuss here the EU’s complaint, which is awaiting a response from the US, and which is part of an ongoing dispute between Boeing and EADS about their respective public subsidies. This case, however, offers an opportunity to take a look at the intensity of tax competition that exists between the various States in the US.

While the US, like the EU, is concerned with non-discrimination, which is set out in the doctrine of the Commerce Clause of the US Constitution, in practice it has been difficult for case law, which performs an a posteriori control, to provide a definition of discrimination that makes it possible to prevent discriminatory regulations. The result has been that the American States are free to offer subsidies and tax breaks to companies, or sometimes specific companies, to attract investment and jobs. Recall that in Europe, controls on State aid are performed a priori and that granting subsidies to any specific companies is totally excluded (see Guillou, 2014, OFCE blog). In the US, Boeing is a major player in this tax competition.

An American research center “goodjobsfirst“, which tracks the aid and subsidies granted to companies by public institutions, showed that a mere 965 companies received 75% of all aid. It is Boeing that receives the most aid. This comes mainly from two States, Washington and South Carolina, with numerous subsidies (130 agreements) from all over the United States. The combination of all the aid brought to light amounts to 13 billion dollars. Boeing comes far ahead of all other companies, as second-place Alcoa receives less than half as much (5.6 billion dollars). Another study found that 22 States competed to host the production of the new 777X airliner, but Boeing ultimately decided to stay in the Seattle area and entered a 16-year tax agreement with the State of Washington that is estimated to be worth more than 8.7 billion dollars, the largest tax break in the United States. Business lobbying is much more common in the United States than in Europe, which explains much of the competition between States to attract business. While the United States has complained of foreign tax competition (especially vis-à-vis Ireland), it accepts this completely on its own territory. This is not the prevailing position in the EU, of course, as the EU is not fiscally integrated.

Indeed, in Europe, tax harmonization is not yet on the agenda. But tax competition is being increasingly debated. This has not been in vain, as this pushed Ireland to abandon its “double Irish” system that allowed certain companies located in Ireland to be taxed in tax havens. Companies taking part in this tax scheme began the process of withdrawal in January 2015. While differentiated taxation is still accepted in Europe, excessive tax competition has been considered intolerable in the common market. When companies’ tax optimization strategies come together with national strategies to attract jobs and investment, the ingenuity of the tax authorities becomes a threat to the common market. What is most worrying is the legitimization of the avoidance of common tax rules.

European controls on State aid act as a powerful guardian over the use of public resources and on non-discrimination in the European market. These controls could well become an instrument in the fight against tax “loopholes”, vulnerabilities in the tax system that result in significant losses of public resources. The case against Luxembourg concerns its system of “tax rulings”. The tax ruling is a procedure whereby a State negotiates with a company about its future tax status. This procedure, which has been called the “marketing of State sovereignty”, is widespread in Luxembourg and was brought to light by a recent investigative report published in November 2014 (Le Monde), which shows that Luxembourg is not the only country to use these “tax rulings”.

Luxembourg attracts a large number of multinational firms that choose the location of their European headquarters based on tax optimization. It is the EU country with the lowest percentage of GDP (the production of residents) out of GNP (domestic production): this figure was only 64% in 2013, against just over 100% for France and Germany. In other words, Luxembourg lost more than one-third of its national income once the payment of income to resident foreign companies was taken into account (net of income received). This reveals the fiscal opportunism of the numerous multinationals located in Luxembourg, for which the local market is clearly not a target.

In this case, Luxembourg has granted Amazon a valuation of its transfer pricing that the European Commission (EC) considers overestimated, which thus leads to underestimating the tax base (see the recently released EC decision).

Transfer prices are the prices of the goods and services traded between subsidiaries of the same corporation. These exchanges should theoretically be valued at market prices, that is to say, the price that would be paid by a company that is not a subsidiary of the corporation. The way these prices are decided may change the amount of a subsidiary’s purchases and revenues, and thus its profits. The logic of the corporation is to minimize profits where tax rates are high and shift them to where rates are low. It is not so much the price of goods that are manipulated as the price of intangible assets such as patents, copyrights or other intellectual property (trademarks, logos, etc.). Multinationals that hold intangible capital, such as the giants of the Silicon Valley, are the ones that most commonly engage in this type of manipulation.

One way to prevent the manipulation of transfer pricing in Europe would be to make it obligatory to calculate a common consolidated corporate tax base. This is the purpose of the draft CCCTB directive from 2011, which is still under discussion. Trade-offs between the various European countries would be pointless, as the tax base would be consolidated and then distributed among the member States based on a formula that takes into account fixed assets, labour and sales. The States would retain control of their tax rate on corporations. It is expected that this common base scheme would be optional. It is not certain that this would suffice to get the directive passed, as in fiscal matters this demands a unanimous vote whereas, for the moment, there is a great deal of disagreement.

On the other side of the Atlantic, the United States has a consolidated tax base system at the national level and a common federal tax rate on corporations. But local taxes, which can vary between 1% and 12%, are generally deductible from the federal tax calculation. The issue of transfer pricing between subsidiaries in different States may therefore also arise. And this is especially so, given that the local tax rate on profits is subtracted from the various tax credits awarded to certain companies.

The outcome of the investigation into Luxembourg and Amazon will be important for the future of the CCCTB Directive, in particular the version that affects only digital businesses. If the day has not yet come when the EU rules that “banking secrecy is a disguised form of subsidy” (G. Zucman, The hidden wealth of nations), the investigation into Amazon indicates that the EU is beginning to put some limits on tax competition that could soon make American taxpayers jealous.


Working in the United States: longer, harder, and …. on weekends!

By Elena Stancanelli, Paris School of Economics, CNRS and Research Associate at the OFCE[1]

Americans now work longer hours than Europeans. Daniel Hamermesh and Elena Stancanelli show in “Long Workweeks and Strange Hours” that the lengthening of the workweek in the United States has gone hand in hand with more work at night and on weekends.

The authors’ results are based on mining a unique set of data, the American Time Use Survey and a panel of European individuals that accurately measures employee working time (weekly, week-ends, at night) as well as a range of other activities (leisure, child care, domestic work, rest periods, etc.) using daily time diaries [2]. The individuals are interviewed about the entire day (24 hours) using ten-minute slots (144 ten-minute slots are filled in for each individual). These data are collected by the national statistical institutes for representative samples of the population, on an annual basis in the United States but much less frequently in Europe. For example, in France, the Emploi du temps(EDT) survey is collected by the INSEE statistics institute once every twelve years.[3]

In the US, over 30% of employees work more than 45 hours per week, a much higher rate than in France, Germany or the Netherlands (Table 1). The number of hours worked per person has fallen significantly in the last two decades in almost all OECD countries. The only exception is the United States, where hours worked fell by only 2% from 1979 to 2012, compared with, for example, an 18% reduction in France (Table 2). It is therefore not very surprising that one in three American workers are working weekends, versus fewer than one in five in France, Germany and the Netherlands (Table 1). Night work, defined as working between 10pm and 6am, is even less widespread in France, as it affects only 7% of workers, compared with over 25% in the United States and 10-15% in Germany and the Netherlands (Table 1). Furthermore, weekend work is usually performed by less-qualified individuals, immigrants and women, that is to say, by those with little bargaining power (Kostiuk, 1990; Shapiro, 1995). This tends to confirm the arduous nature of weekend work and its compulsory character. In contrast, people who work nights have more varied characteristics. Even so, more educated workers are less likely to work at night, which, again, would suggest its onerous character.

Finally, a simulation shows that, even if we assume that the United States were identical to the European countries in terms of both demographic characteristics and the structure of employment (occupational sectors, type of employment, hours worked) [4], this still fails to explain why Americans work so much and on weekends and at night (Hamermesh and Stancanelli, 2014). What is the reason for this? The importance of cultural differences between the US and Europe? The existence of institutional differences? A complex interaction between culture and institutions? This is a wide-ranging debate that has barely begun.

In any case, one key result of this study is to highlight the socially undesirable character of work on weekends, due to the damage this can cause to  family relations (Jenkins and Osberg, 2005) and to social life (Boulin and Lesnard, 2014). Food for thought for our MPs during the vote on the economic reforms in the Macron bill?

tab1post0202ESang

tab2post0202ESang


Bibliography

Boulin, Jean-Yves and Laurent Lesnard, 2014, The social costs of Sunday work, mimeo.

Gershuny, Jonathan and Kimberly Fisher, 2014, “Multinational Time Use Study,” in Alex Michalos, ed., Encyclopedia of Quality of Life and Well-Being Research. New York: Springer Science.

Hamermesh, Daniel and Elena Stancanelli, 2014, “Long Workweeks and Strange Hours”, Industrial and Labor Relations Review, forthcoming.

Hamermesh, Daniel and Elena Stancanelli, 2014, “Long Workweeks and Strange Hours”, NBER Working Paper No. 2044, and Document de Travail OFCE, No.27, December 2014 and VOX CEPR’s Policy Portal.

Kostiuk, Peter, 1990, “Compensating Differentials for Shift Work”, Journal of Political Economy 98(3): 1054-75.

Jenkins, Stephen and Lars Osberg, 2005, “Nobody to Play With? The Implications of Leisure Coordination”, In Daniel Hamermesh and Gerard Pfann (Eds.), The Economics of Time Use, pp. 113-45. Amsterdam: Elsevier.

Shapiro, Matthew, 1995, Capital Utilization and the Premium for Work at Night. Unpublished paper, University of Michigan.


[1] The author would like to thank Sandrine Levasseur, editor of the OFCE Blog, for her helpful comments and valuable suggestions.

[2] The authors use the harmonized version of the data made available by a group of researchers from Oxford University (see Gershuny and Fisher, 2014).

[3] These data are based on the average of the 2010 years for the United States and for different years in the early 2000s for the European countries. For France, we decided to use the 1998-1999 EDT data, as the most recent survey, for 2009-10, took place in the midst of the economic crisis, which could have affected the pace of work. In addition, teachers were visibly oversampled there, which would tend to distort international comparisons, as weightings do not perfectly correct the distortions. It seems very unlikely that the difference between the US and the European countries has narrowed in recent years.

[4] For the United States, the regressions also include fixed effects for the various States, in order to capture institutional differences from one State to another.


What’s masked by the fall in US unemployment rates

By Christine Rifflart

Despite the further decline in the US unemployment rate in December, data from the Bureau of Labor Statistics released last week confirms paradoxically that the American labour market is in poor health. The US unemployment rate fell by 0.3 percentage point from November (-1.2 points from December 2012) to end the year at 6.7%. The rate has fallen 3.3 percentage points from a record high in October 2009, and is coming closer and closer to the non-accelerating inflation rate of unemployment (NAIRU), which since 2010 has been set by the OECD at 6.1%. However, these results do not at all reflect a rebound in employment, but instead mask a further deterioration in the economic situation.

While the unemployment rate is the standard indicator for summarizing how tight a labour market is, this can also be considered using two other indicators, i.e. the employment rate and the labour force participation rate – in the US case, these give a different view of the state of the labour market (see chart).

GrapheCR_Post_16-01_English

After falling nearly 5 percentage points in 2008 and 2009, the employment rate has been constant for 4 years, at the level of the early 1980s (58.6%, following a peak of 63.4% at end 2006). Since then, the decline in the unemployment rate has reflected the decline in the participation rate, a trend that is confirmed by the figures for December. Over the period 2010-2013, the participation rate lost a little more than 2 percentage points, to wind up at end December at its lowest level since 1978 (62.8%, following a peak of 66.4% at end 2006).

This poor performance is due to insufficient job creation, which has a threefold impact. Despite positive GDP growth – which contrasts with the recession in the euro zone – demand is far from sufficient to reassure business and revitalize the labour market. After four years of recovery, at end 2013 employment has still not returned to its pre-crisis level. Net creation of salaried jobs in the private sector has not even been sufficient to absorb the demographic increase in the working age population. As a result, the employment rate is not improving from where it bottomed out.

Moreover, the difficulty in finding employment is encouraging the exit or delaying the entry or return of people who are old enough to participate in the labour market. This effect, familiar to economists, is called effet de flexion (“bending effect”) in French: young people are encouraged to study longer, women stay at home after raising their children, and unemployed people become discouraged and stop looking for work. Despite the resumption of economic growth and job creation, this effect continued to be felt in full in 2013. While the reduction in the participation rate slowed in 2011 and 2012 – the growth of the labour force was once more positive but remained lower than that of the working-age population – it accelerated in 2013 with the decline in the labour force. During the second half of 2013, 885,000 people were in effect diverted away from the labour market, due in particular to the more difficult economic and social conditions.

Companies seem reluctant to rehire in the particularly difficult economic context. The fiscal shock in early 2013 depressed activity: GDP growth fell from 2.8% in 2012 to an expected level of about 1.8% in 2013. There will be additional fiscal adjustments in 2014. Beyond drastic cuts (related to sequestration [1]) in state spending, some exceptional measures that have been in force since 2008-2009 for the poorest households and the long-term unemployed (3.9 million out of the 10.4 million unemployed) are coming to an end and have not been renewed. According to estimates by the Centre on Budget and Policy Priorities (CBPP), 1.3 million unemployed who have exhausted their entitlement to basic benefits (26 weeks) and who have enjoyed an exceptional extension will find themselves without support as of 1 January 2014 due to the non- renewal of the measure, and nearly 5 million unemployed will be affected by the end of the year.

There is a risk of growing numbers of people falling into poverty in this situation. According to the Census Bureau, since 2010 the poverty rate has been about 15%. However, again according to the CBPP, unemployment benefits would have prevented 1.7 million people from falling below the poverty line. The greater difficulties facing the long-term unemployed and the withdrawal of part of the population from the labour market are the direct result of a morose labour market, which is not indicative of a continuous decline in the unemployment rate.


[1] See America’s fiscal headache written 9 December 2013.


No surprises from the Fed*

By Christine Rifflart

Not surprisingly, at its meeting on 29 and 30 October the Monetary Policy Committee of the US Federal Reserve decided to maintain its unconventional measures and to leave the federal funds rate unchanged. Since the end of 2012, the Fed has been making massive purchases of securities (government bonds and mortgage debt) at a rate of $85 billion per month. The aim is to put pressure on long-term rates and to support economic activity, including the real estate market.

The Federal Reserve, which is committed to a strategy of transparency and communication aimed at orienting investor expectations, also confirmed that it will hold the rate at between 0 and 0.25% so long as: the unemployment rate is greater than 6.5%; forecasts of inflation over 1 to 2 years do not exceed the long-term inflation target, set at 2%, by more than a half-point; and long-term inflation expectations remain stable. According to our forecast in October (see The United States: capped growth), the unemployment rate, which was 7.2% in September, could fall to 6.9% by end 2014. Finally, inflation, which was at 1.5% in the third quarter of 2013, should not exceed 1.8% in 2014. In these conditions, no rate increase is expected before the second half of 2015. Policy will thus remain particularly accommodating.

There is greater uncertainty about the withdrawal of the unconventional measures than about keeping long-term rates at artificially low levels. A cessation or reduction of these measures was announced last May and is thus expected by the markets, and in any case they were not meant to last. Between May and September 2013, foreign private and public investors had anticipated the beginning of their withdrawal and began offloading some of their securities. This influx of securities depressed prices and led to a one-point increase in long-term public rates in just a few weeks. But the fragile character of growth, inadequate job creation and especially the public relations efforts undertaken by the central banks to reassure the financial markets led to putting off the actual date the purchases are to be curtailed. Long-term rates fell once again, and have continued to fall in recent weeks following the October budget crisis.

If, in retrospect, it appears that it was premature to anticipate an early withdrawal of the unconventional measures, the question of timing still remains. In its press release, the Committee stated that any decision will depend on the economic outlook as well as on a cost-benefit analysis of the programme. However, the economic situation is not expected to improve in the coming months. If Congress reaches a budget agreement before December 13, this will certainly be on the basis of cuts in public spending. This new fiscal shock will further dampen growth and penalize the labor market yet again. The issuance of new debt, which was compelled in 2013 by the statutory debt ceiling, might then grow very slowly in 2014 due to budget adjustments. Faced with this moderate growth in the supply of securities, the Federal Reserve could reduce its own purchases to the benefit of other investors. This could help maintain equilibrium in the securities market without a sharp fall in asset prices.

This normalization of monetary policy instruments should not be long in coming. But there are risks involved, and a sharp rise in long-term rates cannot be excluded. The markets are volatile, and the events of May and June have not been forgotten. But much of the movement has already been taken on board by the markets. The Federal Reserve will therefore have to beef up its communication strategy (by for example announcing in advance the date and scope of its decision) if it is to succeed the difficult balancing act of maintaining a highly accommodative monetary policy while gradually dispensing with its exceptional measures to maintain low interest rates. Let us assume that the exercise will be a success. Long-term public rates, at 2.7% in third quarter 2013, should not exceed 3.5% by the end of 2014.

——

*This text draws on the study “Politique monétaire: est-ce le début de la fin ?” [Monetary policy: Is it the beginning of the end?], which is to appear soon in the OFCE 2013-2014 outlook for the global economy.