Bank fragility: What consequences for economic growth and its relationship with bank loans?

Jérôme Creel and Fabien Labondance

The collapse of Silicon Valley Bank (SVB) has rekindled concern about the solidity of the US banking system and, via the danger of contagion, the European banking system. It offers a kind of case study of the complex relationship between banks and the economy.


SVB’s collapse came a few months after the Committee for the Alfred Nobel Memorial Prize in Economics, funded by the Royal Swedish Bank, awarded the 2022 prize to Ben Bernanke, Douglas Diamond and Philip Dybvig for their contributions to banking economics. In particular, Diamond and Dybvig explained the mechanisms by which a banking panic can occur (word of mouth is enough – economists speak of self-fulfilling prophecies), the difficulty of separating a solvency crisis from a liquidity crisis, and the measures to be implemented to stop it, i.e. by insuring deposits[1]. Bernanke showed the way that a banking panic can be transmitted to the real economy, thereby justifying the central bank’s implementation of a bank bailout. Their work undoubtedly helps to better understand the recent decisions of the US monetary authorities to contain the crisis triggered by SVB, such as the extension of deposit insurance.

In addition to this work, an empirical consensus had emerged that economic growth, as measured by the change in GDP per capita, could be explained by the development of bank credit and the financial markets. The international financial crisis of 2007-2009 reshuffled the deck. The work of Gourinchas and Obstfeld (2012) and Schularick and Taylor (2012) (and much subsequent work) showed that the expansion of bank credit was a leading indicator of banking crises. However, the link between bank credit, bank fragility and prosperity remained to be established.

This is the link that we explore with Paul Hubert in a paper entitled “Credit, bank fragility and economic performance”, to be published in the Oxford Economic Papers. This paper examines the role of bank fragility in the relationship between private bank credit and economic growth in the European Union. We consider two types of bank fragility, one in terms of bank assets, and the other in terms of liability: the share of non-performing loans on the balance sheet and, in addition, the ratio of capital to assets, i.e. the inverse of leverage.

Our results are as follows. First, bank fragility, represented by non-performing loans, has a negative effect on economic growth: the higher their share of the balance sheet, the lower the growth of GDP per capita. Second, if bank fragility is included in the estimated model, in most specifications, bank credit has no effect on economic growth. The impact of credit on per capita economic growth seems to depend on the degree of bank fragility. Credit only has a positive and significant effect on per capita economic growth in a sub-sample ending before 2008 – which is in line with previous literature – and when non-performing loans are relatively low, i.e. when bank fragility is limited. Conversely, when bank fragility is high, credit has no impact on growth, whereas non-performing loans have a significant negative effect[2].

Omitting a bank fragility variable in the relationship between bank credit and economic growth may therefore lead to erroneous conclusions about the economic impact of financial development.

The main implication of these empirical results is that closely monitoring and limiting non-performing loans – ex ante through prudent credit supply policies, or ex post through incentives to build up loan loss provisions – not only plays a prudential role at the bank level but also has an impact at the macroeconomic level. This monitoring of non-performing loans is critical for bank credit policy to have a positive impact on economic activity.

[1] See the critical summary of their work in the article by Hubert Kempf, “Diamond et Dybvig et la fragilité bancaire” [Diamond and Dybvig and Bank Fragility], forthcoming in the Revue d’économie politique.

[2] On the liability side, leverage has no impact on economic performance.


What more could the central banks do to deal with the crisis?

By Christophe Blot and Paul Hubert

The return of new lockdown measures in numerous countries
is expected to slow the pace of economic recovery and even lead to another
downturn in activity towards the end of the year. To address this risk,
governments are announcing new support measures that in some cases supplement
the stimulus plans enacted in the autumn. No additional monetary policy
measures have yet been announced. But with rates close to or at 0% and with a
massive bond purchase policy, one wonders whether the central banks still have any
manoeuvring room. In practice, they could continue QE programmes and increase
the volume of asset purchases. But other options are also conceivable, such as
monetizing the public debt.


With the Covid-19 crisis, the central banks – the
Federal Reserve, the Bank of England and the ECB – have resumed or amplified
their quantitative easing (QE) policy, to such an extent that some are viewing
this as a de facto monetization of debt. In a recent Policy
Brief
, we argue that QE cannot
strictly be considered as the monetization of public debt, in particular
because the purchases of securities are not matched by the issuance of money
but by the issuance of excess reserves. These are distinct from the currency in
circulation in the economy, since they can be used only within the banking
system and are subject to an interest rate (the deposit facility rate in the
case of the euro zone), unlike currency in circulation.

Our analysis therefore makes it possible to look
again at the characteristics of QE and to specify the conditions for monetizing
debt. It should result in (1) a saving of interest paid by the government, (2) the
creation of money, (3) being permanent (or sustainable), and (4) reflect an
implicit change in the objective of the central banks or their inflation
target. The implementation of such a strategy is therefore an option available
to central banks and would allow the financing of expansionary fiscal policies.
The government, in return for a package of fiscal measures – transfers to
households or health care spending, support for businesses – would issue a
zero-coupon perpetual bond, purchased by commercial banks, which would credit
the account of the agents targeted by the support measures. The debt would have
no repayment or interest payment obligations and would then be acquired by the
central bank and retained on its balance sheet.

Monetization would probably be more effective than QE
in stabilizing nominal growth. It would reduce the risk to financial stability caused
by QE, whose effect depends on its transmission to asset prices, which could
create asset-price bubbles or induce private agents to take on excessive debt.
Monetization has often been put off because of fears that it would lead to
higher inflation. In the current environment, expansionary fiscal policy is
needed to sustain activity and to prepare for recovery once the pandemic is
under control. A pick-up in the pace of inflation would also satisfy the central
banks, and insufficient demand should greatly reduce the risk of an out-of-control
inflationary spiral. Monetization requires stronger coordination with fiscal
policy, which makes it more difficult to implement in the euro area.


Non-performing loans – A danger for the Banking Union?

By Céline Antonin, Sandrine Levasseur and Vincent Touzé

The establishment of the third pillar of the Banking Union, namely the creation of a European deposit insurance scheme, has been blocked up to now. Some countries – like Germany and the Netherlands – are arguing that the risk of bank default is still too heterogeneous in the euro zone to allow deposit guarantees to be pooled.

Our article, L’Union bancaire face au défi des prêts non ‘performants’ [“The Challenge of Non-performing Loans for the Banking Union”], focuses on how to solve the “problem” of non-performing loans (NPLs) in a way that can break this deadlock and finally complete the Banking Union. This is a crucial step in order to restore confidence and allow the emergence of an integrated banking market.

Our review of the current situation shows that:

  1. The level of NPLs is still worrying in some countries. The situation is alarming in Cyprus and Greece, where unprovisioned NPLs represent more than 20% of GDP, whereas the situation is “merely” worrying for Slovenia, Ireland, Italy and Portugal, where unprovisioned NPLs are between 5% and 8% of GDP;
  2. In total, at end 2017, the amount of unprovisioned NPLs for the euro area came to 395 billion euros, which is equivalent to 3.5% of euro area GDP. On this scale, the “problem” of non-provisioned NPLs thus seems more modest.

Looking beyond private solutions such as debt forgiveness, provisioning, securitization and the creation of bad banks, our conclusion is that it is the public authorities at the European level who ultimately have the most effective means of action. They have multiple levers at their disposal, including the definition of the relevant regulatory and institutional framework; supervision by the ECB, which could be extended to more banks; and not least monetary and fiscal policies at the euro zone level, which could be mobilized to buy up doubtful debt or enter the capital of banks experiencing financial distress.


High-frequency trading and regulatory policies. A tale of market stability vs. market resilience

by Sandrine Jacob Leal and Mauro Napoletano

Over the past decades, high-frequency trading (HFT) has sharply increased in US and European markets. HFT represents a major challenge for regulatory authorities, partly because it encompasses a wide array of trading strategies (AFM (2010); SEC, 2010), and partly because of the big uncertainty yet surrounding the net benefits it has for financial markets (Lattemann and al. (2012); ESMA (2014); Aguilar, 2015).Furthermore, although HFT has been indicated as one potential cause of extreme events like flash crashes, no consensus has yet emerged about the fundamental causes of these extreme events. Some countries’ regulations have already accounted for HFT,[1] but, so far, this has led to divergent approaches across markets and regions.

Overall, the above-mentioned open issues call for a careful design of regulatory policies that could be effective in mitigating the negative effects of HFT and in hindering flash crashes and/or dampening their impact on markets. On these grounds, in a new research paper published in the Journal of Economic Behavior and Organization we contribute to the debate about the regulatory responses to flash crashes and to the potential negative externalities of HFT by studying the impact of a set of policy measures in an agent-based model (ABM) where flash crashes emerge endogenously. To this end, we extend the ABM developed in Jacob Leal et al. (2016) to allow for endogenous orders’ cancellation by high-frequency (HF) traders, and we then use the model as a test-bed for a number of policy interventions directed towards HFT. This model is particularly well-suited and relevant in this case because, differently from existing works (e.g., Brewer et al, 2013), it is able to endogenously generate flash crashes as the result of the interactions between low- and high-frequency traders. Moreover, compared to the existing literature, we consider a broader set of policies, also of various natures. The list includes market design policies (circuit breakers) as well as command-and-control (minimum-resting times) and market-based (cancellation fees, financial transaction tax) measures.

After checking the ability of the model to reproduce the main stylized facts of financial markets, we run extensive Monte-Carlo experiments to test the effectiveness of the above set of policies which have been proposed and implemented both in Europe and in the US to curb HFT and to prevent flash crashes.

Computer simulations show that slowing down high-frequency traders, by preventing them from frequently and rapidly cancelling their orders, with the introduction of either minimum resting times or cancellation fees, has beneficial effects on market volatility and on the occurrence of flash crashes. Also discouraging HFT via the introduction of a financial transaction tax produces similar outcomes (although the magnitude of the effects is smaller). All these policies impose a speed limit on trading and are valid tools to cope with volatility and the occurrence of flash crashes. This finding confirms the conjectures in Haldane (2011) about the need of tackling the “race to zero” of HF traders in order to improve financial stability. At the same time, we find that all these policies imply a longer duration of flash crashes, and thus a slower price recovery to normal levels. Furthermore, the results regarding the implementation of circuit breakers are mixed. On the one hand, the introduction of an ex-ante circuit breaker markedly reduces price volatility and completely removes flash crashes. This is merely explained by the fact that this type of regulatory design precludes the huge price drop, source of the flash crash. On the other hand, ex-post circuit breakers do not have any particular effect on market volatility, nor on the number of flash crashes. Moreover, they increase the duration of flash crashes.

To sum up, our results indicate the presence of a fundamental trade-off characterizing HFT-targeted policies, namely one between market stability and market resilience. Policies that improve market stability – in terms of lower volatility and incidence of flash crashes – also imply a deterioration of market resilience – in terms of lower ability of the market price to quickly recover after a crash. This trade-off is explained by the dual role that HFT plays in the flash crash dynamics of our model. On the one hand, HFT is the source of flash crashes by occasionally creating large bid-ask spreads and concentrating orders on the sell side of the book. On the other hand, HFT plays a positive role in the recovery from the crash by contributing to quickly restore liquidity.


[1] Some unprecedented actions and investigations by local regulators were widely reported in the press (Le Figaro, 2011; Les Echos, 2011; 2014; Le Monde, 2013; Le Point, 2015).


What factors are behind the recent rise in long-term interest rates?

By Christophe Blot, Jérôme Creel, Paul Hubert and Fabien Labondance

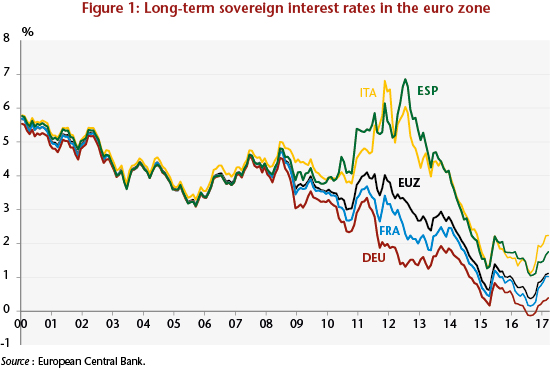
Since the onset of the financial crisis, long-term sovereign interest rates in the euro zone have undergone major fluctuations and periods of great divergence between the member states, in particular between 2010 and 2013 (Figure 1). Long-term rates began to fall sharply after July 2012 and Mario Draghi’s famous “whatever it takes”. Despite the implementation and expansion of the Public Sector Purchase Programme (PSPP) in 2015, and although long-term sovereign interest rates remain at historically low levels, they have recently risen.

graph 1

There may be several ways of interpreting this recent rise in long-term sovereign interest rates in the euro zone. Given the current economic and financial situation, it may be that this rise in long-term rates reflects the growth and expectations of rising future growth in the euro zone. Another factor could be that the euro zone bond markets are following the US markets: European rates could be rising as a result of rising US rates despite the divergences between the policy directions of the ECB and of the Fed. The impact of the Fed’s monetary policy on interest rates in the euro zone would thus be stronger than the impact of the ECB’s policy. It might also be possible that the recent rise is not in line with the zone’s fundamentals, which would then jeopardize the recovery from the crisis by making debt reduction more difficult, as public and private debt remains high.

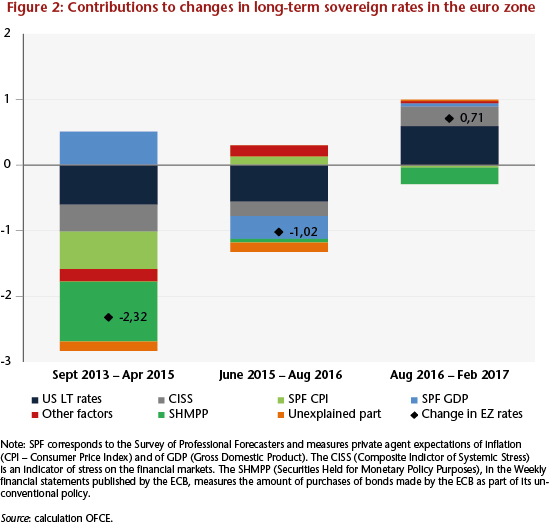
In a recent study, we calculate the contributions of the different determinants of long-term interest rates and highlight the most important ones. Long-term interest rates can respond to private expectations of growth and inflation, to economic fundamentals and to monetary and fiscal policy, both domestic (in the euro zone) and foreign (for example, in the United States). The rates may also react to perceptions of different financial, political and economic risks[1]. Figure 2 shows the main factors that are positively and negatively affecting long-term interest rates in the euro zone over three different periods.

Between September 2013 and April 2015, the euro zone’s long-term interest rate decreased by 2.3 percentage points. During this period, only expectations of GDP growth had a positive impact on interest rates, while all the other factors pushed rates down. In particular, the US long-term interest rate, inflation expectations, the reduction of sovereign risk and the ECB’s unconventional policies all contributed to the decline in euro zone interest rates. Between June 2015 and August 2016, the further decline of about 1 percentage point was due mainly to two factors: the long-term interest rate and the expectations of GDP growth in the United States.

Between August 2016 and February 2017, long-term interest rates rose by 0.7 percentage point. While the ECB’s asset purchase programme helped to reduce the interest rate, two factors combined to push it up. The first is the increase in long-term interest rates in the United States following the Fed’s tightening of monetary policy. The second factor concerned political tensions in France, Italy and Spain, which led to a perception of political risk and higher sovereign risk. While the first factor may continue to push up interest rates in the euro zone, the second should drive them down given the results of the French presidential elections.

graph 2


[1] The estimate of the equation for the determination of long-term rates was calculated over the period January 1999 – February 2017 and accounts for 96% of the change in long-term rates over the period. For details on the variables used and the parameters estimated, see the study.


Where are we at in the euro zone credit cycle?

By Christophe Blot and Paul Hubert

In December 2016, the European Central Bank announced the continuation of its Quantitative Easing (QE) policy until December 2017. The continuing economic recovery in the euro zone and the renewal of inflation are now raising questions about the risks associated with this programme. On the one hand, isn’t the pursuit of a highly expansionary monetary policy a source of financial instability? Conversely, a premature end to unconventional measures could undermine growth as well as the ECB’s capacity to achieve its objectives. Here, we study the dilemma facing the ECB [in French] based on an analysis of credit cycles and banking activity in the euro zone.

The ECB’s announcement gives us two signals about the direction of monetary policy. On the one hand, by delaying the end date of QE, the ECB is implicitly announcing that the normalization of monetary policy, in particular a hike in its key rate, will not take place before early 2018. The ECB will thus continue its expansionary policy of increasing the size of its balance sheet. On the other hand, the reduction in monthly purchases is also a sign that it is toning down its expansionary character. The announcement is similar to the “tapering” that began in January 2014 by the US Federal Reserve. Purchases of securities were cut back gradually, until they actually stopped at the end of October 2016.

The undeniably expansionary nature of monetary policy in the euro zone suggests that the ECB still considers it necessary to implement a stimulus in order to achieve its ultimate monetary policy objectives. The first of these is price stability, which is defined as inflation that is lower than but close to 2% per year. There are no signs of either runaway inflation or growth [1] [2]. The securities buyback programme should help to consolidate growth and push inflation towards the 2% target. At the same time, the liquidity issued by the central bank in its securities purchase programmes and the low level of interest rates (short and long term) are fuelling fears that monetary stability might have an adverse effect on financial stability[3].

The result leaves the ECB facing a dilemma. Putting a premature end to quantitative easing could keep the euro zone in a state of low inflation and low growth. Unnecessarily prolonging QE, while the US Federal Reserve has begun normalizing its monetary policy, could create a risk of financial instability, resulting in an uncontrolled surge in asset prices, credit, and more broadly the risk taken on by the financial system.

We assess this dual risk using indicators on the activity of the banking system of the euro zone as a whole and of the countries that make it up. Credit, whether granted to households or to non-financial enterprises, is central to bank assets and often at the heart of risks to financial instability[4]. Here we propose extending the analysis to the size of the balance sheet and to total loans granted – including credit to other monetary and financial institutions – which makes it possible to measure the risk associated with the banking system as a whole[5].

These different variables are related either to GDP, which makes it possible to capture the disconnection between banking activity and real activity, or to the capital and reserves of the banking system, which makes it possible to capture the leverage effect, i.e. the capacity of the system to absorb losses. Here we focus on quantities rather than prices, using indicators such as the ratio of credit granted on equity and the ratio of credit received on income. These are central to reflecting the transmission of monetary policy and to assessing the risk of financial instability.

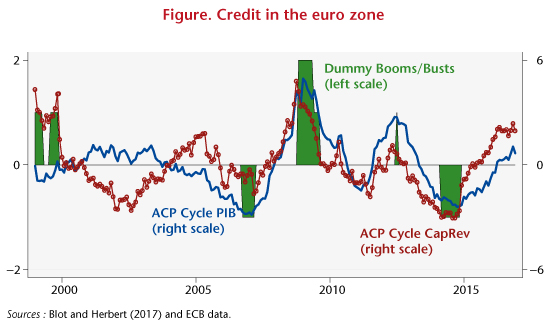
Graphe_post30-05_ENG

The graph shows the changes in the credit cycle, relative to GDP (blue line) and relative to the capital and reserves of the banking system (red line) [6]. The green areas indicate periods when credit deviates significantly above or below its long-term trend. In general, the analysis of credit and of the size of the banking system’s balance sheet points to a recovery in activity but it does not suggest either a credit boom or an excessive contraction in the euro zone in the recent period. While credit is evolving in a relatively more favorable direction relative to its trend in France and Germany, the cycle does not indicate an excessive increase. The Netherlands and Spain are distinguished by a low level of credit relative to GDP. For the Netherlands, this trend is confirmed by the indicators relative to the banking system’s capital and reserves, while in Spain, outstanding loans relative to capital and reserves are at a historically high level, suggesting an excessive level of risk-taking given the economic situation.

[1] Translation errorDespite the recent rebound in inflation, which is largely linked to the rise in oil prices and inflation expectations, inflationary pressures are still moderate, and getting inflation back to the 2% target is not sufficiently sure to warrant a change in the direction of monetary policy.

[2] Unemployment is still high, fuelling deflation.

[3] A recent analysis by Borio and Zabai (2016) of the effectiveness of unconventional monetary policy suggests that its effectiveness could decrease even as the risks involved increase. The role of asset prices has been studied by Andrade et al. (2016), showing that asset prices had reacted, as expected, following the measures taken by the ECB, and by Blot et al. (2017) on an assessment of the risk of bubbles.

[4] See Jorda et al., 2013 and 2015.

[5] Translation errorThe Basel III legislation is based on risk indicators calculated at the level of banking establishments, while our approach is based on macroeconomic indicators.

[6] Translation errorThese cycles are obtained using a principal component analysis (PCA) of several types of trend / cycle breakdowns: the Hodrick-Prescott filter, the Christiano-Fitzgerald filter, and the moving average.


The reduction of the US Fed’s balance sheet: When, at what pace and with what impact?

By Paul Hubert

US monetary policy began to tighten in December 2015, with the Fed’s key rate moving from a target range of 0 – 0.25% to 0.75 – 1% in 15 months. To complement its monetary policy, the Fed also manages the size of its balance sheet, which is a result of programmes to purchase financial stock (also called quantitative easing programmes). The Fed’s balance sheet now comes to 4,400 billion dollars (26% of GDP), compared with 900 billion dollars in August 2008 (6% of GDP). The improvement in the economic situation in the United States and the potential risks associated with QE pose questions about the timing, pace and consequences of the normalization of this unconventional tool.

The minutes of the meeting of the Monetary Policy Committee (FOMC) on 14 and 15 March 2017 provide some answers: the Fed’s procedure for reducing the balance sheet calls for not reinvesting the proceeds of securities arriving at maturity. Today, at a time when the QE programmes have not been active since October 2014 and the Fed is no longer creating money to buy securities, it is continuing to hold the size of its balance sheet constant by reinvesting the amounts of securities reaching maturity. The FOMC is to stop this policy of reinvestment “later this year” [1] and as a consequence begin to reduce the size of its balance sheet.

In accordance with the principles for policy normalization published in September 2014 and December 2015, the Fed will not sell the securities it holds, thus on the financial markets it will not modify the equilibrium situation on the stocks but only on the flows. Uncertainty remains as to the rate at which the non-reinvestment will be carried out, depending on the securities concerned by the non-reinvestment and the desired final size of the Fed’s balance sheet.

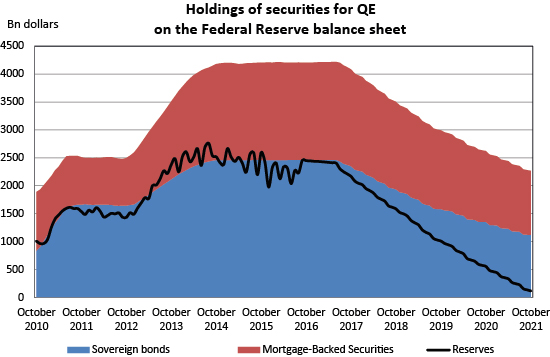
A reading of the minutes of the March meeting also indicates that “participants generally preferred to phase out or cease reinvestments of both Treasury securities and agency MBS”. In January 2017, the Fed’s economists published in FEDS Notes a simulation of the size of the Fed’s balance sheet based on the assumptions set out above. Assuming that non-reinvestment begins in October 2017, and using their data on the assets portfolio held by the Fed, the following graph was developed.


graphPHang_0905


These projections show that a non-reinvestment policy implies that the balance sheet will shrink by about 600 billion dollars a year up to October 2019, by 400 billion in the third year and by 300 billion in the fourth year. Treasury bonds will decline by 1.2 trillion dollars while holdings of MBS fall by USD 600 billion[2]. Based on these assumptions, the level of the reserves will be 100 billion dollars in October 2021, i.e. their pre-crisis level, and the Fed will have an equivalent amount of Treasury and MBS debt at that time (approximately 1,100 billion each). The question arises as to the size of the balance sheet that the central bank wishes to return to: the nominal pre-crisis amount, the amount expressed as a share of pre-crisis GDP, or a higher level (with its holding of securities serving its goals of macroeconomic stabilization and financial stability [3])? By not responding explicitly to this question, the Fed is giving itself the possibility both to adjust its target according to the reaction of the market and to take time to decide what size to target if it wishes to use this instrument on an ongoing basis.

The economic and financial impact of a decline this large in the size of the balance sheet could be limited. While private expectations about these changes in the size and composition of the Fed’s balance sheet should affect financial conditions, modifying the balance of supply and demand for financial securities, the various announcements related to this policy normalization have not had any impact as yet. Following the publication of the minutes of the last meetings of the FOMC and of the FEDS Notes describing this reduction policy, there was no reaction in interest rates or the exchange rate for the dollar or on the stock markets. Either the financial markets have not taken this information on board (because it has gone unnoticed or is not credible) or it has already been incorporated into asset prices and future expectations.

In other words, it does not seem that the coming reduction in the size of the balance sheet, if it is done on the basis of the mechanisms communicated, will tighten monetary and financial conditions beyond what is expected from the future increases in interest rates, monetary policy’s conventional instrument[4]. If this proves to be the case, normalization would indeed live up to its name. Applied to the euro zone, this would tend to show that an ultra-expansionary monetary policy is not irreversible.


[1]  More specifically: ” Provided that the economy continued to perform about as expected, most participants … judged that a change to the Committee’s reinvestment policy would likely be appropriate later this year.”

[2] Assuming that the US government’s net borrowing requirements will be about 300 billion dollars a year over these four years, the decline in the Federal Reserve’s demand for government securities will be on a similar order of magnitude.

[3] This issue has been extensively debated in the academic literature since the implementation of the QE programmes; see among others Curdia and Woodford (2011)Bernanke (2016)Reis (2017).

[4] While the reduction in the balance sheet should theoretically mainly affect long-term interest rates, the lack of a response coupled with recent increases in short-term interest rates may result in flattening the yield curve in the United States, and thus reduce the banks’ intermediation margin.


Argentina’s experience of debt crisis

By Augusto Hasman and Maurizio Iacopetta

There is still a lot of uncertainty around the possible paths that Greece can follow in the near feature. One possible path, which may be still averted by the current negotiation, is that Greece will default on the upcoming debt obligations (see graphics here for a detailed list of the upcoming Greek debt deadlines), thus spiraling into a currency and credit crisis and possibly resulting in a “Grexit”[1].

The Greek debt crisis shares some similarity with the Latin American debt crisis of the 1990s and early 2000s. In both Greece and Latin America, debts are mostly bond debts or debts to international institutions. Similarly to Greece, many Latin American countries had become more and more open in the decades before the crisis. The series of financial crises started with Mexico’s December 1994 collapse. It was followed by Argentina’s $95 billion default (the largest in history at that time, although later on Argentina resumed some of the payments), Brazil’s financial crisis (1998-2002) and Uruguay’s default (2002).

Argentina is viewed as benchmark for getting insights on the possible macroeconomic consequences of a Grexit, partly because it abandoned the peg with the dollar as a result of its mounting fiscal crisis. Nevertheless, some have pointed out at marked differences between the two economies, in terms of industry structure as well as trade composition (see here for instance).

Here, we review the different steps followed by Argentina during the crisis and propose some statistics related to developments of key economic indicators in Argentina before and after the crisis. For comparison purposes, we also provide key figures of the Greek’s economy.

Argentina and Greece at time of considerable stress

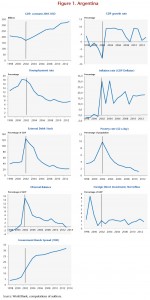
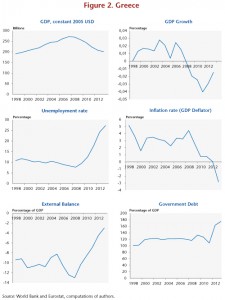
Greece entered the European and Monetary Union in 2001, meaning an irrevocably fixed exchange rate regime and the adoption of the Euro as legal tender. By early 2010, Greece risked defaulting on its public debt and had to call for a financial rescue to international institutions. On the other hand, at time of the crisis, Argentina had its currency, the peso, ‘immutably’ fixed to the US dollar on a one-to-one basis. As today’s Greek situation, when Argentina defaulted in late 2001, the country’s economy and government were both experiencing considerable stress. 2001 was the third consecutive year of serious recession for Argentina, foreign direct investment had virtually stopped, and inflation, interest rates and the budget deficit all were soaring. The IMF had provided loans to keep the peso stable, on the condition that the government would adopt fiscal and monetary discipline. Argentina’s economic problems became a serious crisis in December 2001, when the IMF denounced the government’s inability to put its financial house in order and suspended its loans. This development was followed almost immediately by a banking crisis and violent public protests that produced a rapid succession of six presidents in two weeks. Figure (1) depicts the behavior of Argentinian key economic indicators before and after the 2001 devaluation. Figure (2) shows the Greek’s indicators since 1998[2]. A quick inspection of the two figures reveals that:

-The magnitude of the decline of Greece’s GDP during the crisis, counting from its highest point in 2008 is roughly the same as that observed in Argentina during a recessionary period before the devaluation: 25%.

– The rise in the unemployment rate has been much more severe in Greece that in Argentina. In Argentina, unemployment, rose from 12.4% in 1998 to 18.3% in 2001 whereas in Greece it went up from less than 10% in 2008 to over 25% to this day. Both in Argentina and in Greece the inflation had been relatively low before the debt crisis; in fact in Greece it has even been negative in recent years. 

The recovery

What is somewhat surprising is what happened in Argentina after the crisis.

First, after a short period of turbulence, the Gross Domestic Product, in constant dollars, began to rise at an astonishing pace of almost 10 percent per year, until the 2007-08 financial crisis. Second, the unemployment rate declined from 18 percent to about 7 percent. Third, the poverty rate went down even below the level observed in the heyday of the pegged exchange rate. But financial indices deteriorated. First the difficulties in accessing external credits and the loss of credibility of the government pushed up the bond spreads from 4000 basis points before the crisis to ten times as much after the crisis. Second, the inflation rate seems to have stabilized at a double digit figure. According to some scholars (see for instance Alberto Cavallo “Online and official price indexes: Measuring Argentina’s inflation” Journal of Monetary Economics, 2012) there has been a systematic attempt by government authorities to greatly underestimate or underreport the inflation rate. Therefore, the GDP gain may not be as high as the one showed in Figure 1. Although the Argentinian economy has gone into a sustained period of growth, it would be unwarranted to make an automatic link between the renaissance of the Argentinian economy and the dramatic conclusion of the crisis with the abandonment of the peg and the debt default.

Some have pointed out that the recovery period coincided with a boom in the price of primary commodities (soybeans), which notoriously account for an important part of Argentinian exports. Clearly the increase in commodity prices has been a windfall for Argentinian agricultural producers with possible trickling effects on the rest of the economy. Yet, the magnitude of the windfall itself can hardly account for the large GDP gains. In fact, soybean was sold in Iowa at an average price of $4.57 per bushel in the year 2000 and at $5.88 in the year 2005. Only since 2010 prices have gone up substantially more, but at that point, the Argentinian economy had already gone through almost a decade of economic boom. Furthermore, the high price of soybeans in the second half of the 1990s (it was $7.32 in 1997) does not seem to have been helpful to avoid the economic depression. The route to recovery in Argentina has been characterized by setbacks, but also by a number of inventiveness that may have played a role in defraying the shock of the crisis.

Bank runs

 At the end of November 2001, rising worries about a peso devaluation and a deposit freeze, increased overnight interest rates sharply. Additionally, spreads between US Treasury bonds and Argentine government bonds increased by 5,000 basis points.  In order to stop the effects of a bank run, the Minister of Economy Domingo Cavallo announced a freeze on bank deposits. As in Greece, this measure considerably reduced the capacity of depositors to withdraw and manage their bank deposits. The deposit freeze had even accentuated the feeling among the population that a crisis was going to explode, and a series of demonstrations surged along the country. Subsequently, the IMF announced a cut of its support to Argentina, as it had failed to meet the conditions tied to the rescue program and Argentina lost its last source of funding. With a total amount of almost USD 22bn in 2000 and 2001, Argentina was the largest debtor the IMF had at the time. In the protests and raiding that followed, 24 people died. President De La Rúa and his cabinet resigned soon after these events.

Claims after the currency devaluation

 The government decided to ‘pesofy’ the loans at a rate of A$1 (Argentinean peso) for each dollar (USD) owned by banks and A$1.4 for each dollar deposited in a bank. Alternatively, people could get a government bond (Boden 2012), that paid A$775.12 for a nominal of USD$100, when the official dollar was 4.35A$/USD. A less attractive bond was issued the following year: it paid A$930 for a nominal of USD$100 but could only be converted at 8.95A$/USD.

 Massive use of money-bonds

 In 2001, different Argentinean provinces started to print their own quasi-currencies, several emergency bonds (technically called Treasury Bills for Debt Settlement) issued between 2001 and 2002. They were created as a way of alleviating the enormous financial and economic crisis that occurred in Argentina in 2001. These bonds were considered a “necessary evil” that initially allowed to cover the absence of money circulation. While at first the issuing of these quasi-currencies was controversial, it later gained acceptance partly because of the size of the issue and partly because of the magnitude of the crisis. These bonds circulated in parallel to the Argentinean peso. They could be used to pay some taxes, shopping and even salaries. As the pesos, they were denominated in different values 1, 2, 5, 10, 20, 50 and 100 to facilitate transactions (nominally equivalent to a Convertible Peso). The most popular bond was the Patacon that was issued in Buenos Aires. This bond had an interest rate of 7% and there were two series (Series A maturing in 2003, while the B in 2006). It is estimated that the total issue amount for the Patacons only reached 2.705 millions. Once the economic recovery of Argentina started in late 2003, the government honored 100% the principal of these outstanding bonds, and even the interests were eventually paid. Up to 13 quasi-currencies were issued by different provinces during that period.

Credit

 Figure (1) shows that in Argentina the “Sovereign Bond Interest Rate Spreads, basis points over US Treasuries” has been growing for the last 18 years showing the difficulties Argentina has had in accessing to international credit market. The difficult access to foreign funding has pushed the Argentinean government to get financed internally through the central bank, retirement funds and the tax agency. The high inflation that resulted from this policy (close to 26%, unofficial measures) has made the use of local credit extremely expensive for companies and households. However, as Argentina started posting large surpluses on the fiscal and current accounts after the default and large devaluation of the peso, access to foreign finance became less urgent. Argentina took a hardline approach against creditors. By 2010, 92% of the Argentine defaulted debt had been restructured. However, ongoing litigation by holdout creditors could lead to a new Argentine default in the near future.

In conclusion, the Argentina exit from the debt crisis through a default did not have long lasting dramatic consequences on real activities as many had anticipated. The crisis meant a transfer of wealth from depositors to debt holders and promoted exports. After an abrupt decline, GDP quickly started its ascent and the country experienced high rates of growth in the 2000s, which reduced significantly unemployment.

Nevertheless the period right after the devaluation was characterized by political instability, large macroeconomic fluctuations and social revolts. The political stability that followed, might have played a role in sustaining growth, but the rate of inflation climbed at double-digit figures and the various price control mechanism introduced by the government have created a lot of frictions in the business sector. Finally, the increasing isolation of the government from the international political arena partly, due to the outstanding litigation with international lenders, could, in the long run, have negative repercussion on trade.


F1_post20-07

F2_post20-07


[1] “Grexit” is a combination of “Greece” and “exit” and refers to the possibility of Greece leaving the Euro area.

[2] The plots are generated using World Bank data, except for the level of 2013 Greek debt/GDP ratio, which is taken from Eurostat.


An unprecedented retreat by the euro zone’s banks

By Anne-Laure Delatte, CNRS, OFCE, CEPR, Visiting Lecturer at Princeton University

Another small step was taken last month towards a euro zone banking union when the European Commission presented its proposal for the union’s Single Resolution Fund [1].  While observers generally agree that the 55 billion euros in the Fund are just a drop in the ocean, we show in a recent study that the euro zone’s banks are increasingly isolated from the rest of the world (Bouvatier, Delatte, 2014 [2]). In reality, the fragmentation of the euro zone’s banks that the banking union is supposed to resolve is merely one aspect of the international disintegration of Europe’s banks.

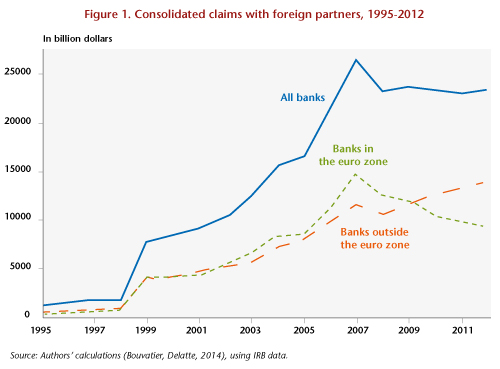
In 2013, cross-border capital flows came to only 40% of their 2007 levels, and the largest decrease in activity was in international bank lending. Figure 1 shows changes in foreign claims by the banks of 14 countries vis-à-vis their partners and breaks the data down by whether the banks are in the euro zone or not.[3]

Graphe1ENG_post10-12

The global financial crisis undoubtedly dealt a serious setback to banking activities: in 2008, foreign claims declined significantly, and then remained at this lower level. However, the aggregated situation conceals two conflicting trends. While the international activities of banks outside the euro zone were undoubtedly hit hard in 2007, they quickly began to pick up again thereafter. In contrast, the activity outside the euro zone of the euro zone’s banks has continued to fall. In 2012, the euro zone’s banks accounted for 40% of international banking activity, compared with 56% in 2007. In short, the raw data suggest:

(1)    A massive downturn for banks located in the euro zone, and

(2)    An interruption that was only temporary for banks located outside the euro zone.

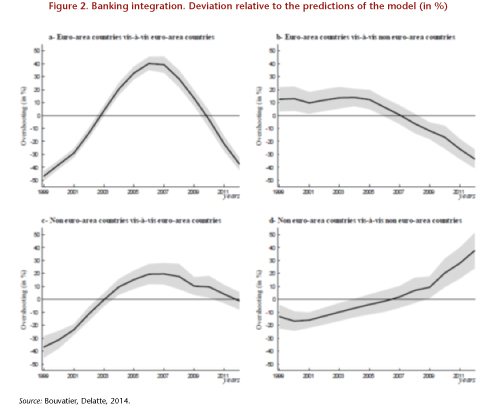
To what extent can these different trends be explained by differences in economic conditions between the euro zone and the rest of the world? The countries of Europe have in fact faced a series of crises since 2008 (the financial crisis, then the sovereign debt crisis), and today the euro zone is one of the few regions where growth has not resumed. At the same time, the past decade has resulted in a sharp increase in banking integration in the euro zone. So is this just a correction? Also, what differences are there in the way banking integration has taken place in the euro zone and in the rest of the world? To answer these questions, we have developed a unique way to measure international banking integration. Our measure is based on a statistical model of banking that can isolate frictions and variable factors over time [4]. We have extracted temporal trends by geographic region, which enables us to measure at each date where banking activity is at in comparison with the model’s predictions. The four charts in Figure 2 show our measurements.

Graphe2ENG_post10-12

First, it is striking to note that, following the financial crisis of 2008, all the trends in the euro zone were down (Figures 2-a, 2-b and 2-c), in contrast to the situation in the rest of the world (Figure 2-d). Then we see that only banks in the euro zone are going through a process of disintegration (the curve is below the x-axis in Figures 2-a and 2-b). In contrast, the exposure to euro zone debt of banks located outside the euro zone is at precisely the level predicted by the model (Figure 2-c). In other words, non-European banks are less involved in the euro zone, but this is a correction of the 20% excess existing prior to the crisis, and not a downturn. In contrast, the euro zone’s banks have massively reduced their international exposure to inside and outside the euro zone, with a level that is over 30% below the model’s predictions. Thus, the banks’ massive pull-back is not due solely to the economic slowdown in the euro zone since 2008 (as our estimates take the slowdown into account). More importantly, this decline goes well beyond a correction and indeed constitutes a significant level of disintegration. In other words, the bank fragmentation taking place in the euro zone is merely one part of a larger process of the disintegration of the euro zone’s banks.

Finally, Figure 2-d, which traces the situation in the rest of the world, highlights a surprising difference: not only has banking integration not weakened, but, on the contrary, the trend grew stronger after the crisis. In other words, the downturn in banking activity observed in 2008 in the raw data was due entirely to temporary frictions.

Based on these observations, we can draw the following conclusions. First, our estimates suggest that the euro zone’s banks have permanently lost market share at the global level. Second, it is striking to note that the banking integration achieved through the monetary union has been totally erased in recent years. In other words, the benefits conferred by the single currency have fallen in number, while the costs are continuing to rise. Finally, our results concerning the mass pull-back of the euro zone’s banks vis-à-vis the rest of the world suggest that the banking union, though crucial to supplement the single currency, will not be enough to meet the banking challenges facing the euro zone.


[1]  “Europe bancaire: l’Union fait-elle la force?”, Céline Antonin and Vincent Touze, Note de l’OFCE, no. 46, 18 November 2014.

[2] Vincent Bouvatier and Anne-Laure Delatte (2014), “International Banking: the Isolation of the Euro Area”, Document de travail OFCE, forthcoming.

[3] Among the 14 countries reporting, seven belong to the euro zone: Austria, Belgium, Germany, Spain, France, Italy and the Netherlands. The seven other countries are Canada, Switzerland, Denmark, the United Kingdom, Japan, Sweden and the United States.

[4] More specifically, we have used the approach of Portes and Rey (2005), who were the first to estimate gravity equations to study the determinants of financial activity. See Portes, R. and H. Rey (2005), “The determinants of cross-border equity flows”, Journal of International Economics 65(2), 269-296.


Why a negative interest rate?

Christophe Blot and Fabien Labondance

As expected, on 5 June 2014 the European Central Bank (ECB) unleashed an arsenal of new unconventional measures. The aim is to curb deflationary tendencies in the euro zone. Among the measures announced, the ECB decided in particular to apply a negative interest rate to deposit facilities. This unprecedented step deserves an explanation.

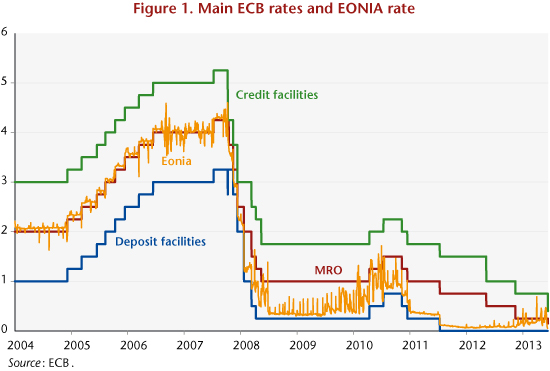
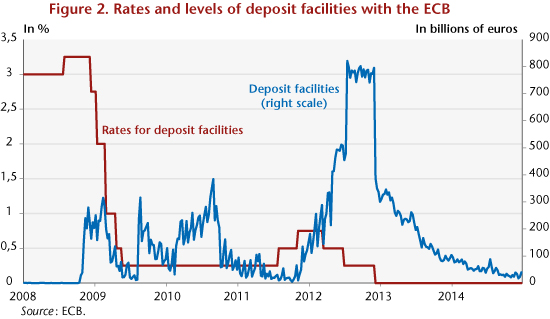
Note that since July 2012, the rate on deposit facilities has been 0%. It now falls to -0.10%, meaning that a bank depositing cash at the ECB will have its deposit reduced by that rate. Before considering the repercussions of this measure, it is worth clarifying the role of deposit facilities. The ECB’s activity is baed on loans to credit institutions in the euro zone through the channel of main refinancing operations (MRO) or long-term refinancing operations (LTRO). Prior to the crisis, these operations were conducted at variable rates based on an auction mechanism, but since October 2008 they have been conducted at fixed rates. The refinancing operation rates must allow the ECB to influence the rate charged by credit institutions for interbank loans (Euro OverNight Index Average rates, or Eonia) and, through this channel, the entire range of bank rates and market rates. To ensure the Eonia is not too volatile, the ECB provides the banks with two facilities: credit facilities, enabling them to borrow from the ECB for a period of 24 hours, and deposit facilities, enabling them to make cash deposits with the ECB for a period of 24 hours. In case of a liquidity crisis, the banks thus have a guarantee of being able to lend or borrow via the ECB, at a higher for credit facilities or a lower rate for deposit facilities. These rates can then be used to regulate fluctuations in the Eonia, as shown in Figure 1.

IMG1ENG_CBFL_2006


In practice, until the collapse of Lehman Brothers in September 2008, banks made little use of deposit facilities, indicating that the interbank market was functioning normally. The situation has radically changed since then, and the amount of deposits left with the ECB has fluctuated to a greater or lesser extent, depending on concerns over the sovereign bond crisis (Figure 2). The height of the crisis in spring 2012 coincided with a peak in the amounts deposited by the banks, which had excess liquidity. Over a period of three months, around 800 billion euros (equivalent to just under 10% of euro zone GDP), paid at 0.25%, were deposited by Europe’s banks. In the context of fear of a euro zone collapse and uncertainty about the financial situation of financial and non-financial agents, the banks have been depositing poorly compensated sums with the ECB. They chose to do this rather than to exchange the excess liquidity in the money market or support activity by lending to companies or buying shares. It was not until Mario Draghi’s statement in July 2012 that the ECB would do “whatever it takes” to support the euro zone that confidence returned and these sums fell. It was also then that the rate went down to 0%, further reducing the incentive to use the deposit facilities. The level of deposits fell by half, from 795.2 billion euros to 386.8 billion. Since then, they have declined gradually, but are still high, especially given that they receive no interest. In the last week of May 2014, there were still 40 billion euros in deposits (Figure 2).

IMG2Eng_CBFL_2006


This situation prompted the ECB to set a negative rate in order to encourage commercial banks to reallocate this money. We can be sure that once the negative rate applies, the level of deposits will quickly drop to zero. Even so, this will mean an impulse of only 40 billion euros, and further action will be needed to support the real economy. On its own, this step by the ECB has certainly not convinced the markets that it has dealt with the situation.

The ECB has thus once again demonstrated its proactive approach to curbing the risks facing the euro area. Its reaction can be compared to the response of Europe’s other institutions, which have struggled to fully take on board the depth of the crisis. Looking outside the euro zone, it is noteworthy that the US Federal Reserve and the Bank of England moved with greater speed, even though the risk of deflation was lower in the United States and the United Kingdom. This active approach is perhaps no stranger to the renewed growth seen in these countries. The ECB’s action is therefore welcome. Now we need to hope that it will stave off the risk of deflation hanging over the euro zone, a risk that could have been avoided if the euro zone’s governments had not generally adopted austerity policies, and if the ECB had taken less of a wait-and-see attitude.