By Benjamin Montmartin
France can be viewed as a unique experimental laboratory in terms of public support for investment in R&D. Indeed, since the Research Tax Credit was reformed in 2008, France has become the most generous country in the OECD in terms of tax incentives for R&D (OECD, 2018a.) In 2014, the tax credit alone represented (MESRI, 2017) a total of nearly 6 billion euros for the State, and the specific taxation scheme on patent grant revenues (15%) costs the State between 600 and 800 million euros per year. In addition to these losses in tax revenue, there are the various measures to directly support innovation (grants, loans at subsidized rates, etc.) which are financed mainly through the Public Investment Bank (BPI), the Competitiveness centres (PC), local authorities and the European Commission. This direct support accounted for around 3.5 billion euros in 2014. The total cost of all these support measures today comes to over 10 billion euros per year, almost half a percentage point of GDP.
While innovation is one of the main drivers of growth, this is not enough to justify this level of public spending. These devices must also achieve their objective. And from this point of view, the results of the empirical studies evaluating support systems for R&D and innovation are very mixed (Salies, 2018). Moreover, there does not seem to be a direct link between the generosity of States and the level of business investment in R&D. In this respect, a simple comparison between Germany and France is instructive and cannot be explained solely by sectoral differences. In 2015 (OECD, 2018b) private sector spending on R&D in France accounted for 1.44% of GDP compared to 2.01% in Germany, while public funding for these expenditures was around 5% in Germany against almost 40% in France.
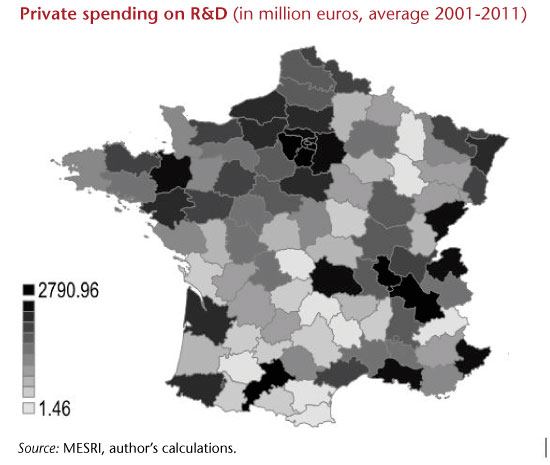
In this context, it seems necessary to better understand the performance of the French policy-mix with respect to private investment in R&D. A recent OFCE working paper reviews the effect of State aid on R&D spending by French companies. The article differs from existing studies in two main ways. First, instead of focusing on the ability of a particular instrument to generate an additionality, it simultaneously analyzes the impact of the tax credit and the various direct aids in accordance with their institutional source: local, national or European. Second, it assesses the extent to which the geographic structuring of innovation activities in France might influence the effectiveness of R&D support policies. Indeed, unlike Germany, where the geography of innovation is marked by a continuum between innovative territories (European Commission, 2014), France seems more prone to shadow effects[1], as the most innovative territories (the “hubs”) are dispersed and often surrounded by territory that is not very innovative, as shown in the figure below.
Our analysis uses data from firms aggregated at the departmental level over the 2001-2011 period and clearly shows the importance of the spatial organization of innovative activities for the effectiveness of innovation policy. Indeed, it appears that the specificity of the geography of R&D investment in France generates a negative spatial dependence, that is to say, that the hubs are strengthened at the expense of the territories lagging behind. Policies that fail to take this dependence into account will have an overall weaker effect.
And that’s exactly what our results show. Indeed, if we do not take into account this spatial dependence, it appears that the instruments studied (tax credit and the various subsidies) are as a whole capable of generating a significant additionality effect on investment in R&D. On the other hand, if we take into account this dependency, only the national subsidies seem to be able to generate such an effect. In other words, only national grants are able to generate benefits that help all the territories.
In our opinion, this result can be explained by the fact that national grants finance more collaborative projects involving actors from different territories and are therefore more likely to make use of complementarity. Conversely, the tax credit is not targeted geographically and does not particularly favour collaborative projects. Local grants primarily finance projects involving local forces, while European grants favour partnerships with foreign organisations. Thus, these last three sources of financing are more likely to encourage competition effects than complementarity effects between territories.
From a more overall viewpoint, our results therefore underline a nuanced effectiveness of the French policy-mix to promote R&D, as no policy studied seems to generate a significant windfall effect. Nevertheless, changes in the French policy-mix over the last decade, marked by a very pronounced increase in non-geographically targeted policies (tax credit) and, to a lesser extent, competitive policies (local subsidies) seems rather to indicate a decline in its ability to generate a very significant additionality effect.
[1] “Shadow effects” refer to the idea that a territory’s increasing attractiveness often comes at the detriment of other territories, due in particular to the impact of competitiveness issues.
References
Salies, E., 2018, Impact du Crédit d’impôt recherche : une revue bibliographique des études sur données françaises, Revue de l’OFCE no. 154, February 2018.
OECD, 2018a, “R&D Tax incentives: France, 2017”, www.oecd.org/sti/rd-tax-stats-france.pdf, Directorate for Science, Technology and Innovation, April.
OECD, 2018b, “OECD time-series estimates of government tax relief for business R&D”, http://www.oecd.org/sti/rd-tax-stats-tax-expenditures.pdf, April.
MESRI, 2017, “Le crédit d’impôt recherche en 2014”, http://cache.media.enseignementsup-recherche.gouv.fr/file/Chiffres_CIR/79/1/CIR_2017_chiffres2014_maquette_816791.pdf
European Commission, 2014, “Innovation performance: EU Member States, International Competitors and European Regions compared”, Memo, http://europa.eu/rapid/press-release_MEMO-14-140_en.htm, Figure 6.
Leave a Reply