A new Great Moderation?

by Analysis and Forecasting Department

This text summarizes the OFCE’s 2017-2019 forecast for the global economy and the euro zone; the full version can be found here.

Ten years after the financial crisis broke out in the summer of 2007, the world economy finally seems to be embarking on a trajectory of more solid growth in both the industrialized and most of the emerging countries. The figures for the first half of 2017 indicate that global growth is accelerating, which should result in GDP growth of 3.3% over the year as a whole, up 0.3 percentage point over the previous year. Some uncertainty remains, of course, in particular concerning the outcome of Brexit and the ability of the Chinese authorities to control their economic slowdown, but these are the types of irreducible uncertainties characteristic of an economic system that is subject to political, technological, economic and financial shocks[1]. Beyond these risks, which should not be underestimated, lies the question of the ability of the world’s economies to reduce the imbalances inherited from the crisis. While current growth is sufficient to bring down the unemployment rate and improve the employment rate, it needs to be long-lasting enough to get back to full employment, reduce inequalities, and promote debt reduction.

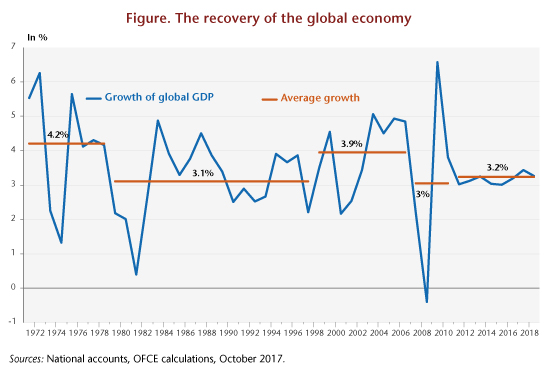
In this respect, not all the doubts have been lifted by the current upturn in the world’s economic situation. First, growth has remained moderate in light of the past recession and previous episodes of recovery. Since 2012, the global economy has grown at an average rate of 3.2%, which is lower than in the 2000s (graphic). The growth trajectory seems to be closer to what was observed in the 1980s and 1990s. This period, the so-called Great Moderation, was characterized by lower macroeconomic volatility and a disinflationary trend, first in the advanced countries, then in the emerging countries. This second element is also an important point in the global economic situation today. Indeed, the pick-up in growth is not translating into renewed inflation. The low rate of inflation reflects the persistence of underemployment in the labor market, which is holding back wage growth. It also illustrates the difficulties the central banks are having in (re)-anchoring inflation expectations on their target.

Finally, there is the matter of the growth potential. Despite numerous uncertainties about measuring growth potential, many estimates are converging on a projection of weaker long-term growth, due mainly to a slowdown in trend productivity. It should be noted, however, that the methods used to determine this growth trajectory sometimes lead to prolonging recent trends, and can therefore become self-fulfilling if they lead private and public agents to reduce their spending in anticipation of a slowdown in growth. Conversely, boosting future growth requires private and public investment. Economic policies must therefore continue to play a leading role in supporting the recovery and creating the conditions for future growth.

Graphe_post24-11-ENG

[1] See OFCE (2017): La routine de l’incertitude [in French].


From the suburbs of London to global conflagration: a brief history of emissions

By Aurélien Saussay

A new interactive map of global CO2 emissions from 1750 to 2010 is helpful in understanding the historical responsibilities of the world’s different regions for the climate crisis.

The 21st Conference of Parties (COP 21) ended on 12 December 2015 with a historic agreement. As 195 countries come to an accord on the need to limit global warming to 2 degrees by the end of the century, it is a good time to review the history of CO2 emissions since the beginning of the Industrial Revolution. Right to the end of the negotiations, the question of the historical responsibility of the different countries has remained one of the main obstacles blocking the path to a global climate agreement. The recently industrialized emerging countries and the developing countries that are just beginning their economic take-off rightly refuse to provide efforts comparable to those of the developed countries.

This feeling is confirmed by a new interactive map retracing 260 years of CO2 emissions from fossil fuel combustion and cement production on the surface of the planet[1]. This map can be used interactively to explore the emissions of each country and their distribution in space over the last two centuries, both in their entirety and per capita. It can also be used to follow trends in global emissions and the gradual consumption of the total carbon budget for holding global warming to below 2 degrees.

post aurélien

By combining historical data on emissions per country issued by the CDIAC (from 1750-2010) with decadal data on population density produced by the European HYDE project (also 1750-2010), it is possible to estimate the distribution of emissions over space and time around the planet’s surface – on a grid with a resolution of 5’ of arc (5′ being equal to 1/12th of a degree, i.e. about 10 km by 10 km at the equator).

This interactive map shows the contribution of each of the world’s regions since the mid-18th century – while at the same time offering a gripping account of the gradual spread of the industrial revolution over the last two centuries.

These data illustrate several key points that help to understand the debate about differentiated historical responsibilities:

– Up to the mid-20th century, only Europe and the United States (and to a lesser extent Japan) contributed significantly to global emissions.
– It was only in the last 30 years that, led by China, the rest of the world “turned on”.
– Driven by rapid economic growth in the emerging countries, emissions have taken off in the last fifteen years.
– When weighted by distribution of the world population, emissions are highly concentrated spatially. This conclusion is bolstered when using even finer data, notably the location of power stations and the most energy-consuming manufacturing plants (cement, aluminium, and paper, for example).

This brief history of CO2 emissions across the globe reminds us of the West’s special responsibility in the fight against global warming. The precocity of the Industrial Revolution in the West allowed the economy to take-off much earlier than in the rest of the world, but it also led to the emission of a disproportionate share of the total emissions budget that we are entitled to if we are not to exceed the target of two degrees of warming.

This differentiated historical responsibility, which was recognized by the Paris Agreement, requires Western countries to make a special effort in the fight against global warming. This responsibility must thus be reflected in a greater effort in terms of financial and technological transfers so as to ensure that the emergence of the developing countries minimizes the use of fossil fuels, without hindering their economic take-off.


[1] These emissions do not include emissions from changes in land use (LUCLUF) or fertilizer use. Unfortunately, it is very difficult to reconstruct these emissions for the period under consideration.