The participation rate and working hours: Differentiated impacts on the unemployment rate

By Bruno Ducoudré and Pierre Madec

In the course of the crisis, most European countries reduced actual working hours to a greater or lesser extent through partial unemployment schemes, the reduction of overtime or the use of time savings accounts, but also through the expansion of part-time work (particularly in Italy and Spain), including on an involuntary basis. In contrast, the favourable trend in US unemployment has been due in part to a significant fall in the labour force participation rate.

Assuming that a one-point increase in the participation rate leads, holding employment constant, to a rise in the unemployment rate, it is possible to measure the impact of these adjustments (working hours and participation rates) on unemployment by calculating an unemployment rate at constant employment and checking these adjustments. Except in the United States, the countries studied experienced an increase in their active population (employed + unemployed) that was larger than that observed in the general population, due among other things to the implementation of pension reforms. Mechanically, without job creation, this demographic growth would have the effect of pushing up the unemployment rate in the countries concerned.

If the participation rate had remained at its 2007 level, the unemployment rate would be lower by 2.3 points in France, 3.1 points in Italy and 2 points in the United Kingdom (see figure). On the other hand, without the sharp contraction in the US labour force, the unemployment rate would have been more than 3.2 percentage points higher than that observed at the end of 2017. It also seems that Germany has experienced a significant reduction in its unemployment rate since the crisis, even as its participation rate rose. Given the same participation rate, Germany’s unemployment rate would be … 0.9%. However, changes in participation rates are also the result of structural demographic factors, to such an extent that the hypothesis of a return to 2007 rates can be considered arbitrary. For the United States, part of the fall in the participation rate can be explained by changes in the structure of the population. The figure for under-employment can also be considered too high.

The lessons are very different with respect to the duration of work. It seems that if working hours had stayed at their pre-crisis levels in all the countries, the unemployment rate would have been 3.7 points higher in Germany and 2.9 points higher in Italy. In France, Spain, the United Kingdom and the United States, working time has fallen only slightly since the crisis. If working hours had remained the same as in 2007, the unemployment rate would have been slightly higher in all of these countries.

Note that the trend for working time to fall largely preceded the 2007 economic crisis (table). While this pre-crisis trend has continued in Germany and even been accentuated in Italy, working time has fallen to a lesser extent in France, Spain and the United States. In the United Kingdom, the reduction in working hours that was underway before 2007 has been cut short.

Graphe_post11-06_ENGTabe_post11-06_ENG


Labour force participation rates and working time: differentiated adjustments

By Bruno Ducoudré and Pierre Madec

In the course of the crisis, most European countries reduced actual working time to a greater or lesser extent by making use of partial unemployment schemes, the reduction of overtime or the use of time savings accounts, but also through the expansion of part-time work (particularly in Italy and Spain), including involuntary part-time work. In contrast, the favourable trend in US unemployment is explained in part by a significant fall in the participation rate.

Assuming that, for a given level of employment, a one-point increase in the participation rate (also called the “activity rate”) leads to a rise in the unemployment rate, it is possible to measure the impact of these adjustments (working time and participation rates) on unemployment, by calculating an unemployment rate at a constant employment level and controlling for these adjustments. In all the countries studied, the active population (employed + unemployed) increased by more than the general population, except in the United States, which was due in part to pension reforms. Mechanically, without job creation, demographic growth results in increasing the unemployment rate of the countries in question.

If the participation rate had remained at its 2007 level, the unemployment rate would be lower in France by 1.7 points, by 2.7 points in Italy and by 1.8 points in the United Kingdom (see figure). On the other hand, without the sharp contraction in the US labour force, the unemployment rate would have been more than 3 points higher than that observed in 2016. Germany has also experienced a significant decline in unemployment since the crisis (‑5.1 points) even though its participation rate increased by 2.2 points. Given the same participation rate, Germany’s unemployment rate would be… 1.2%. However, changes in participation rates are also the result of structural demographic factors, meaning that the hypothesis of a return to 2007 rates is arbitrary. For the United States, part of the decline in the participation rate can be explained by changes in the structure of the population. The underemployment rate might well also be overstated.

As for working time, the lessons seem very different. It thus seems that if working time had stayed at its pre-crisis level in all the countries, the unemployment rate would have been 3.9 points higher in Germany, 3.4 points higher in Italy and 0.8 point higher in France. In Spain, the United Kingdom and the United States, working time has not changed much since the crisis. By controlling for working time, the unemployment rate is therefore changing along the lines seen in these three countries.

Graph_post30-11_ENG

It should not be forgotten that there is a tendency for working time to fall, which is reflected in developments observed during the crisis independently of the specific measures taken to cushion the impact on employment through mechanisms such as short-time working or the use of time savings accounts. Since the end of the 1990s, working time has fallen substantially in all the countries studied. In Germany, between 1998 and 2008, it fell by an average of 0.6% per quarter. In France, the switch to the 35-hour work week resulted in a similar decline over the period. In Italy, the United Kingdom and the United States, average working hours fell each quarter by -0.3%, -0.4% and -0.3%, respectively. In total, between 1998 and 2008, working time declined by 6% in Germany and France, 4% in Italy, 3% in the United Kingdom and the United States and 2% in Spain, which was de facto the only country that during the crisis intensified the decline in working time begun in the late 1990s.


Beyond the unemployment rate. An international comparison since the crisis

By Bruno Ducoudré and Pierre Madec

According to figures from the French statistics institute (INSEE) published on 12 May 2017, non-agricultural commercial employment in France increased (+0.3%) in the first quarter of 2017 for the eighth consecutive quarter. Employment rose by 198,300 in one year. Despite the improvement on the jobs front experienced since 2015, the impact of the crisis is still lingering.

Since 2008, employment trends have differed significantly within the OECD countries. Unemployment rates in the United States, Germany and the United Kingdom are now once again close to those seen before the onset of the crisis, while the rates in France, Italy and particularly Spain still exceed their pre-crisis levels. Changes in unemployment reflect the gap between changes in the active population and changes in employment. An improvement in unemployment could therefore mask less favourable developments in the labour market, in terms of employment behaviour (changes in the labour force participation rate and the “unemployment halo”) or an increase in precarious employment (involuntary part-time work, etc.). In this paper we take another look at the contribution of changes in participation rates and in working time duration relative to changes in unemployment rates and to a broader measure of the unemployment rate that encompasses the “halo of unemployment” and involuntary part-time work.

Unemployment rates are marked by the crisis and reforms

With the exception of the United States, employment rates have changed considerably since 2008. In France, Italy and Spain, the employment rate for 15-24 year-olds and for those under age 55 more generally has fallen sharply (Figure 1). Between the first quarter of 2008 and the last quarter of 2016, the employment rate for 18-24 year-olds fell by 19 percentage points in Spain, by more than 8 percentage points in Italy and by almost 4 percentage points in France, while at the same time the unemployment rates in these countries rose by 9, 5 and 3 percentage points respectively. The poor state of the economy in these countries, accompanied by negative or weak job creation, has hit young people entering the labour market hard. Conversely, over this same nine-year period, the employment rate of individuals aged 55 to 64 increased in all the above countries. In France, as a result of successive pension reforms and the elimination of the job search exemption, the employment rate of older workers increased by 12.3 percentage points in nine years to 50% in Q4 2016. In Italy, even though the labour market worsened, the employment rate of 55-64 year-olds has risen by almost 18 percentage points.

fig 1

A sharp impact of the participation rate on unemployment, offset by a reduction in working time

During the course of the crisis, most European countries reduced the actual working hours to a greater or lesser extent by means of partial unemployment schemes, the reduction of overtime and the use of time-savings accounts, but also through the expansion of part-time work (particularly in Italy and Spain), including involuntary part-time work. On the other hand, the favourable trend in unemployment in the US (Table 1) is explained partly by a significant decline in the labour force participation rate of people aged 15 to 64 (Table 2). The rate in the last quarter of 2016 was 73.1%, i.e. 2.4 points less than at the beginning of 2007.

tab 1

tab 2

Assuming that a one percentage point increase in the labour force participation rate leads, holding employment constant, to a 1 percentage point increase in the unemployment rate, it is possible to measure the impact of these adjustments (working hours and participation rate) on unemployment, by calculating an unemployment rate at constant employment and controlling for these adjustments. Except in the United States, all the countries studied saw a greater increase in their labour force (employed + unemployed) than in the general population, owing, among other things, to pension reforms. Mechanically, absent job creation, this demographic growth has the effect of increasing the unemployment rate of the countries concerned.

If the labour force participation rate remained at its 2007 level, the unemployment rate would fall by 1.7 percentage points in France, 2.8 percentage points in Italy and 1.8 percentage points in the United Kingdom (Table 3). On the other hand, without the large contraction in the US labour force, the unemployment rate would have been at least 2.3 percentage points higher than in 2016. It also seems that Germany experienced a significant decline in the level of its unemployment (‑5.1 points), even though the participation rate rose by 2.8 percentage points. For an unchanged employment rate, the German unemployment rate would be 1.3% (Figure 2).

As regards working hours, the lessons seem quite different. It seems that if working time had been maintained in all the countries at its pre-crisis level, the unemployment rate would be higher by 3.4 points in Germany, 3.1 points in Italy and 1.5 points in France. In Spain and the United Kingdom, working time has changed very little since the crisis. By controlling for working time, the unemployment rate changes in line with what was observed in these two countries. Finally, without adjusting for working time, the unemployment rate in the United States would be 1 point lower.

tab 3

Note that this trend towards a reduction in working hours is an old one. Indeed, since the end of the 1990s, all the countries studied have experienced large reductions in working time. In Germany, this decline averaged 0.5% per year between 1998 and 2008. In France, the transition to the 35-hour work week resulted in a similar decrease (-0.6% per year) over that period. Overall, between 1998 and 2008, working hours were down 5% in Germany, 6% in France, 4% in Italy, 3% in the United Kingdom and the United States, and 2% in Spain.

fig 2

Beyond the “unemployment rate”

In addition to obscuring the dynamics affecting the labour market, the ILO’s (International Labour Organization) strict definition of unemployment does not take into account situations on the margins of unemployment. So people who wish to work but are considered inactive in the ILO sense, either because they are not quickly available for work (in under two weeks) or because they are not actively seeking employment, form what is called a “halo” of unemployment.

The OECD’s databases can be used to integrate into the unemployed category people who are excluded by the ILO definition. Figure 3 shows for the years 2008, 2011 and 2016 the observed unemployment rate, to which are added, first, people who are employed and declare that they want to work more, and second, individuals who are inactive but want to work and are available to do so. In Germany, the United Kingdom and the United States, changes in these various measures seem to be in line with a clear improvement in the labour market situation. On the other hand, between 2008 and 2011, France and Italy experienced an increase in their unemployment rates, especially from 2011 to 2016, both in the ILO’s strict sense of the term and in a broader sense. In Italy, the ILO unemployment rate increased by 3.4 percentage points between 2011 and 2016. At the same time, underemployment rose by 3.2 percentage points and the proportion of individuals maintaining a “marginal relationship” with employment by 1 percentage point. Ultimately, in Italy, the unemployment rate including some of the jobseekers excluded from the ILO definition came to 26.5% in 2016, more than double the ILO unemployment rate. In France, because of a lower level of unemployment, these differences are less significant. Despite this, between 2011 and 2016, underemployment increased by 2.4 points while unemployment in the strict sense grew “only” by 1 percentage point. In Spain, although there was notable improvement in ILO unemployment over the period (-3 points between 2011 and 2016), underemployment continued to grow strongly (+1.5 points). By 2016, Spain’s ILO unemployment rate was 7 percentage points higher than it was in 2008. By including jobseekers excluded from the ILO measure, this difference comes to 11.0 percentage points.

fig 3


Universal basic income: An ambition to be financed

By Pierre Madec and Xavier Timbeau

This evaluation of Universal Basic Income (UBI), the flagship proposal of French presidential candidate Benoît Hamon, highlights a potentially important impact of the measure on the living standards of the least well-off households and on inequalities in living standards. If implemented, a universal basic income would have the effect of making France one of the most egalitarian countries in the European Union. In return, the “net” cost of the programme could be high, around 45 to 50 billion euros. Given the measure’s cost, financing it through an income tax reform could make the French socio-fiscal system even more redistributive, but would lead to a considerable increase in the marginal tax rates borne by the wealthiest households.

By making it one of the flagship proposals of his election programme for the presidency, Benoît Hamon has revived the debate around a universal basic  income (UBI). It is a radical project, the subject of numerous controversies (see, for example, Allègre and Sterdyniak, 2017), so the quantification of the programme is needed. Starting from Benoît Hamon’s proposal, which has been significantly modified in recent weeks, we attempt here, using a number of important assumptions (total or partial individualization, dependence on other social benefits) to make an initial evaluation. The idea here is neither to enter into the debate as to whether the modalities of application chosen are relevant, such as the exclusion of pensioners, nor to judge how close the proposal in its present form comes to an ideal of universality. Rather the aim is to avoid this type of debate and to qualify and quantify the effects of the implementation of the UBI as proposed by the presidential candidate.

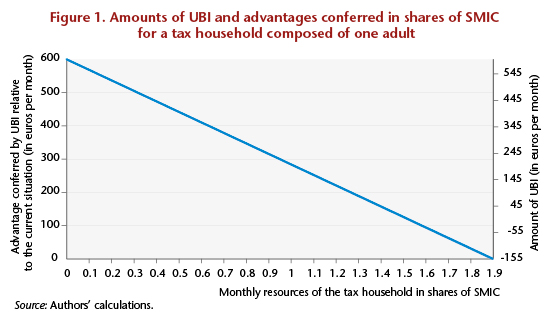
The latest version of the first step in the Universal Basic Income can be summarized as follows: “A basic income corresponds to a rise in net income that starts at 600 euros for people without resources and then disappears at 1.9 times the minimum wage (SMIC).”

Put like this, the proposal is for a differential allocation making it possible not to give rise to an artificial tax increase among those whose income situation is not changed by the universal income.

For married couples, the programme is not automatically individualized since it would still be possible to choose to maintain joint taxation. Couples with a family quotient that is less than the potential amount of the UBI should choose individualization. This is the case for couples with low incomes and not much income differential. Conversely, couples for whom the family quotient provides a bigger advantage than the basic income should choose to stick with joint taxation[1]. This would be the case for couples in which one of the individuals has a very high income and the other has no income[2].

For the most modest households the UBI replaces the RSA (income supplement for the working poor) and the Prime d’activité (working tax credit), and the calculation of social benefits (housing and family allowances, disabled adult allowance, scholarships, etc.) is not modified, as their amounts are included in the resources used to calculate the universal income.

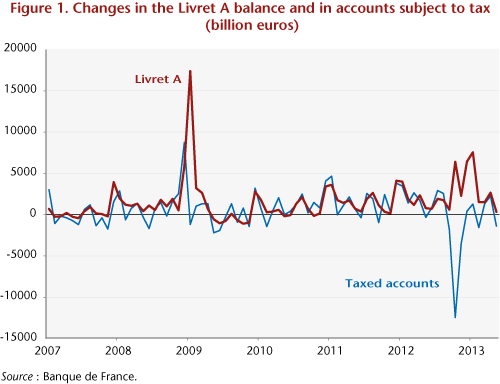
In the general framework, for all tax households whose gross resources are less than 1.9 times the SMIC, i.e. 2,800 euros gross per month, the UBI is equal to the difference between the base amount of 600 euros per month (7,200 euros per year) and 27.4% of the tax household’s gross resources. For non-taxable households, the UBI is considered a tax on negative income. For taxable households with gross resources of between 1.5 and 1.9 times the SMIC (3.8 SMIC in the case of a married couple), the UBI reduces the income tax due, thereby increasing the household’s disposable income, with this additional income cancelling out at 1.9 SMIC. The measure’s cost to the public finances for these households therefore corresponds to the difference between the amount of the UBI and the income tax currently paid. For tax households with gross resources of more than 1.9 times the gross SMIC (3.8 SMIC for married couples), the current system applies and there is no gain (Figure 1).

Formally, the monthly amount of UBI received by a tax household composed of a single adult and with resources of less than 1.9 times the gross SMIC is based on the following formula:

UBI = 600 – 0.274 x GR

GR, gross resources, corresponds to the gross taxable income, as defined in the tax code, of the tax household, increased by a factor of 1.33 used to approximate the conversion between taxable income and gross resources including charges and contributions, the tax base for the calculation of the UBI. In the case of a married couple, the UBI is calculated as follows, since the UBI as proposed is not then individualized:

UBI = [600 – 0.274 x GR/2] x 2

In order to measure the measure’s redistributive impact, we have drawn on the micro-simulation model of the DREES and INSEE known as INES ([3] see the box). As the last operational version of the model dates from 2015, the results presented must be interpreted In line with the legislation of 2015. In fact, measures such as the Prime d’activité credit, introduced in 2016, are not taken into account, in contrast to the Prime pour l’emploi in-work tax credit (PPE).

RUE

As of January 2018, people over age 18 who are still reported in their parents’ tax household and who are UBI eligible must leave their parents’ tax household in order to benefit from the UBI. It should be noted that this case is not dealt with in our evaluation, given the complexity of taking into account transfers between parents and children when they are not in the same tax household. We will therefore focus on households in which the reference person was aged between 18 and 64, i.e. 20 million households out of the 28.3 million total households in France, as the rest, pensioners, are not eligible for the measure.

The UBI has been modelled as an additional line in the calculation of income tax, with the amount of UBI being subtracted, subject to conditions of age, resources and marital status explained above, from the latter.

Subject to these assumptions, the UBI should benefit 11.6 million households in which the reference person is aged 18 to 64, at a gross cost of around 51 billion euros, i.e. an average of 4,400 euros per year and per beneficiary household.

The gross cost is not the cost to the public purse. Indeed, the implementation of the UBI would de facto lead to the elimination of the base RSA income supplement and the Prime d’activité tax credit from the tax-benefit system. In 2016, these two programmes had a fiscal cost of close to 15 billion euros (10 billion euros for the RSA and 5 billion for the Prime d’activité). Moreover, the interactions between universal income and these other social benefits are not yet completely set out in Benoît Hamon’s proposal[4]. If the amount received from UBI were to be taken into account for the calculation of the other social benefits, the amounts paid for these would fall significantly. The gross cost of universal income would remain unchanged, but savings could be realized on social benefits.

We assume here that the amount received in social benefits by the household is taken into account for the final calculation. In other words, we subtract from the amount of UBI received by the household 27.4% of the total amount of social benefits received in cash (housing and family allowance, scholarships, disabled adult allowance, etc., i.e. 32 billion euros per year for potential UBI beneficiaries). While including the benefits in the calculation of the amount of UBI is complicated by the structure of the microsimulation model, it is possible to estimate the reduction in the overall amount of UBI paid by taking into account total social benefits, about 6 billion euros.

If this option is chosen – which we assume in the absence of further clarification – UBI’s “net” cost, excluding the 18-25 year-olds fiscally reporting under their parents, would be on the order of 30 billion euros, which is close to the amount declared by the candidate, to which, once again, it will be necessary to add the amount owed to individuals between the ages of 18 and 24 who are currently reported fiscally by their parents. In 2015, of the 5.2 million individuals aged 18 to 24, 1.7 million were fiscally independent of their parents. The additional gross cost if no 18-24 year-olds were included on their parents’ tax statements would therefore be on the order of 25 billion euros, from which should be subtracted 27.4% of the scholarships (0.115 billion euros per year) and housing benefits paid (1.4 billion euros per year), as well as the tax benefits currently enjoyed by the parents of the said individuals (benefit of up to 1,500 euros per year and per child, to a maximum of 5.2 billion if all households are at the ceiling).

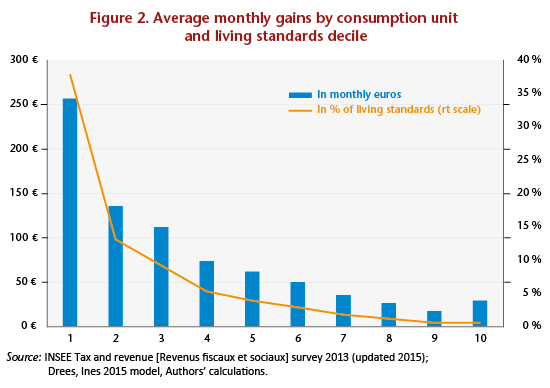
The measure, which is targeted at low-income households and not funded by an increase in household taxation or a decrease in social benefits, would have a positive impact on the bottom of the distribution of living standards (Figure 2) [5].

On average, households in the first decile of living standards should see their standard of living rise by 257 euros per month per consumption unit, i.e. a 38% increase in their average standard of living. The gain for households in the second decile should be roughly half as much, i.e. 137 euros per month per consumption unit, which represents a 13% increase in their average standard of living.

gra 2

Given that, unlike many benefits, the UBI is allocated not to households but to tax households, some members (not taxed jointly but cohabiting as unmarried couples not in PACS civil partnerships) of some households in the upper deciles of the distribution of living standards should receive the UBI (and the highest decile more than the ninth decile due to a composition effect). In other words, there are tax households with low gross incomes among households with high living standards[6].

Based on these assumptions, the median standard of living would be raised by 3.6%, and the poverty rate, i.e. the share of French households with resources under 60% of the median level, i.e. about 1,000 euros / month / consumption unit, would come to 8.5%, versus 13.4% at present. The median standard of living of the poorest households – those with a standard of living below the poverty line – would rise by 11%. The intensity of poverty, measured as the relative gap between the median standard of living of the poor and the poverty line, would also fall by a third, from 17% today to 11%.

Finally, the Gini coefficient of living standards, an indicator of inequality, would be reduced by 0.04 to a level of 0.26, thus moving France from a median situation in terms of the Gini at the European level to being among the least unequal countries – the European median of the Gini in 2015 was 0.30 (and the lowest 0.25).

Excluding the young people (aged 18-24) reported on their parents’ taxes, the net cost of the UBI would be on the order of 30 billion euros. By adding them, subject to a more detailed assessment, the net cost would be on the order of 49 billion. This is a long way from the 400 billion once bandied about, but it is still not negligible[7]. If the UBI were to be financed by a reform of personal taxation, this would lead to a considerable increase in the marginal rates of the highest deciles of the income distribution. Note that personal income tax brings in 74 billion euros annually. Another tax base, such as wealth, could also be used, but this would lead to a significant hike in wealth taxes. Property taxes and the ISF wealth tax currently bring in a little less than 30 billion euros. Moreover, the redistributive effects of the UBI – which are significant, in our assessment – would be amplified by an increase in taxation that is already progressive.

_________________________________________________________________________

Box:  The Ines micro-simulation model (Sources: INSEE, DREES)

Ines is the acronym for “Insee-Drees”, the two organizations that are jointly developing the model. The model is based on the INSEE’s Tax and Social Revenue surveys (ERFS), which include several hundred details on each individual and accurate and reliable data on income taken from tax returns. It can be used to simulate all recent legislative years using more recent ERFS years.

The model is used to carry out studies at annual intervals, but it is also used for in-depth studies in order to inform the economic and social debate in the areas of monetary redistribution, taxation and social protection. Finally, it is sometimes used to aid reflection in response to specific requests from various high government councils, supervisory ministries or control bodies (IGF financial inspectorate, Court of Auditors [Cour des comptes], Igas social inspectorate).

The Ines model simulates:

— Social charges and direct taxes: social contributions, CSG wealth tax, CRDS debt contribution and income tax (including the Prime pour l’emploi credit);

— Social benefits other than those corresponding to replacement income: personal aid for housing; the main social minima: the Revenu de solidarité active (RSA) income supplement; the Disabled adult allowance (AAH) and its complements; pension supplements and the Supplementary disability allowance (ASI); family benefits: the Family allowance (AF), the Family complement, the Back-to-school allowance (ARS) and high school scholarships, the Young child benefit (Paje) and its complements (Free choice of activity complement – CLCA – and Free choice of childcare complement – CMG), public subsidies for childcare in collective and family kindergartens, the Family support allowance (ASF) and the Disabled child education allowance (AEEH); and the Prime d’activité credit.

The main omissions relate to local taxes and subsidies (property tax, for example) and the Solidarity tax on wealth (IS). Retirement pensions, unemployment benefits and housing tax are not simulated but are presented in the data. Indirect levies are strictly speaking also outside the scope of the Ines model. The model simulates, using ranges, the different benefits to which each household is entitled and the taxes and levies that it has to pay. Ines draws on the INSEE’s Tax and Social Revenue surveys (ERFS), which bring together socio-demographic information from the Employment Survey, administrative information from the CNAF, the CNAV and the CCMSA, and details of the income reported to the tax authorities for the calculation of income tax.

Ines is a so-called “static” model: it does not take into account any changes in household behaviour, for example in terms of birth rates or labour market participation, which could be induced by changes in tax-benefit law. Since 1996, the model has been updated annually during the summer in order to simulate the most recent legislation and cover the preceding year. For example, in the summer of 2016, Ines was updated to simulate the legislation for 2015. Based on these updates, the INSEE and DREES teams contribute annually to the INSEE’s Social Portrait, in which they analyse the redistributive balance sheet for the tax and benefit measures enacted during the preceding year. The latest publication is entitled “Tax and benefit reforms in 2015 are leading to a slight redistribution from the richest 30% to the rest of the population” (André, Biotteau, Cazenave, Fontaine, Sicsic, Sireyjol).

______________________________________________________________


[1] Recall that the family quotient gives entitlement to a maximum tax reduction of 30,000 euros per year. The abolition of the family quotient would yield 5.5 billion euros (HCF, 2011) but would cost all the UBI paid to partners with a lower income who have chosen individualization.

[2] We have chosen not to take into account these tax optimization mechanisms within households, but it is understood that this means the evaluation proposed for the cost of the measure is underestimated.

[3] The source code and documentation for the INES micro-simulation model was opened to the public in June 2016 (https://adullact.net/projects/ines-libre). We have been using the 2015 open access version since 1 October 2016.

[4] In particular, the use of a micro-simulation model such as INES makes it possible to explore the consequences of different choices that can be made about the situation of the persons covered, the net redistribution effected and what has to be financed. A change in the rules for allocating or calculating a social benefit can have significant impacts on the net cost and the redistributive effects.

[5] The proposed measure significantly alters the distribution of living standards. Due to this, some households see their membership in a decile of living standards change positively or negatively. The deciles are maintained here at their pre-reform level.

[6] By way of illustration, the average age of the reference persons in households in the upper decile of the standard of living benefiting from the UBI is over 55. It can thus be assumed that these households are home to young adults who are fiscally independent but have few resources.

[7] The evaluation presented here is called “static”. It therefore does not take into consideration any possible changes in individual behaviour with respect to employment due to the impact of this measure.


2015-2017 forecasts for the French economy

By Mathieu PlaneBruno DucoudréPierre Madec, Hervé Péléraux and Raul Sampognaro

This text summarizes the OFCE’s economic forecast for the French economy for 2015-2017

After a hesitant upturn in the first half of 2015 (with growth rates of 0.7% and 0% respectively in the first and second quarter), the French economy grew slowly in the second half year, with GDP rising by an average of 1.1% for the year as a whole. With a GDP growth rate of 0.3% in the third quarter of 2015 and 0.4% in the fourth quarter, which was equal to the pace of potential growth, the unemployment rate stabilized at 10% at year end. Household consumption (+1.7% in 2015) was boosted by the recovery in purchasing power due in particular to lower oil prices, which will prop up growth in 2015, but the situation of investment by households (-3.6%) and the public administration (-2.6%) will continue to hold back activity. In a context of sluggish growth and moderate fiscal consolidation, the government deficit will continue to fall slowly, to 3.7% of GDP in 2015.

With GDP growth in 2016 of 1.8%, the year will be marked by a recovery, in particular by rising corporate investment rates. Indeed, all the factors for a renewal of investment are coming together: first, a spectacular turnaround in margin rates since mid-2014 due to a fall in the cost of energy supplies and the impact of the CICE tax credit and France’s Responsibility Pact; next, the historically low cost of capital, which has been helped by the ECB’s unconventional monetary policy; and finally, an improvement in the economic outlook. These factors will lead to an acceleration of business investment in 2016, which will increase by 4% on average over the year. Household consumption should remain strong in 2016 (+1.6%), driven by job creation in the market sector and by a slight fall in the savings rate. Fuelled by the rise in housing starts and building permits, housing investment will pick up (+3%), after shrinking for four years in a row. Foreign trade will be boosted by the impact of the euro’s depreciation and the government’s competitiveness policies, and will make a positive contribution to growth (+0.2 GDP point in 2016, the same as in 2015). Once the impact of the downturn in oil prices has fed through, inflation should be positive in 2016, but still low (1% on an annual average, after two years of virtual stagnation), a rate that is close to underlying inflation. The pace of quarterly GDP growth in 2016 will be between 0.5% and 0.6%: this will trigger a gradual closing of the output gap and a slow fall in the unemployment rate, which will end the year at 9.8%. The public deficit will be cut by 0.5 GDP point, due to savings in public spending, notably through the contraction of public investment (-2.6%), low growth in government spending (+0.9%), and the impact of the rise in tax revenues as the economy recovers.

Assuming that the macroeconomic environment remains favourable, the output gap is expected to continue to close in 2017. With GDP growth of 2%, the government deficit will fall further to 2.7% of GDP, passing below the 3% bar for the first time in 10 years. Under the impact of the government’s employment policies and the absorption of the overstaffing by companies, the unemployment rate will continue to fall, to 9.4% of the active population by the end of 2017.


Rental housing: the CAE wants to change the ALUR …

By Pierre Madec and Henri Sterdyniak

On October 24th, the French Economic Analysis Council (the CAE) published a paper proposing a new policy on rental housing in France. This paper calls into question a number of government measures in the ALUR bill currently under discussion in Parliament, such as rent control and the universal rent guarantee (the GUL) [1]. Are these criticisms justified? The authors acknowledge that the housing market is very specific, that it requires regulation, and that the state needs to build social housing and assist poor families with housing. Their differences with the policy that the current government intends to follow are thus intrinsically limited, and are more related to means than ends. The free market does not work in the area of housing. There is a need for public intervention that should aim, as we shall see, at contradictory objectives, programmes whose structure is by their very nature subject to discussion.

The existing rental housing stock: co-management and moral hazard

With regard to the private rental market, the authors in essence propose the introduction of a system of housing “flexicurity”, akin to what has been recommended for the labour market: diversification and liberalization of leases, new rights for the landlord, more flexible conditions for terminating a lease, and the development of a system of co-management of the private rental market built around a “housing authority” whose powers would extend from setting “benchmark” rents to managing leases. This “authority”, which would be jointly administered by tenants and landlords, would play a mediating role in conflicts between them, much like the prud’hommes bodies for labour disputes. The main argument used by the authors to condemn a scheme such as the GUL universal rent guarantee is that it would create significant problems with moral hazard, that is to say, the guarantee would encourage those covered to take “too many risks”. In this case, tenants, who would have a guarantee that any payment defaults would be covered by the fund, would be less concerned about paying their rent; they could therefore choose housing that is more expensive than what they really need. Owners would also be less concerned in their selection of a tenant. The authors also use the argument of moral hazard to defend the establishment of flexible leases: in their opinion, this would help in the fight against the deterioration of housing as well as in disputes with neighbours. The idea of tenants who are systematically “voluntary deadbeats” ready to degrade the housing they have leased seems simplistic and over the top. However, this idea is developed at some length by the authors. They seem to forget that the GUL will in particular cover tenants who are unable to pay their rent because of financial hardship (unemployment, divorce, etc.). This guarantee above all offers new protection for the owner – protection funded equally by landlords and tenants through a pooling system. In case of failure to pay rent, the landlord will be reimbursed directly from the fund. The latter will then examine the tenant’s situation and proceed either with a mandatory collection or personalized support if the tenant is genuinely unable to pay. The GUL should allow landlords to rent to people who are in vulnerable situations (workers in precarious jobs, students from low-income families), without the latter needing to come up with deposits. Owners would have less incentive to seek safe tenants (civil servants, students from better-off families, employees of large companies). The State is fully within its role by covering a social risk that has been aggravated by the crisis and growing job insecurity. Isn’t this worth the fantasized risk of an increase in moral hazard? The matter of the lease raises a question of substance. Should encouragement be given to the development of individual landlords, which inevitably generates friction between on the one hand the owner’s concern to freely dispose of their property and be as certain as possible that the rent will be paid and on the other hand the tenant’s concern to enjoy a secure tenure and their demand for the right to housing? A household with a low or irregular income, which is thus more vulnerable, must also be able to find housing in the private sector. It may also seem preferable either to encourage institutional investors to invest in this sector or for households to make greater use of collective investment in housing and set up mechanisms such as the GUL, which can collectively address the issue of non-payment of rent. Housing is far from being an ordinary good. It is, and the authors do point this out, above all an essential need, a fundamental right. The massive casualization of housing through the establishment of a system of liberalized leases cannot be the solution. On the contrary, authors drawing on the German model, on the introduction of open-ended leases (the standard lease in Germany), constitute a major advance in terms of the tenant’s security [2].

Rent control versus the law of the market

With regard to rent control, the authors rely on a number of studies in order to demonstrate the existence of a correlation between the state of degradation of the rental stock and rent control measures. However, the ALUR law contains provisions for taking into account any renovations undertaken. There is of course a continuing risk that the stock will deteriorate, but once this has been spelled out, we should also mention the equally likely result that the stock could improve precisely due to this provision for taking renovations into account. The authors also develop the idea that control measures will lead to a significant decrease in residential mobility. While this is a real risk for programmes designed to regulate rents during the lease and not upon re-letting (the main cause of the growing inequality in rents observed in France since the 1989 Act), the rent control provisions in the ALUR law are, on the contrary, designed to lead to a convergence in rents [3]. This convergence, although modest, given the large gap still allowed (over 40%), will tend in the direction of greater mobility. In reality, the most important risk raised by the authors is that the number of dwellings available for rent might fall. Although it seems unlikely that landlords already on the market would massively withdraw their rental properties [4], rent control measures could discourage new investors in the rental market because of the resulting decline in yields. This would exacerbate the supply / demand imbalance in high-pressure areas. In practice, this seems unlikely. Even if there were a significant drop in the number of new investors, those already present on the existing market, given the lease conditions (and contrary to the authors’ expectations), cannot easily sell their property, except to a new investor who in light of the fall in yields will demand lower prices. The tax incentive schemes (Duflot type) currently in force on the market for new housing suggest that landlords who invest will be only slightly affected by rent control. Some investors may nevertheless turn their backs on the construction of new housing, which, in the short term, would tend to push down property prices [5], thus encouraging homeownership and a fall in land prices. The public sector would however have to be ready to take over from private investors. Nearly one in three households in the first income quartile (the poorest 25%) is a tenant in private housing and is subject to a median housing burden, net of housing assistance, of 33%, an increase of nearly 10 percentage points since 1996. Rent control above all offers protection for these low-income households – households that, given the stagnation in social housing and the increasing difficulty in getting on the property ladder, have no choice other than to rent housing in the private sector. As the approach proposed by the Duflot Act consists of “putting in place a rent control framework to cut down on landlords’ predatory behaviour. Not seeking to try to attract investors based on exorbitant rents and expectations of rising real estate prices” does not seem illegitimate if it is actually accompanied by an effort in favour of social housing. Pressure on the housing market (where supply and demand are rigid) has permitted high rent increases, which is leading to unjustified transfers between landlords and tenants. These transfers hurt the purchasing power of the poorest, the consumer price index, competitiveness, and more. Conversely, these increases can stimulate the construction of new housing by pushing up the value of property, but this effect is low and slow (given the constraints on land). Rent control can help put a stop to rent increases, even if it undermines incentives for private investment in housing to some extent. It cannot be excluded a priori.

Social housing mistreated

Even though the authors’ observations seem fair – social housing does not play its full role, and the systems of construction and allocation are complex and inefficient – the solutions that they propose are less so, and are not very consistent. The debate on the role and place of social housing in France is old. Should it be reserved for poor households, thus abandoning the goal of social diversity? If this is done, should the eligibility ceilings be reduced, even though today more than 60% of the population might be entitled to social housing? Should social housing be profitable? Is there a sufficient supply of it? The idea put forward by the authors, according to which the State, through subsidized loans to housing agencies (HLMs), is to take care of housing only the poorest households, and must leave housing for the working and middle classes to competition (promoters and private investors), is open to criticism, especially in these times of economic crisis. What is needed, on the contrary, is to increase the share of social housing as well as intermediate housing at “moderate” rents that is built with public funds to house the lower classes at reasonable rents and reduce tensions in critical areas. The authors’ idea that social housing is not a right to be granted ad vitam aeternam seems justified. In 2006, according to the INSEE, more than one out of ten tenants in social housing belonged to the fifth quintile (the richest 20%). Unless one believes that social housing should, in accordance with the principle of social diversity, be open to all, then it is necessary to strengthen measures to encourage these households to leave social housing and direct them to the private sector, or accession needs to be tightened, as the additional rental charges currently applied are not effective enough. But the age of the occupants has to be taken into account, along with the availability of nearby housing at market rents. For housing the lower and middle classes (that is to say, “profitable” operations), the authors also suggest developing competition between private agents (developers, private builders, etc.). Once the amortization period of the loan from the Caisse des Depots et Consignations (CDC) expires, the housing thus built could change status and either switch into the private sector or be sold. This idea gives the impression that the shortage of social housing is the consequence of a lack of available funds. However, thanks to the amounts deposited in Livret A savings accounts, there is no lack of money. The brakes on housing construction are to be found elsewhere (lack of political will, lack of land, etc.). Even tType text or a website address or translate a document. hough it is necessary to fight against urban segregation and the way to do this is by “disseminating poor households throughout the urban fabric”, the proposals of the authors of the CAE note are not realistic. The index of spatial segregation proposed (see Box 10 in the working paper) would lead to no longer building social housing in areas where it is already significantly concentrated. However, given the land constraints in high-pressure areas, this is not feasible. The objective of the fight against segregation should not take priority over the goal of construction but complement it. Public funding that is rigidly conditioned on the value of one or two indicators, even the most transparent ones, as proposed by the authors, would be extremely complex to implement. The SRU law establishing identical goals for communes with very different characteristics needs to be amended. Social housing needs to be built in accordance with need and demand. Currently, however, there is no match between supply and demand even in the less problematic areas (housing too big or too small, too old, etc.). According to the INSEE, 14% of social housing tenants are thus in a situation of over-occupation (twice the proportion seen in the private sector). Not only is entry into social housing difficult, but so is mobility within the sector. It is thus necessary to build social housing massively not only to accommodate new populations but also to house current social housing tenants in better conditions. Should the housing issue be de-municipalized? It is certainly a mistake to leave urban decision-making (and action) up to the municipalities alone, as some may be encouraged to give preference to selling off the available land to private developers rather than to housing agencies, whether this is directly for financial reasons or in an effort to attract a relatively affluent population without social problems. Housing policy thus requires strong incentives for the construction of social housing, including aid specifically for the municipalities where it is located, along with legal constraints and compensatory taxation targeted specifically at towns that have no social housing. The SRU Law is necessary. Note that proposals along these lines are difficult to get adopted at the political level. Thus, the measure to provide for inter-communal decision-making power regarding in particular the Local Urbanism Plan (PLU), a provision in the ALUR law, was largely rejected by the Senate, with the support of the Minister of Housing [6]. Similarly, the Union sociale pour l’habitat (social housing union), while deploring the lack of social mobility in the sector, regularly opposes any significant changes to the allocation process that could lead to greater mobility, with each organization striving to protect its own criteria.

Rent and housing aid between taxation and imputation

In the CAE note, the way the tax system takes account of housing costs is the subject of questionable proposals. We agree of course with the starting point: it would be desirable to achieve a certain tax neutrality between income from financial capital and implicit rents. This is necessary from the point of view of both economic efficiency (not to overly encourage investment in housing) and social justice (given equal taxable income, a landlord and tenant do not have the same standard of living). But we believe this can be done effectively only by taxing implicit rents. It is difficult to undertake such a reform today, when substantial tax increases have already occurred. It would be difficult to introduce a new tax. This would therefore have to be accompanied by an upward translation of the tax brackets, so that, if owners pay more, tenants pay less. This could, furthermore, divert some households from building housing; the proceeds would be used in part for the construction of housing, which is inconsistent with the previous proposal to use these to reduce tenants’ taxes. This would thus have to be introduced only very gradually. First the property tax bases would be re-valued. Then this database (from which landlords accessing it could deduct borrowing costs) could be used to tax the rental values at the CSG (wealth tax) or IR (income tax) rates (with some deduction). Fearing that this measure would be unpopular, the authors suggest that tenants could deduct their rent from their taxable income (with a relatively high ceiling of around 1000 euros per month). This proposal is not acceptable: – it is arbitrary: why not also deduct, still with ceilings, spending on food (no-one can live without eating) or on clothing, transportation or mobile phones (now indispensable). This could go on forever. The IR tax scales already take into account the need for a minimum income level (for a couple with two children, taxation only kicks in above a wage income of 2200 euros per month). The authors’ measure would privilege housing costs over other spending, with little justification; – the tax savings achieved in this way would be zero for non-taxable persons, and low for those near the taxation threshold: a family with two children and an income of 3000 euros per month with 600 euros in rent would pay 700 euros less tax; a wealthy family taxed at the marginal rate of 45% could save 5400 euros in tax, or 450 euros per month, that is to say, more than the housing benefit of most poor families; – the measure would be very costly. The authors do not give us a precise estimate, but lowering the taxable income of 40% of the 18 million taxable households in France (the proportion of tenants) by 10,000 euros could reduce IR tax revenue by 14 billion. In fact, this must necessarily be offset by a downward translation of the tax brackets. At the end, here, too, if the tenants pay less, the landlords pay more. Furthermore, the measure would be less effective economically than the taxation of implicit rents, since it would introduce a bias in favour of housing costs and does not take into account the value of the property occupied. The authors propose integrating the housing allowance into the IR tax and having all this managed by the tax administration, which would be responsible for developing a coherent redistributive policy on behalf of people on low incomes. While the current system of housing assistance can of course be improved, once again the authors’ analysis is one-sided, and does not include all the aid given to the poorest (the “RSA socle” – basic income supplement for the unemployed; the “RSA activité” – income supplement for the working poor; and the “PPE” – in-work negative income tax). They forget that helping low-income people requires personalized support, in real time, on a monthly or quarterly basis, which the tax administration is unable to provide. In fact, they wind up with a system that is hardly simplified: the tax authorities would determine housing assistance for non-taxed households that the CAF Family Allowance fund would pay monthly and which would be adjusted by the tax administration the following year. But it is left unsaid whether the same formula would apply to the RSA income supplement. For taxable persons, the assistance would be managed by the tax authorities. The authors tell us that, “the aid could not be less than the current housing allowance”, but their proposal would greatly increase the number of untaxed households for whom it would be necessary to compare the tax savings and the allowance using the old formula. This is not manageable. It would of course be desirable to simplify the calculation of the housing allowance and to better integrate it with the RSA income supplement. This should be included in a reform of the RSA that the government needs to undertake (see the Sirugue report and the criticism of it by Guillaume Allègre), but the overall arrangement must continue to be managed by those who know how to do this, the CAF family fund, and not the tax authorities.

Readers interested in housing-related issues should see the Revue de l’OFCE “Ville & Logement”, no. 128, 2013.


[1] Trannoy A. and E. Wasmer, « La politique du logement locatif », Note du CAE, n°10, October 2013 and the document de travail associé [both in French].

[2] Note that the German market is very different from the French market (majority of renters, little demographic pressure, etc.), and that its rules cannot therefore be transposed.

[3] Currently, in the Paris region and more generally in all the so-called high-pressure neighbourhoods, the difference in rent between those who moved during the year and tenants who have been in their homes over 10 years exceeds 30% (38% for Paris) (OLAP, 2013).

[4] Indeed, “old” investors potentially have higher rates of return than do “new” investors.

[5] As the number of new households is tending to fall (Jacquot, 2012, “La demande potentielle de logements à l’horizon 2030”, Observation et statistiques, N°135, Commissariat au Développement Durable).

[6] An amendment according a low level for a blocking minority to France’s “communes” during changes to the PLU (25% of communes and 10% of the population) was adopted by the Senate on Friday, 25 October – an amendment thereby reducing in practice inter-communal authority in this area.


Rent control: will the ALUR law be sufficient?

By Sabine Le Bayon, Pierre Madec and Christine Rifflart

On 10 September 2013, Parliament began discussing the bill on “Access to housing and urban renovation [“Accès au Logement et un Urbanisme Rénové” – ALUR]. This legislation will result in stepped-up state intervention in the private rental market and complements the government decree that took effect in summer 2012 on rent control in high-pressure areas. This was an initial step in the government’s effort to curb the increase in housing costs being faced by renters. [1]

The government’s willingness to regulate the excesses of the private rental market is expected to have a rapid impact on households moving into a new home. For sitting tenants, the process is likely to take longer. In a city like Paris, we can expect that, if the highest rents decline to the ceiling set by law, average rents will fall by 4 to 6%. If through a ripple effect this then affects all rents, the deflationary impact would be greater. On the other hand, the risk of an upward drift for lower rents cannot be discarded, even if the government argues otherwise. Ultimately, the impact of the law will depend in large part on the zoning defined by the rent monitoring “observatories” that are currently being set up.

The regulatory decree: a visible, but minimal, impact

The latest annual report of the rent observatory for the Paris region [the Observatoire des loyers de l’agglomération parisienne – “OLAP”] [2] sheds some initial light on the decree’s impact on rent control. To recap, the decree holds rents upon re-letting to a maximum of the pace of the legal benchmark (the “IRL”), unless substantial work has been performed (in which case, the increase is unrestricted). Between 1 January 2012 and 1 January 2013, 51% of Paris residences offered for re-letting saw their rent increase faster than the IRL, despite the absence of substantial work. This share was lower than in 2011 (58.3%) and 2010 (59.4%), but remains close to the level observed between 2005 and 2009 (50%), prior to the existence of the decree.

The impact derived from monthly data seems a bit more conclusive. Thus, over the period from August to December 2012 when the decree was implemented, the share of rentals offered for re-letting that rose faster than the IRL cap fell by 25% on average over a year, against only 8% for the months from January to July 2012 compared to the same period in 2011.

The decree therefore does seem to have had an effect, by helping to reduce the share of rents that increased faster than the IRL cap by about 18%. However, given that if there had been full compliance with the decree no rentals would have risen more than the IRL, the impact has still been inadequate. Several factors already identified in a working document may explain this: the non-existence of benchmark rents, a lack of information about both owners and tenants, a lack of recourse, etc. One year on, it would seem that these shortcomings had a negative impact on the measure’s implementation.

A law on a larger scale

The major innovation of the ALUR law concerns the regulation of the level of rent in high-pressure areas, whereas previous decrees focused on changes in rents. Henceforth, a range of permissible rent levels will be set by law, and the decree will then regulate the maximum permitted changes [3]. To do this, every year the government sets by a prefectural decree a median benchmark rent per sq.m, per geographic area (neighbourhood, district, etc.) and per type of accommodation (one-bedroom flat, two-bedroom, etc.). So:

– For new lets or re-lettings, the rent cannot exceed the cap of 20% over the median benchmark rent, called the upwards adjusted median benchmark rent, except by documenting an exceptional additional rent (for special services, etc.). After that, any increase may not exceed the IRL, in accordance with the regulatory decree for high-pressure areas (except if there is major work);

– Upon renewal of the lease, the rent may be adjusted upwards or downwards depending on the upwards adjusted or downwards adjusted median benchmark rent [4]. Thus, a tenant (or a lessor) may bring an action to decrease (or respectively, to increase) the rent if the latter is higher (or lower) than the median rent as adjusted upwards (or downwards). In case of an increase in the rent, a mechanism for staggering this increase over time is set up. If there is a disagreement between tenant and landlord, an amicable settlement process may be initiated prior to referral to a judge within a strictly determined timeframe. Within this range, the increase is limited to the IRL;

– During a lease, the annual rent review is currently performed as now, on the basis of the IRL;

– Furnished rentals will now be covered by rent control: the prefect will set a higher benchmark rate and any change will be limited to the IRL.

The introduction of these median benchmark rents represents three major advances. On the one hand, they will be calculated from the information gathered by the rental observatories about the entire rental housing stock, and not simply from vacant housing available for rental, i.e. what is called the “market” rent. This so-called market rent is almost 10% above the average of all rents, which itself is above the median rent. This calculation method will therefore inevitably lead to lower rents (both market and average).

Similarly, choosing the median rather than the average as the benchmark rent should make for greater stability in the measure. In the event that all rents more than 20% above the median (i.e. above the upwards adjusted benchmark rent) are reduced and all other rents remain unchanged, the median remains the same. In the case of an adjustment of all rents, the median would fall, but in a lesser proportion than the average, which by definition is more sensitive to changes in extreme values.

Finally, the obligation to include in the lease both the median rent and the upwards adjusted median benchmark rent, the last rent charged and, where relevant, the amount and nature of any work performed since the last contract was signed, provides for greater transparency and a stricter regulatory framework, which should result in greater compliance with the measure.

What changes should be expected?

In 2012, out of the 390,000 residences put up for rent in Paris, 94,000 have a rent higher than the upwards adjusted median rent (3.7 euros / sq.m more on average) and 32,000 have a rent that is more than 30% below the median benchmark rent (2.4 euros / sq.m less on average). Since only rents above the upwards adjusted median rent are to be corrected, the reduction in the average rent would be 4% to 6%, depending on the area and type of housing. This reduction, although not insignificant, would at best permit a return to the rent levels recorded in 2010, before the steep inflation seen in 2011 and 2012 (+7.5% between 2010 and 2012). This adjustment in rents could nevertheless take time. Owners and tenants could easily exercise their rights at the time of a re-letting [5], but revaluations at the time of a lease renewal may take longer to realize. Despite access to information and a regulatory environment that is more favourable to the tenant, the risk of a conflict with the landlord and heightened competition in the rental market in areas where the law applies may still deter some tenants from asserting their rights.

The issue is much more complex for the 32,000 residences with rents below the downwards adjusted benchmark rent. While the quality of some of this housing can justify the difference (insalubrious, location, etc.), it is also clear that the main factor behind the weakness of some rents is the tendency of tenants to be sedentary. Thus, according to the OLAP rent observatory in Paris, the average rent for housing occupied for over 10 years by the same tenant is 20% lower than the average rent for all lets. The question thus arises of re-valuing these rents. Indeed, during a new let or a lease renewal the law allows owners to reassess up to the level of the downwards adjusted median rent – which is also in contradiction with the decree [6]. Once this level has been reached, future changes shall not exceed the IRL.

Eventually, then, some units with similar characteristics will therefore be on the market at very disparate rents, thus penalizing landlords with sedentary tenants. In contrast, tenants who have lived in their homes for a long time might well see significant revaluations in their rent (over 10%). The housing cost burden [7] on these households could thus rise, pushing those facing excessive budget constraints to migrate to areas experiencing less pressure.

Nevertheless, the possibility of revaluing the rent to the level of the market rent in case of an obvious undervaluation is already provided under existing law, i.e. the Act of 6 July 1989 (Article 17c), at the time the lease is renewed. In 2012, in Paris, 3.2% of owners made use of this article. With the new law, while readjustments should be more numerous, the inflationary impact should be weaker as the benchmark (the downwards adjusted median rent) is well below the market rent.

From this point on the issue of zoning is central: the more refined the breakdown, the more the benchmark rents will correspond to the actual characteristics of the local market. In the event of a larger division of the territory, the median benchmark rents may be too high for the less expensive neighbourhoods and too low for the more expensive ones. Meanwhile, low rents will not be re-valued much in the expensive neighbourhoods, and even less so in the others. This could lead to more “inter-neighbourhood” convergence in rents – regardless of local conditions – and less “within-neighbourhood” convergence, which would have adverse consequences for both landlord and tenant.

The impact on rents of the law currently under discussion could be all the greater given that property prices began to fall in France in 2012 and the current sluggish economy is already slowing rent hikes. But it should not be forgotten that only the construction of housing in high-pressure areas (including via densification [8]) will solve the structural problems of the market. Rent control measures are merely a temporary measure to limit the increase in the housing cost burden, but they are not by themselves sufficient.


[1] For more information, see the blog “Rent control: what is the expected impact?

[2] The territory covered by this report is composed of Paris and what are called the “petite couronne” and the “grande couronne” (its near and far suburbs).

[3] As the rent control decree does not cover the same field as the law (38 urban areas versus 28), some areas will be subject to the control only of changes, and not of levels.

[4] While the bill is unclear on the calculation of the downwards adjusted benchmark rent, an amendment adopted in July by the Commission of the Assembly proposed that this should be at least 30% lower than the median benchmark rent. Another amendment clarifies that in case of an upward adjustment, the new rent shall not exceed the downwards adjusted median rent.

[5] In 2012, only 18% of residences on the private rental market were subject to re-letting.

[6] During the renewal of a lease or a re-letting, the rent control decree permits the owner to re-value their rent by half the gap between the last rent and the market rent.

[7] This is the share of household income spent on housing.

[8] On this subject, see the article by Xavier Timbeau, “Comment construire (au moins) un million de logements en région parisienne” [How to build (at least) one million residences in the Paris region”], Revue de l’OFCE no. 128.


Livret A accounts – drowning in criticism

By Pierre Madec

As the Governor of the Bank of France and the Minister of the Economy and Finance announced a further (probable) reduction in the interest rate on Livret A accounts for August 1st, the rating agency Standard&Poor’s (S&P) released a study of the French banking system. The U.S. agency argues that Livret A accounts, and regulated savings more generally, “penalize French banks” and are at the root of “distortions in the banking market”. This debate, which is hardly new, has been the subject of a number of reports: Duquesne, 2012; Camdessus, 2007; Noyer-Nasse, 2003, and more. Some ardently defend the peculiar French approach represented by Livret A, while others advocate, on the contrary, a deep-going reform of a system they describe as “lose-lose”.

So what’s the actual situation? Do Livret A accounts really threaten the French banking system? How are the household savings deposited in them used? What has been the impact of the series of increases in the ceilings on deposits? What will be the impact of the (probable) new rate cut proposed by the Minister of Economy and Finance, Pierre Moscovici, both for savers and for the financing of social housing? We provide a few answers below.

What are Livret A accounts?

Livret A accounts date from almost 195 years ago. They are a regulated investment that gives the right to a fiscal benefit (exemption from all taxation and social charges), with guaranteed deposits at a rate set by the State [1].

In 2011, the French savings rate was 16% on average, which was 1.1 points higher than in 2006. The increase in the savings rate went largely into regulated savings, and especially into Livret A accounts, which are held by 63.3 million French people, with total savings of 230 billion euros in April 2013, twice the level of January 2007. Three successive developments contributed to this massive increase in total holdings: the financial crisis, which redirected a portion of household savings into risk-free investments; the widespread distribution of Livret A passbooks to all banks after 1 January 2009, under the Act to modernize the economy [2]; and finally, the 50% increase in the ceiling on Livret A accounts, which took place in two stages (in October 2012 and January 2013). This growing attraction for Livret A is also due to the full liquidity of the accounts and the deposit guarantee – neither of which is available, for example, for life insurance.

What is the role of Livret A accounts?

One of (many) specific features of the French model for financing housing is (among others) that providers of social housing do not draw on the bond markets (Levasseur, 2011). Social landlords are therefore financed mainly (73% in 2012) by the Caisse des Depots et Consignations (CDC), where a portion of household’s Livret A savings are deposited. The CDC operates a savings fund that centralizes 65% of Livret A holdings, which in April represented more than 150 billion euros (Banque de France). The deposits made available are used primarily for lending for social housing and urban policy [3]. These borrowings are largely used for the construction, acquisition and rehabilitation of social rental housing by social landlords (HLM bailleurs), but they can also be used to finance specific housing operations and urban policy measures such as the National urban renovation plan (“NERP”). In order to secure the deposits and ensure the savings fund has the amounts needed, the amount of deposits centralized under Livret A funds must always be greater than or equal to 125% of the outstanding loans for social housing and urban policy granted by the CDC.

It is obvious that the target of building 150,000 social housing units per year (compared to 105,000 in the year 2012) will give rise to a significant increase in the sector’s financing needs [4]. To meet this goal, 13.7 billion euros in lending for social rental housing will need to be granted for one year in 2013, i.e. 4 billion more than in 2012.

Finally, the Livret A resources that are not centralized by the CDC (80 billion euros) are subject to a “duty of use”. Eighty percent must be used by the banks for financing SMEs while 10% must be used to finance energy savings measures in existing buildings [5]. Similarly, a certain number of local government investment programmes (Campus Plan, 2012 Hospital plan, Grenelle Environment programme) have benefited from Livret A funds.

Are Livret A accounts endangering the French banking system?

Given the increasing interest of households in regulated savings (especially Livret A), one might think (like S&P) that this type of investment threatens the banking system by depleting bank liquidity, which has already been undermined by the crisis. The higher ceilings established ​​in recent months have indeed led – in essence – to a transfer of savings to tax-exempt investments, whose share in total household financial savings increased by 0.6 percentage point between 2011 and 2012. In October 2012, there was a significant drop in savings accounts subject to tax (‑12 billion euros), a drop that can be explained in part by the higher ceilings on Livret A accounts (+6 billion euros) [6] (see Figure 1).

graph1_1707PMblog-English


It is important to put S&P’s alarmist declarations into perspective – on the one hand, because, except for the month of October 2012, the flow from taxed accounts has been relatively stable, and on the other hand, because in 2012 regulated savings, although up significantly, accounted for only 9.5% (6.2% of which for Livret A) of total household financial savings, which amounted to 3,664 billion euros. In addition, if there were a real and lasting lack of liquidity, technical adjustments exist or can be made. According to the latest annual report of the Cour des comptes (French Court of Auditors), at the beginning of the year the coverage ratio of savings deposits was 156% of outstanding loans to social housing and urban policy, instead of the regulatory 125%. This over-coverage represents about 50 billion euros, which are allocated neither to the financing of social housing nor to bank liquidity. Now claimed by the banks, these funds are to be quickly allocated. As the savings fund has substantial liquidity, while leaving unchanged the ratios of coverage and of centralization (the fruit of bitter negotiations), it is clear that a number of temporary transfer mechanisms between the savings fund and the banking sector could quickly deal with any risk of a liquidity crisis. Finally, note that the banks have also benefited from the more widespread distribution of Livret A, notably through the payment by the savings fund of a commission on the amounts centralized. This commission, which is directly drawn on the funds for social housing, took 1 billion euros from the savings fund in 2012. Without drawing any conclusions about what should be done with these counterflows, it is questionable whether a better trade-off could be established between the centralisation rate and the coverage rate, the commission rate and the long-term funding of social housing [7].

What about the “probable” cut in the rates?

The reduction in Livret A rates, the proposal advanced on June 23 by the Minister of the Economy, Pierre Moscovici, who was echoing the statements made a few days earlier by the Governor of the Bank of France, Christian Noyer, should come into force on August 1, and is the result of a fall in the inflation rate on which it is partly indexed. What effect would this rate cut have on the flow of savings into Livret A accounts, and thus on the financing of social housing?

In May 2013, the interest rate on Livret A was 0.5% in real terms, a relatively low level. Over the period 2011-2012, it even came to an average of zero (see Figure 2). However, the net flow remained stable over the period. This is explained partly by the low rates offered by other investments, in particular taxed savings accounts such as the CEL home savings plan, which have had a negative real net rate since late 2009. Given the trade-offs made ​​by households, in particular the wealthiest ones, in their efforts to obtain the best return on their savings, it is relatively complex to demonstrate a strict correlation between the rate on Livret A accounts (real or nominal) and changes in the total outstandings. Thus, in the second half of 2009, Livret A suffered outflows even though the real rate on it was high; in 2010 and 2011, however, net deposits were high even though the rate was no longer so high.

Given, on the one hand, the lower real net rates offered by comparable investments and, secondly, current social and economic uncertainties, we can expect some stability in the flows during the second half of 2013, despite the decline in the rate of remuneration. This stability will obviously depend on the size of the rate reduction. As the rate is currently 1.75%, it seems unlikely that the high inflows will continue if the rate is revised below 1.25%. As France’s Economic commission expects inflation of 1.2% for 2013, fixing the Livret A rate below this would result in a fall in household purchasing power, which would go against the government’s commitments.

graph2_1107PMblog

Nevertheless, it should not be forgotten that this re-valuation in the rate is not automatic and in fact depends on a political decision. In the second half of 2009, while the collapse of inflation would have justified a decrease of 1.5 points to reduce the rate to 0.25%, the rate reduction ultimately applied was only 0.5 point, leaving the rate at 1.25%. An additional 2 billion euros was thus distributed to households. Conversely, in February 2012, given the return of higher inflation (even temporarily), the rate should have been lifted to 2.75%. The savings shortfall for households due to not changing the rate is estimated at 1 billion euros.

As with households’ choice between safety, liquidity and yields, the public trade-off between household purchasing power and the lending terms for social landlords can prove to be complicated. So while undervaluing the rate significantly benefits beneficiaries of the allocation of funds from Livret A (mainly social landlords) whose loan rates are “indexed” on the Livret A rate, it is disadvantageous for the saver.

While “small” savers are not very sensitive to changes in interest rates, “big” investors, that is to say, those approaching the deposit ceiling, can make rapid trade-offs out of Livret A. However, these 10% of the depositors, with the largest accounts, represent 51% of Livret A deposits. A massive reduction in rates could therefore lead to a significant outflow and subsequently substantially reduce the CDC’s capacity to lend to the social housing sector, a sector with ambitious building targets and mounting financing needs. On the contrary, it seems clear that maintaining higher rates during a period of low inflation would push up the cost of lending to social housing, at a time when the State and the housing agencies have committed to the construction of 120 000 social housing units per year between 2013 and 2015.


[1] For greater detail on the method of determining the interest rates, see Péléraux (2012).

[2] In January 2009, the total balance experienced a historic increase of 12.5%. For comparison, the successive increases in the ceiling in last October and January resulted in increases of 3.1% and 3.5%.

[3] In 2012, total lending of 9.7 billion euros was granted by the savings fund simply for financing the 105,000 social housing units.

[4] This objective corresponds to a campaign promise of the candidate Francois Hollande. It was recently downgraded: 120 000 housing financed per year until 2015 and 150,000 from 2016.

[5] For example, in 2012 Oséo and the FSI Strategic investment fund (Fonds stratégique d’investissement, FSI) received, respectively, 5.2 billion and 0.5 billion euros of resources from Livret A.

[6] The transfer was made ​​primarily to the LDD Sustainable development account (Livret de développement durable), whose outstandings grew by nearly 14 billion euros in October 2012 following the doubling of the ceiling.

[7] While the commission rate should converge by 2022 to 0.50% for all the distributing institutions, in 2011 it was 0.37% for new distributors and 0.53% for traditional distributors (CDC, 2012).


Zero interest loans: only for the rich?

By Pierre Madec

On 1 January 2013, a new version of the zero-interest loan (prêt à taux zéro – PTZ) came into force. It is more restrictive than previous versions, with lower eligibility ceilings and a sharper focus on new housing (and old “HLM” council housing). Here we review the measure’s possible consequences.

Given the great pressure on today’s rental market (Le Bayon, Madec and Rifflart, 2013), the goal of facilitating access to homeownership for first-time buyers with low down payments is commendable. Nevertheless, some questions need to be asked: are the poorest households the primary beneficiaries? Does a PTZ loan trigger the purchase of a first principal residence (an incentive effect) or does it simply accompany the purchase (a windfall effect)? Has the development of PTZ loans and their long-term implementation significantly helped expand supply on the market for new properties? And is the budgetary expenditure associated with the measure cost-effective in light of the overall results?

Established in 1995 to facilitate access to homeownership for poorer households, zero interest loans have evolved since then along with budgetary constraints and political decisions. In 2005, the scheme, previously reserved for the purchase of a new home (or an existing home needing extensive renovation), was extended to include the acquisition of existing homes with no conditions on renovation in order to increase homeownership in areas with a shortage of land (including Paris). This led to doubling the number of PTZ loans granted in 2005. Similarly, in 2011, the removal of eligibility ceilings allowed the programme to set a record with the grant of nearly 352,000 PTZ loans. In the context of the fiscal and real estate crisis, the reappearance in 2012 of ceilings on income and the elimination of old dwellings (excluding HLM housing) from the programme’s eligibility list reduced the number of PTZ loans to a historically low level (64,000).

On paper, the principle of this “reimbursable non-interest-bearing loan” is simple: in return for the agreement of a loan at zero interest, the banks benefit from a tax credit in the amount of the uncollected interest. This loan, which is limited to a certain loan-to-value ratio [1], must be associated with a mortgage, or principal loan, and can therefore be considered as a personal contribution during the acquisition of the principal residence, thus at the time the principal loan is granted.

In fact, calculating the volume of PTZ loans granted is complex, as it involves ceilings on income and on the transaction amounts, which depend on the geographical area and the loan-to-value ratio. Similarly, the terms of repayment (the duration and grace period) are defined based on membership in an “repayment bracket” (tranche de remboursement) that is calculated based on the household’s resources and composition.

Are PTZ loans stimulating the supply of housing on the market for new properties?

One of the stated objectives when creating the programme was to support and boost a sluggish market for new properties. It is actually difficult to assess the impact of PTZ loans on the construction market. Observing the evolution of the number of dwellings constructed before and after the implementation of PTZ loans (Figure 1), it does not appear that the 150,000 PTZ loans granted in 1996 had a significant impact on the volume of new housing units. From this quick observation seems to emerge the idea that even without the programme, and taking into account the rather mild economic situation, the housing market would have been equally dynamic. Similarly, the growth observed on the new property market over the period 1999-2007 is not attributable to the programme to facilitate homeownership [2].

According to the latest available statistics (SGFGAS 2012), as with incentive schemes for rental investment (Madec 2013, Levasseur 2011), the zones established during the implementation of PTZ loans leave it very difficult to direct investment into the areas under the greatest pressure. Thus, in the third quarter of 2012, more than half of PTZ loans were granted for purchases in Zone C, that is to say, the area least susceptible to market pressures (against 15% for Zone A [3]). This is largely explained by the extreme scarcity (and high cost) of land in Zones A and B. It was in order to end this form of geographical discrimination that in 2005 the system was opened to old housing. Over the period 2005-2011, more than a million PTZ loans were granted for the acquisition of an existing dwelling, thereby betraying one of the initial objectives of the programme.

Finally, despite a willingness to promote high environmental quality housing, including through the provision of higher loan-to-value ratios for energy-efficient housing (BBC) [4], the PTZ loans have played only a small role in the construction of BBC housing, as in the third quarter of 2012 two-thirds of the loans granted were for the purchase of housing that does not meet BBC standards.


Do PTZ loans facilitate homeownership for poorer households?

One of the main criticisms of PTZ loans is the poor quality of the targeting. Whereas the purpose of the programme is to help households in the greatest difficulty by financing an initial down payment, the particularly high level of the income ceilings (when they are not simply eliminated entirely as in 2011) has meant eligibility for households with no a priori need for the State in order to acquire property. For example, the eligibility ceiling in 2012 was 43,500 euros annually for one person wishing to acquire a principal residence in Zone A. This ceiling made ​​90% of households in the Paris region eligible for PTZ loans (source: INSEE) [5].

Furthermore, numerous studies have attempted to measure the impact of PTZ loans on household financing capacity (ANIL 2011, Beaubrun-Diant 2011, Gobillon and Le Blanc 2005, Thomas and Grillon 2001). Gobillon et al. thus concluded that PTZ loans “trigger the purchase” for only 15% of homebuyers. In other words, according to the model proposed by the authors, 85% of households have access to the property with or without the PTZ. Similarly, recent studies on the profile of homebuyers (Le Bayon, Levasseur et Madec 2013, Babès Bigot Hoibian 2012, INSEE 2010) highlight how it is becoming increasingly difficult for poorer households to purchase a home. Thus, according to Le Bayon et al., households in the lowest quartile of living standards, the households targeted by the homeownership programme, have seen their chance of acquiring a principal residence halved between 2004 and 2010. In view of these various results, it seems that the PTZ loan programme is having difficulty, at least in its earlier versions, playing a role in helping low-income households to become homeowners. This conclusion may need to be nuanced, however, if we look at the latest statistics provided by the SGFGAS. According to these data, workers and employees accounted for 25% and 33% respectively of the recipients of PTZ loans in the third quarter of 2012. Similarly, one out of three recipients belonged to the lowest “repayment bracket”. However, as the calculation of these brackets takes into account particularly high income ceilings, membership in the first repayment bracket is not really equivalent to meeting “poverty criteria”.

Finally, by increasing demand for new housing on a market with low supply elasticity and by allowing many households to acquire more expensive housing, programmes to assist homeownership have long been reproached for their inflationary effects (ANIL, 2002).

The PTZ programme:how much does it cost?

For 2012, the cost to the State for the PTZ programme was 1.34 billion euros. Given the number of beneficiaries, this may seem expensive, but, like all public assistance programmes, it needs to be analyzed in terms of efficiency.

A quick assessment can be made of the impact of the PTZ programme on housing investment. To estimate the multiplier effect of the PTZ programme in 2012, we used the latest available statistics (SGFGAS 2012) and made the following assumptions [6]:

  • 50% of the beneficiaries belonging to the lowest (Tranche 1) repayment bracket are what are called “triggered” households (i.e. 15 % of all beneficiaries);
  • Thanks to a PTZ loan, “non-triggered” households increase the amount of their purchase by 3%.


Overall, therefore, according to our estimates and under the assumptions spelled out above, in 2012 the PTZ programme stimulated almost 2 billion euros in investment in housing at a tax cost of 1.3 billion euros. The multiplier effect was therefore 1.5. This is in the lower range of what has been observed in other countries with similar programmes (1.5 to 2). This multiplier could be much higher if households were targeted more rigorously. Indeed, for the “Tranche 1” repayment bracket, under the above assumptions and considering that this segment accounts for half of the tax expenditure (a generous assumption), the multiplier is 2.6. However, we are still far from the optimal theoretical multiplier of 6 estimated by Gobillon and White [7].

What about the 2013 version of the PTZ?

To deal with the various criticisms that have been raised, on 1 January the government attempted to improve the conditions for access to the PTZ programme by:

  • Reducing eligibility ceilings from 17% (in zone A) to 30% (in zone C);
  • Freezing ceilings on the transaction cost in new housing and ex-HLM (council) housing;
  • Lowering the loan-to-value ratios;
  • Re-establishing repayment deferrals of up to 15 years for households in the lowest repayment bracket.

For the most part, these measures will help to target assistance for homeownership more accurately. However, some improvements could still be made. In 2013, the income ceilings for Zone A still include about 80% of inhabitants of the Paris region. In addition, the possibility of acquiring existing HLM council housing, which is potentially very energy-consuming, seems inconsistent with the promotion of new energy-efficient housing. For low-income households in high-demand areas, would it not be better to promote the purchase of housing that, while not new, has energy characteristics closer to what is required for new housing?

Likewise, re-establishing the principle of repayment deferrals of up to 15 years could prove objectionable. Indeed, it may lead to undermining the solvency of some households by reducing the duration of their principal loan. The banks, taking into account the deferral, tend to align the duration of the principal loan with the duration of the deferral in order to avoid an excessive jump in the future monthly repayment. So, the deferral may on the contrary increase the risk of default, as, once the deferral is over, households may be hit by a surge in their monthly payments (Bosvieux and Vorms, 2003).

Finally, the freeze on transaction ceilings cannot be sustained given first, the growing gap that exists between the ceilings and market prices, and second, the continuous increase in construction costs resulting from the normative inflation experienced by the sector.

To conclude, it is important to take note of the existence of a debate over the very need for a programme to assist homeownership: should the State encourage, assist or finance homeownership for renters? Should taxpayers help renters to become homeowners, as with tax incentives for investment in rental housing? For the poorest households, who find it impossible to come up with a sufficient personal contribution for a purchase, it may seem reasonable to assume that the State is playing its role by helping the most vulnerable to follow the standard residential trajectory, from cohabitation with parents to rental and then ownership. For others, we cannot rule out the existence of significant windfall effects, as outlined above. To avoid these problems and improve the financial positions of the households originally targeted by the programme, a thorough overhaul of programmes to promote homeownership (social or otherwise) is essential.


[1] That is, a maximum percentage of the amount of the transaction.

[2] The new property market was, for the period under consideration, boosted strongly by programmes to stimulate rental investment (see Le Bayon et al. 2013).

[3] Paris, the near suburbs and part of the outer suburbs.

[4] In 2012, for purchases in Zone A, the loan-to-value ratio was 38% for new energy-efficient (BBC) housing versus 26% for non-BBC.

[5] For an annual income of 43,500 euros, assuming a rate of 3.2%, borrowing capacity came to an average of 260,000 euros (excluding the PTZ loan), i.e. a housing unit of at least 50 sq.m in the near Paris suburbs (excluding the communes bordering Paris).

[6] These assumptions are in accord with the results of the modelling proposed by Gobillon and Le Blanc (2005). The latter found a multiplier effect for the PTZ programme on the order of 1.1 to 1.3.

[7] This multiplier was estimated by assuming perfect targeting for the programme, that is, that all the beneficiaries are “triggered” households.


Rent control: What is the expected impact?

Sabine Le Bayon, Pierre Madec and Christine Rifflart

The decree on rent control, which was published in the Journal officiel on 21 July, takes effect on 1 August 2012 for one year. The measure was announced in January 2012 during François Hollande’s presidential campaign. It has now been adopted, while awaiting the major reform of landlord-tenant rental relations that is scheduled for 2013.

Difficulties in finding housing and deteriorating living conditions for an increasing share of the population point to growing inequality in housing. This inequality is undermining social cohesion, which is already being hit by the economic crisis. For many people, homeownership is becoming a problematic proposition due to the rising cost of buying, while applications for the allocation of social housing remain on hold for lack of space, and the private rental market is becoming increasingly expensive in large cities because of the soaring price of property. Rent control in these cities is serving as an emergency measure to slow the price increases. This poses a challenge of keeping investors in the private rental market, which is already characterized by a shortage in housing supply and very low rental returns (1.3% in Paris after capital depreciation).

The decree aims to significantly lower market rents [2], which are being driven up by rents at the time of re-letting, i.e. during a change of tenant. Unlike rent during the lease period or upon renewal of a lease, which are indexed to the IRL rental benchmark, until 31 July 2012 rents for new tenants were set freely. In 2010, this applied to nearly 50% of re-lettings in the Paris area (60% in Paris). Now, in the absence of major renovations, these will be subject to control. Only rents for new housing that is being let for the first time or renovated properties (where the renovation represents more than one year’s rent) will remain uncontrolled (Table 1).


By using the data from the Observatoire des Loyers de l’Agglomération Parisienne, along with the hypotheses set out in the OFCE Note (no. 23 of 26 July 2012), “Rent control: what is the expected impact?”, we evaluated the impact this decree would have had if it had been implemented on 1 January 2007 and made permanent until 2010. According to our calculations, this decree would have resulted not only in sharply slowing increases in rents for re-lettings during the first year it was applied (+1.3% in the Paris area, against 6.4% observed), but also in stabilizing or even reducing rents at the time of the next re-letting, i.e. in our example, three years later (in 2010, 0% in Paris and -0.6% in the Paris region). Finally, in 2010, rents would have been 12.4% lower in Paris and 10.7% lower in the Paris region than they would have been in the absence of the measure. This means that in Paris, rents would have been about €20.1 per sq.m instead of the rate of €22.6 per sq.m actually observed (Table 2). For an average size dwelling (46 sq.m) re-let in Paris, the monthly rent would thus have been €924 instead of €1,039, a savings for the tenant of €115 per month. For the Paris region as a whole, using the same assumptions, the rent upon re-letting would have fallen on average to €15.9 per sq.m, instead of the actual €17.8 per sq.m. For an average rental area upon re-letting of ​​50 sq.m, the gain would be €95 per month!

Over the longer term, the decree would make it possible to reduce the gap between sitting tenants in place for more than 10 years and new tenants (a gap of 30% in 2010 in the Paris region and 38% in Paris itself), and to improve market fluidity.

Currently, what possibility is there of moving if the mere fact that a couple has children increases the price per sq.m by over 15% in the Paris region? Similarly, the financial incentive to move for a couple living in a four-room 80 sq.m dwelling whose children have left home is zero, because the rent for a 60 sq.m unit with 3 rooms would cost just as much. This premium on being sedentary increases the pressure on the rental market and encourages households to stay in properties that are not suited to their needs, and even hampers labour market mobility.

Can this measure encourage mobility and restore household purchasing power? In the short term, it will certainly benefit the most mobile households by limiting the increase in the share of their budget spent on housing [3]. But these are the households facing the least constraints on income, that is to say, those with high incomes or a relatively low share of income spent on housing. It will also benefit households that are forced to move or those who are running up against the limits on their finances. For all these households, the increase in the share of income on housing will be lower than it would have been without the decree. In contrast, for low-income households whose share is already high [4], the decree won’t change anything, because they can ill afford the additional cost of re-letting.


What are the risks?

While there are real benefits to be expected, these would still need to be made viable by the application of this decree, or at least by the next Act. Besides the difficulty of implementing the decree (absence both of reliable mechanisms to monitor rents in the areas concerned and of a legal framework to allow tenants to assert their new rights), the impact of this measure will be positive for tenants only if the rental supply does not shrink (by maintaining current investors in the market and continued new investment) and if landlords do not seek to offset future rent control by raising the rent at the time of the first let.

Likewise, the realization of improvements in line with the Grenelle 2 environmental consultation or simply maintenance work could wind up being abandoned due to the lengthening of the amortization period for landlords compared with the previous situation. Conversely, some owners might be encouraged to carry out major renovations (in excess of one year’s rent) and “to upgrade the dwelling” in order to be able to freely determine the rent. This would give the landlord a margin of safety to offset any subsequent shortfall. These increases, if they occurred, would penalize less creditworthy tenants and would promote the process of gentrification already at work in the areas under greatest pressure. We could then see increasing differences between the market for “rundown housing” and that for renovated housing.

This decree should in the short term limit the extent of disparities in the areas under greatest pressure, at no cost to the government. But it will not solve the problem for the poorest households of the share of income going to housing: to do this, it is necessary to increase the stock of social housing, to improve its fluidity and to significantly upgrade housing subsidies [5], which would require a major financial effort. The fundamental problem remains the lack of supply, particularly in urban areas, where by definition the available land is scarce and expensive, with higher rents simply passing on the price of property. However, to ease housing prices, more land needs to be available, with a greater density where possible, transport needs to be developed to facilitate the greater distance travelled between residential areas and workplaces, and so on. These are the levers that need to be used if we are to improve the housing conditions of less well-off households.


[1] The decree applies in municipalities where the rent increases seen over the period 2002-2010 were more than double the increase in the IRL benchmark (i.e. 3.2% per year) and the market rent per sq.m exceeds the national average outside the Paris region (€11.1 /sq.m) by 5%. This includes nearly 1,400 communes in 38 cities (27 in metropolitan France and 11 in overseas departments).

[2] There are two types of rent: the average rent is the rent of all rental housing, whether vacant or occupied; and the market rent is the rent of all dwellings available on the rental market, i.e. new rental accommodation and re-lettings. This is very close to the rent for re-lettings, as residences for first-time lets represent only a small portion of the available supply.

[3] This share has increased for 15 years for households in the private rental sector, and particularly the less well-off.

[4] In 2010, more than half of private sector tenants spent an income share on housing (net of housing benefit) of over 26.9%, but above all, the share was 33.6% for the poorest 25% of households.

[5] According to the IGAS report “Evaluation of personal housing assistance”, in 2010, 86.3% of rents in the private rental sector were greater than the maximum rent taken into account for calculating housing benefit. Any increase in rent is thus borne entirely by the tenant.