A fall in the unemployment rate according to the ILO: the false good news

By Bruno Ducoudré and Eric Heyer

Two days following the announcement by France’s unemployment agency Pôle Emploi of an increase in Class A job seeker registrations in April, which comes on top of a first quarter increase, the INSEE statistics agency has published its estimate of the unemployment rate. Under the definition of the International Labour Office (ILO), the unemployment rate in metropolitan France fell by 0.1 point in the first quarter of 2015, meaning 38,000 fewer unemployed than in the fourth quarter of 2014. But according to Pôle emploi, over this same period the number of registered Class A job seekers rose by 12,000. In one case, unemployment is falling; in the other, it is rising: this does not make for a clear diagnosis of what’s happening with unemployment at the start of the year.

What accounts for the different diagnoses of the INSEE and Pôle Emploi?

In addition to differences in methodology (a labour survey for the ILO, administrative data for Pôle emploi), note that to be counted as unemployed according to the ILO, three conditions have to be met: a person must be unemployed, available to work and conducting an active job search. Simply registering at the job centre is not sufficient to meet this last condition. So someone who is registered in Class A [1] at Pôle Emploi but is not conducting an active search is not counted as unemployed according to the ILO. The ILO criteria are thus more restrictive. Historically, the number of unemployed registered at the job centre is higher than that calculated according to the ILO for persons aged 25 and over. Young people under age 25 generally have less incentive to register at the job centre [2].

tab1_0406ang

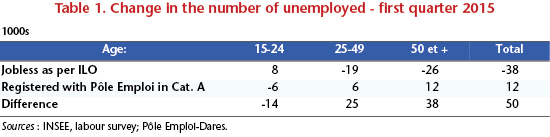
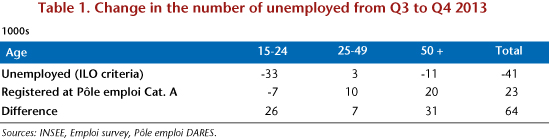
Except for the under-25s, the unemployment figures from Pôle Emploi are therefore worse than those for the ILO and hence the INSEE (Table 1). The explanation is as follows. In labour market conditions that have worsened considerably, some unemployed people have become discouraged and are no longer actively seeking employment: they are thus no longer counted as unemployed according to the ILO. Yet they are continuing to update their status with the job centre and thus remain registered as unemployed in Class A. This results in an increase in the “halo” of the unemployed, i.e. people who want to work and are readily available but are not actively seeking a job. This unemployment “halo” has increased by 71,000 people in one quarter.

In first quarter 2015, the ILO-based unemployment rate fell for the wrong reasons

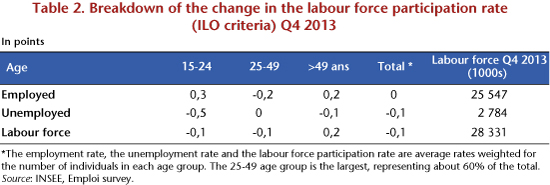
There are two reasons why the unemployment rate may fall: the first, virtuous reason is that people are exiting unemployment due to an improvement in the labour market; the second, less rosy reason is that some unemployed people are drifting into inactivity. The latest ILO statistics highlight that the 0.1 point fall in the unemployment rate was due entirely to the decline in the labour force participation rate – which measures the percentage of people in the population aged 15 to 64 who are active – and not to a recovery in employment, which, on the contrary, has declined. So the drop in the unemployment rate is due not to a recovery in employment, but to discouragement among unemployed people who are no longer actively seeking work (Table 2).

tab2_0406postang

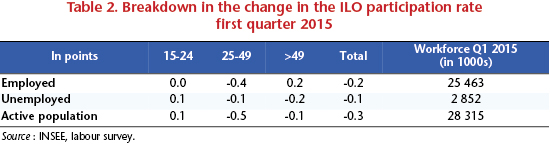
More specifically, the entry of young people into the labour market at a time when employment is declining is being reflected in a 0.1 point rise in joblessness in this category. Among seniors, the employment rate is continuing to increase (0.2 points) due to the postponement of the effective retirement age. It is true that ILO unemployment is falling among seniors, but the rising numbers in this age group enrolling at the job centre (Table 1) undoubtedly reflects a change in their job search behaviour: more and more of them are no longer making a job search and are now classified in the “halo” of unemployment.

Ultimately, the fall in the ILO-defined unemployment rate, which is marked by both a lack of recovery in employment and discouragement among some of the unemployed, is not such good news.


[1] People registered in Class A have not worked at all, even on reduced hours, unlike those registered in Classes B and C.

[2] To be entitled to unemployment compensation and to receive back-to-work assistance (“ARE”), 122 days of affiliation or 610 hours of work must be shown during the 28 months preceding the end of the job contract.


Oil: carbon for growth

By Céline AntoninBruno Ducoudré, Hervé Péléraux, Christine Rifflart, Aurélien Saussay

This text is based on the special study of the same name [Pétrole : du carbone pour la croissance, in French] that accompanies the OFCE’s 2015-2016 Forecast for the euro zone and the rest of the world.

The 50% fall in the price of Brent between summer 2014 and January 2015 and its continuing low level over the following months is good news for oil-importing economies. In a context of weak growth, this has resulted in a transfer of wealth to the benefit of the net importing countries through the trade balance, which is stimulating growth and fuelling a recovery. Lower oil prices are boosting household purchasing power and driving a rise in consumption and investment in a context where companies’ production costs are down. This has stimulated exports, with the additional demand from other oil-importing economies more than offsetting the slowdown seen in the exporting economies.

That said, the fall in oil prices is not neutral for the environment. Indeed, the fall in oil prices is making low-carbon transportation and production systems less attractive and could well hold back the much-needed energy transition and the reduction of greenhouse gas emissions (GHG).

This oil counter-shock will have a favourable impact on growth in the net oil-importing countries only if it is sustained. By 2016, the excess supply in the oil market, which has fuelled by the past development of shale oil production in the United States and OPEC’s laissez-faire policy, will taper off. Unconventional oil production in the United States, whose profitability is uncertain at prices of under 60 dollars per barrel, will have to adjust to lower prices, but the tapering off expected from the second half of 2015 will not be sufficient to bring prices down to their pre-shock level. Brent crude prices could stay at about 55 dollars a barrel before beginning towards end 2015 to rise to 65 dollars a year later. Prices should therefore remain below the levels of 2013 and early 2014, and despite the expected upward trend the short-term impact on growth will remain positive.

To measure the impact of this shock on the French economy, we have used two macroeconometric models, e-mod.fr and ThreeMe, to carry out a series of simulations. These models also allow us to assess the macroeconomic impact, the transfers in activity from one sector to another, and the environmental impact of the increased consumption of hydrocarbons. The results are presented in detail in the special study. It turns out that for the French economy a 20 dollar fall in oil prices leads to additional growth of 0.2 GDP point in the first year and 0.1 point in the second, but this is accompanied by a significant environmental cost. After five years, the price fall would lead to additional GHG emissions of 2.94 MtCO2, or nearly 1% of France’s total emissions in 2013. This volume for France represents nearly 4% of Europe’s goal of reducing emissions by 20% from 1990 levels.

The simulations using the French e-mod.fr model can be extended to the major developed economies (Germany, Italy, Spain, the USA and UK) by adapting it to suit characteristics for the consumption, import and production of oil. With the exception of the United States, the oil counter-shock has a substantial positive impact that is relatively similar for all the countries, with Spain benefitting just a little more because of its higher oil intensity. Ultimately, considering the past and projected changes in oil prices (at constant exchange rates), the additional growth expected on average in the major euro zone countries would be 0.6 GDP point in 2015 and 0.1 point in 2016. In the US, the positive impact would be partially offset by the crisis that is hitting the unconventional oil production business[1]. The impact on GDP would be positive in 2015 (+0.3 point) and negative in 2016 (-0.2 point). While lower oil prices are having a positive impact on global economic growth, this is unfortunately not the case for the environment …


[1] See the post, The US economy at a standstill in Q1 2015 : the impact of shale oil, by Aurélien Saussay, from 29 April on the OFCE site.


France: Recovery … at last!

By Mathieu PlaneBruno DucoudréPierre Madec, Hervé Péléraux and Raul Sampognaro

The OFCE’s forecast for the French economy in 2015-2016 is now available.

Not since the beginning of the subprime crisis has the French economy been in such a favourable situation for a recovery. The fall in oil prices, the ECB’s proactive and innovative policy, the easing of fiscal consolidation in France and the euro zone, the gathering impact of the CICE tax and the implementation of the Responsibility Pact (representing a tax transfer to business of 23 billion euros in 2015 and nearly 33 billion in 2016) all point in the same direction. The main obstacles that have held back French activity over the last four years (over-calibrated fiscal austerity, a strong euro, tight financial conditions, and high oil prices) should all be out of the way in 2015 and 2016, with pent-up growth finally released. The supply policy being pushed by the government, whose impact on business is still pending, will be all the more effective thanks to the positive demand shock from foreign trade, which will allow the economic rebalancing that was lacking up to now.

French GDP will grow by 1.4% in 2015, with the pace accelerating in the course of the year (to 2% yoy). The second half of 2015 will mark the turning point in the recovery, with the corporate investment rate picking up and the unemployment rate beginning to fall, ending the year at 9.8% (after 10% in late 2014). 2016 will then be the year of recovery, with GDP growth of 2.1%, a 4% increase in productive investment and the creation of nearly 200,000 private sector jobs, pushing the unemployment rate down to 9 5% by end 2016. In this positive context, the public deficit will fall significantly, and is expected to be 3.1% of GDP in 2016 (after 3.7% in 2015).

Obviously this virtuous cycle will only take effect if the macroeconomic environment remains favourable (low oil prices, a competitive euro, no new financial tensions in the euro zone, etc.) and if the government limits itself to the budget savings already announced.


Decline of the euro and competitive disinflation: who’s going to gain the most?

By Bruno Ducoudré and Eric Heyer

For nearly two years, between mid-2012 and mid-2014, the euro appreciated against the world’s major currencies. Having reached a level of USD 1.39 in May 2014, the euro had increased in value since July 2012 by more than 12% against the dollar. During the same period, the euro appreciated by 44% against the yen and more than 3% against the pound sterling.

Since May 2014, this trend has reversed: after rising by nearly 10% between mid-2012 and mid-2014, the real effective exchange rate for the euro, which weights the different exchange rates based on the structure of euro zone trade, has depreciated by 5.2% over the last six months (Figure 1). In fact, within a few months, the euro has lost nearly 10% against the dollar, more than 3% against the yen and 4% against the British pound. The weakening against the pound sterling actually began in August 2013, and has reached over 9% today. We expect the euro to continue to depreciate up to the beginning of 2015, with the single currency’s exchange rate falling to 1.20 dollars in the second quarter of 2015.

GRAPH1_postENG05-11

For many business people and economics experts, this decline in the euro represents an opportunity to escape the deflation trap currently threatening the euro zone. Faced with sluggish growth in the zone and an inflation rate that is falling dangerously low, the announcement by the European Central Bank of a quantitative easing programme indicates its willingness to devalue the euro against other currencies in order to support Europe’s growth and meet its inflation target.[1] The French government also expects a great deal from the euro’s depreciation.[2] The Treasury Department believes[3] that a 10% decrease in the effective exchange rate of the euro (against all currencies) would increase our GDP in the first year by 0.6 percentage point, creating 30,000 jobs, reducing the public deficit by 0.2 GDP point and pushing up consumer prices by 0.5%.

The revival of short-term growth in the euro zone through a depreciation of the euro’s effective exchange rate would also limit the non-cooperative policy of competitive disinflation being implemented in southern Europe (Greece, Spain, Portugal). While European countries trade mostly with each other and compete sharply for export markets, the effort to improve competitiveness through a disinflation policy is bound to fail in the euro zone if all the members adopt the same strategy. This is, however, the strategy chosen by the European Commission, i.e. by pushing the countries in crisis to reform their labour markets and cut labour costs. In this light, the depreciation of the euro is needed to support structural reform in Europe and support demand [4] even as fiscal austerity policies are further undermining it.

In a recent study, we attempted to assess the effects expected from the depreciation of the euro. We are interested not in the reasons for the variations in the euro (differential performance, behaviour of central banks) but in its macroeconomic implications (in particular its impact on GDP, prices and employment). To assess the sensitivity of exports to price competitiveness for six major OECD countries (France, Germany, Italy, Spain, United States, United Kingdom), we made estimates using new foreign trade equations that distinguish, within the euro zone, intra-zone trade and extra-zone trade. The elasticities obtained are consistent with the existing literature on this subject. It is necessary to make a joint estimation of the equations for export volumes and import prices: this provides a feedback loop in partial equilibrium for a change in the effective exchange rate on import volumes and export volumes. Taking into account the marginal behaviour of importers and exporters tends to limit the effect of a change in the effective exchange rate on the volumes of imports and exports when these have little market power. Simulations show that, in the euro zone, Spain would have the most to gain from a depreciation in the euro’s exchange rate against other currencies, but also from a policy of competitive disinflation (case where Spain’s export prices grow more slowly than the export prices of its euro zone rivals) (Table 1).

TAB1_post04-11ang


For the French economy, we also carried out a more detailed analysis using the OFCE’s macroeconomic model emod.fr, with the goal of comparing our results with those obtained by the French DG Treasury with the Mésange model.

Our results show that a 10% depreciation of the euro against all currencies leads to a gain in price competitiveness for export to France vis-à-vis the rest of the world. The other euro zone countries experience the same gain in competitiveness across all export markets. In this case, the effect on activity would be +0.2% the first year, and +0.5% after three years. Excluding the effect due to the change in price competitiveness, the increased demand resulting from the pick-up in activity among our European partners would be broadly offset by lower demand addressed to France from the rest of the world. On the labour market, the depreciation would create 20,000 jobs in the first year, and 77,000 jobs after three years. The public deficit would improve by 0.3 GDP point in three years (Table 2).

TAB2_post04-11ang

Finally, we simulated the effect of a 10% increase in the prices of our competitors in the euro zone on the whole of France’s export markets. This 10% improvement in price competitiveness vis-à-vis the other euro zone countries would have a positive effect on activity via an increase in exports, investment and employment (Table 3). The impact on activity would be +0.4% in the first year and +0.9% after three years. It would be zero after 10 years. Nearly 130,000 jobs would be created in a period of 3 years and the government deficit would improve by 0.5 GDP point over this period.

TAB3_post04-11ang


[1] See C. Blot and F. Labondance, “Why a negative interest rate?”, Blog de l’OFCE, 23 June 2014.

[2] See the speech by Prime Minister F. Hollande on 5 February 2013 to the European Parliament.

[3] Economic and Social Report of France’s 2014 draft budget bill.

[4] See the speech by M. Draghi “Unemployment in the euro area”, Jackson Hole, 22 August 2014.


France: duty-free growth

By Bruno Ducoudré , Éric Heyer, Hervé Péléraux, Mathieu Plane

This post summarizes the 2014-2015 outlook for the French economy

In early 2011, France was one of the few developed countries to have regained its pre-crisis level of GDP. Economic growth exceeded 2%, even reaching 3% yoy in the first quarter of 2011. Since then the situation has changed: the recovery was interrupted, and while the economy is experiencing positive growth, the rate is close to zero (Figure 1). Four types of shock explain why the post-recession recovery in 2011 died out. Growth was already being battered by austerity and by deteriorating credit conditions, and was then also hit by fluctuations in oil prices and by the impact of price competitiveness in 2012 as a result first of wage deflation in France’s competitors and then in 2013 of the rise of the euro (Table 1).

GRAPH1ENG


In 2014, the improvement expected on the economic front did not occur: the stimulus due to the gradual easing of austerity is being offset by the powerful brake exerted by the significant appreciation of the euro that has taken place since mid-year as well as by the collapse in consumer investment in housing. As in the previous two years, growth is expected to come to 0.4%, which is not enough to reverse the rise in unemployment or to reduce the public deficit significantly. Worse, while the public deficit has been cut by over 3 GDP points since 2009, it is now expected to rise slightly once again, reaching 4.5% of GDP (Tables 1 and 2).

TAB1ENGcorrigé


In 2015, growth will pick up some, to +1.1%, due to the weakening of the negative factors that have stifled it since 2010, in particular credit conditions and austerity. Furthermore, the effect of price competitiveness, a factor that has played a very negative role in 2014, will be reversed, due first to the depreciation of the euro, and second to the rising impact of the CICE tax credit, whose primary goal is to ensure lower export prices. But with GDP growth of 1.1% next year, the path towards expansion is still a long way from what can usually be seen during a post-crisis recovery (i.e. 2.4%). As the output gap is not closing, the anticipated growth cannot be deemed a recovery. Companies will benefit from this renewed pick-up to gradually restore their financial situation. This strategy is based primarily on increasing productivity, which will help to reduce surplus capacity and restore profit margins. The unemployment rate in metropolitan France will rise slightly to 9.9% in late 2015, and to 10.3% for France as a whole. The counterpart to loosening the austerity reins is a public deficit that is higher than what was originally programmed. It is expected to be 4.3% of GDP in 2015, departing significantly from its path back towards 3%.

TAB2ENG_corrige


In order to meet its commitments on structural efforts and nominal deficits, the government could decide to vote to make an additional effort of 8 billion euros. This would correspond to a 1.2 point hike in the standard rate of VAT. If that happens, GDP would grow no more than 0.8% next year, and the deficit would be reduced by only 0.2 GDP point, compared to our baseline scenario (Table 3).

TAB3ENG


What is a weaker euro likely to mean for the French economy?

By Bruno Ducoudré and Eric Heyer

Faced with the rising risk of deflation in the euro zone, which has been reinforced since mid-2012 by the continued appreciation of the euro against other currencies, the heads of the European Central Bank have begun to change their tone in their communications with the financial markets: they are now evoking the possibility of conducting a new round of quantitative easing. These measures are likely to lower the exchange rate of the euro. This would provide valuable support for the euro zone economies by shoring up their price competitiveness vis-à-vis competitors outside the zone, in a context where fiscal consolidation policies will continue to dampen the growth expected in the zone in 2014 and 2015. What are the likely consequences for the French economy from reducing the euro’s value against other currencies? We briefly review past episodes of exchange rate changes, and then present the impact expected from a 10% depreciation of the euro against other currencies using the emod.fr model. These effects are more moderate than those projected by the government.

Quantitative easing measures have been used extensively by the US Federal Reserve, the Bank of England and the Bank of Japan. Since mid-2012, the balance sheets of these three banks has continually increased, by respectively 6.5 percentage points of GDP, 1.3 GDP points and 15.3 GDP points. During this same period, the ECB balance has on the contrary declined by 8.4 GDP points. This difference in strategy has led to a continued rise in the strength of the euro: now at 1.38 dollars, the euro has seen its value against the dollar increase by 12% since June 2012. During the same period, the single currency has appreciated 49% against the yen and about 3% against the pound sterling (Figure 1).

G1_Post2005ang_EHBD

The nominal effective exchange rate of the euro, which weights the different exchange rates depending on the structure of trade in the euro zone, has thus appreciated by 9.5% since the third quarter of 2012 (Figure 2). This appreciation, combined with austerity policies and the competitive disinflation carried out within the euro zone, has held down GDP growth in the zone, which was negative in 2012 and 2013, as well as inflation. The absence of inflationary pressures and the past appreciation of the euro have now given the ECB leeway to try to influence the course of the euro against other currencies.

G2_Post2005_angEHBD

What would be the impact of a devaluation of the euro against all currencies?

The depreciation of the euro would have a dual effect:

–           An income effect: a weak euro would increase the prices of imports. This would result in higher energy costs, a rise in companies’ prices of production and a loss of household purchasing power;

–          A substitution effect: a weak euro would decrease the prices of exports and increase their volume. Depreciation would also decrease the competitiveness of rival manufacturers, causing a decline in imports in favour of domestic production.

These opposite effects would apply only to trade outside the euro zone. Trade with our European partners would not be directly impacted, as the prices of imports and exports to and from this area would remain unchanged. On the other hand, intra euro zone trade would be impacted by a weaker euro. But this involves the channel of addressed demand.

tab1_2005angEHBD_post

As is summarized in Table 1, a 10% depreciation of the euro against all currencies leads to a gain in price competitiveness for French exports vis-à-vis the rest of the world. Other countries in the euro zone would benefit from the same gain in competitiveness across all export markets. In this case, the impact on activity would amount to 0.3% in the first year, 0.5% after three years, and none after nine years. The increase in demand due to this improvement in the activity of our European partners would be broadly offset by a reduction in demand addressed to France from the rest of the world. As for the labour market, this depreciation would create 22,000 jobs in the first year and 74,000 jobs after 3 years. The public deficit would in turn improve by 0.3 GDP point within 3 years.

These results, while more moderate than those published by the DG Treasury[1], are nonetheless significant and are welcome in an economic situation like today’s that is marked by sluggish growth and the risk of deflation. A depreciation of the single currency would also undercut the process of competitive deflation engaged in by countries in the euro zone.


[1] The publication of the DG Treasury argues that a 10% decrease in the effective exchange rate of the euro (against all currencies) would do the following: increase our GDP by 0.6 percentage point of GDP in the first year and 1.2 GDP points after three years; create 30,000 jobs in the first year and 150,000 jobs within three years; and reduce the government deficit by 0.2 GDP point in the first year and 0.6 GDP point after three years.


Should we be celebrating the fall in unemployment at end 2013?

By Bruno Ducoudré and Eric Heyer

Every quarter, the INSEE publishes the unemployment rate as defined by the International Labour Office (ILO): for the fourth quarter of 2013, it fell 0.1 point in France, meaning 41,000 fewer unemployed. Likewise, every month the number of jobseekers registered with the Pôle Emploi job centre is reported: during the fourth quarter of 2013, this source indicated that the number of registered jobseekers in category A rose by 23,000. In one case unemployment is down, in the other it is up – this does not lead to a clear diagnosis about where unemployment is heading at year end.

What explains the difference in diagnosis between the INSEE and Pôle emploi?

Besides differences related to methodology (an employment survey for the ILO, an administrative source for Pôle emploi), it should not be forgotten that, according to the ILO, a person must meet three conditions to be counted as unemployed: being unemployed, being available for work and performing an active job search. Simply being registered at Pôle emploi is not sufficient to fulfil this last condition. So people registered as category A at Pôle emploi who are not actively seeking work are not counted as unemployed according to the ILO. The ILO criteria are thus more restrictive. Historically, for those aged 25 and over, the number of unemployed registered at Pôle emploi is greater than the number according to the ILO criteria. For those under age 25, registering with Pôle emploi [1] is in general not as worthwhile, except during a period of active social treatment of unemployment, as was the case during the last quarter of 2013: people who wanted to benefit from a subsidized job had to be registered at the job centre.

TAB1_BD_EH_postEng_070314

As shown in Table 1, regardless of the age group, the situation seems less favourable using the Pôle emploi figures than according to the ILO criteria: when confronted with more than 2 years of unemployment, a certain number of discouraged jobseekers stop their active job search and are thus no longer recognized as such within the meaning of the ILO, yet continue to update their status at the job centre, and therefore remain listed in Category A.

Is the reduction in the unemployment rate calculated by ILO criteria good news?

The unemployment rate can fall for two reasons: the first one, virtuous in nature, is as a result of escaping unemployment due to improvements in the labour market; the second, less encouraging, is due to jobless people becoming discouraged and drifting into inactivity. The latest statistics from the ILO emphasize that the 0.1 point fall in the unemployment rate can be explained in full by the fall in the participation rate – which measures the percentage of the work force in the population aged 15 to 64 – and not by a resumption of employment that has remained stable. The decline in the unemployment rate is thus not due to a recovery in employment, but to discouraged jobless people who quit actively seeking employment (Table 2).

TAB2_BD_EH_postEng_070314

Looking more closely, the employment policy pursued by the government – “jobs for the future”, CUI “unique integration contracts” – has had a positive impact on youth employment; the employment rate rose by 0.3 percentage point during the last quarter of 2013. Among seniors, the employment rate is still continuing to rise (+0.2 percentage point) due to the decline in the actual age of retirement. ILO-defined unemployment is of course falling among seniors, but the sharp rise in enrolment at the job centre in this age group (Table 1) undoubtedly reflects a change in their job search behaviour: more and more seniors are no longer looking for work. They are now included in the “halo” of unemployment, which is continuing to rise.

Ultimately, the fall in the ILO-defined unemployment rate, which is characterized by the absence of a recovery in employment and the discouragement of jobseekers, is not such good news.


[1] To have the right to unemployment compensation and receive assistance for a return to work, it is necessary to prove a 122 day contribution period or 610 hours of work during the 28 months preceding the end of the job contract.


The trend in unemployment: no reversal in sight

By Bruno Ducoudré

The government has announced that the trend in unemployment will be reversed by the end of 2013. The number of jobseekers registered in category A with France’s Pôle Emploi job centre at the end of September increased by 60,000. The number fell during August by 50,000, mainly due to a “bug” in sending SMS texts, which led to an unusually large rise in the number of terminations due to the claimant’s failure to stay up to date (up 72,000 over the previous month). An increase in enrolments for the month of September due to the re-registration of jobless people who had been unduly terminated was therefore expected. The number of jobseekers registered in category A thus rose by 10,000 between July and September 2013, which meant that the trend is still upwards but at a more moderate pace than earlier in the year. These large variations in the very short term in the numbers registered with the ANPE job centre make it impossible to give a precise idea of upcoming trends in employment and unemployment. Our analysis of the labour market up to 2014, which is set out in the latest OFCE forecasts of October 2013, suggests that no significant improvement in unemployment is expected by the end of 2014.

In an attempt to reverse the trend in unemployment, the government has planned for the rapid expansion of subsidized jobs in the non-profit sector (Emplois d’avenir, Contrats Uniques d’Insertion – Contrats d’Accompagnement dans l’Emploi (CUI-CAE)). Joining these programmes are the CICE tax credit for competitiveness and employment together with “generation contracts” in the commercial sector, whose impact on employment will begin to be felt in 2014. All these measures to promote employment will help to stabilize the unemployment rate by late 2013/early 2014, with continuing job losses in the private sector until the end of the year. The unemployment rate will then begin to rise again until the end of 2014, since job creation in the non-profit sector will be insufficient to absorb the increase in the labour force.

In retrospect, an initial reversal of the trend in unemployment began in 2010 and was then interrupted in 2011, as unemployment started to rise again under the impact of a series of austerity measures. The unemployment rate was creeping toward the record levels hit in 1997, rising from 9.1% in early 2011 to 10.5% in the second quarter of 2013 (Figure 1). After a bad year in 2012 (66,000 jobs lost), the labour market continued to deteriorate in the first half of 2013, as job losses in the private sector continued at the same pace as in the second half of 2012 (-28,000 jobs on average each quarter). The number of unemployed thus continued to increase (+113,000). To try to stop this downward spiral and reverse the rise in unemployment, the government is relying in the short term on expanding the Emplois d’avenir and CUI- CAE subsidized job programmes.

graph1_2410blogang

The gradual introduction of Emplois d’avenir jobs has resulted in 31,566 hires between January and August 2013 in France. A total of 70,000 hires are expected in 2013 in mainland France and 70,000 more in 2014. There is, however, a deadweight loss for this type of programme: according to Fontaine and Malherbet (2012), 20% of the jobs created through the Emplois d’avenir scheme would have existed even in the absence of the subsidy. The net impact is thus expected to be 56,000 jobs created in 2013 and in 2014. The impact of this job creation will be especially important since these involve long-term contracts (1-3 years). People hired in 2013 will still be in their jobs in 2014, and the Emplois d’avenir jobs created in 2014 will indeed constitute net job creation.

As for the CUI- CAE programme, the number of contracts budgeted at the beginning of 2013 was the same as the previous year (340,000 for the whole of France, including 310,000 for mainland France), with 50% of these in the first half year. In order to reverse the trend in unemployment by the end of the year, in June 2013 the Ayrault government announced an extension of 92,000 contracts in the non-profit sector. This brings to 262,000 the number of contracts signed in the second half year, and 432,000 for the year. As in 2013, 340,000 contracts are planned in the 2014 Budget Bill (PLF), but the budget allocation is nearly 20% larger, which will fund an increase in the stock of CUI-CAE. These will increase until the first half of 2014, reaching 250,000 by end 2014. The government is thus reactivating the social treatment of unemployment through greater use of short-term subsidized jobs (7-12 months), but at a level comparable to that seen in 2007 and in 2010.

In contrast, there will still be significant job losses in the private sector up to year-end 2013 due to companies being overstaffed (see our October 2013 forecasts). Subsidized jobs in the non-profit sector (+82,000 in the last quarter of 2013 compared to the last quarter of the previous year) will nevertheless stabilize the unemployment rate at around 10.6% in late 2013 / early 2014.

tab_2410_blogang


Total employment began rising again in 2014 (41,000 jobs), driven by the creation of subsidized jobs in the non-profit sector, but also by the expansion of the generation contract and CICE programmes. The CICE, which is open to all businesses, will be equivalent to 6% of payroll, excluding employer social security contributions, and corresponds to wages of less than 2.5 times the minimum wage (SMIC). According to the assessment made by Mathieu Plane (2012) using the e- mod.fr model, the CICE will decrease labour costs in the private sector by on average 2.6%, which should result in the creation of jobs, both by promoting the substitution of labour for capital and through gains in competitiveness. In total, by 2018, five years after its establishment, the CICE will have created 152,000 jobs, thus lowering the unemployment rate by 0.6 percentage point. At the horizon of our forecast, it will have created 46,000 jobs, or half the government’s forecast (91,000).

The generation contract covers unemployment among both younger (under age 26) and older workers (over 57). It consists of the creation of a permanent contract (CDI) for a young person, linked to the promise of non-dismissal of an older worker for a period of 5 years. In return for this commitment, the company will receive a lump sum grant of up to 4,000 euros per year for 3 years. This type of measure runs the risk of generating significant deadweight effects.[1] Overall, the measure will result in 99,000 new jobs in the private sector, with the signing of 500,000 generation contracts over the 5-year period. In September 2013, 10,000 generation contracts were signed. Under the assumption of a gradual ramp-up by the end of 2013 (20,000 contracts signed), with 100,000 contracts signed in 2014, this should correspond to the net creation of nearly 4,000 jobs in 2013 and about 20,000 jobs in 2014.

Despite this, unemployment will continue to rise over the two years (+174,000 in 2013 and +75,000 in 2014 compared to the same quarter of the previous year), due to a still dynamic workforce (+116,000 in 2014 after +83,000 in 2013 ) and a lack of net job creation in the private sector (see the table above). Given the subsidized jobs in the non-profit sector as well as the private sector programmes, the unemployment rate in mainland France will temporarily stabilize at 10.6 % in the fourth quarter of 2013, before gradually creeping up to 10.9% of the workforce in mainland France by late 2014. By the end of 2014 it will surpass the historic peak reached in the first half of 1997 (10.8% of the workforce), with no prospect of reversing the trend over our forecast horizon. However, without the impact of the jobs programmes, the unemployment rate would have increased much more, to 11.6 % at end 2014 (Figure 2).

graph2_2410blogang


[1] See the OFCE Note of July 2012 on “An assessment of the 2012-2017 five-year economic plan”. Companies will benefit from this aid, including for the jobs they would have created even in the measure’s absence. The way the measure is implemented should limit the deadweight loss: aid linked to the implementation of the generation contract will for instance be reserved for companies with fewer than 300 employees. Companies with over 300 employees, where the risk of a windfall effect is greatest, will be obliged to set up the programme on pain of financial penalty. In addition, the lump sum of 2000 euros represents a total exemption from employer social charges at the level of the SMIC, and above that decreases in proportion to the salary. This helps to limit the windfall effect, since the elasticity of employment to labour costs is higher for low wages.


France: the rise in cyclical unemployment continues

By Bruno Ducoudré

The Great Recession, which began in 2008, has resulted in a continuous and inexorable rise in unemployment in France, by 3.1 percentage points between the low point reached in the first quarter of 2008 (7.1% in mainland France) and the peak in the fourth quarter of 2012. The unemployment rate is now close to the record levels reached in the late 1990s. This rise can be broken down into a change in the rate of cyclical unemployment due to the lack of economic growth, and a change in the rate of structural unemployment. The latter gives information on the extent of the output gap, which is crucial for measuring the structural deficit. Consequently, any choice about the fiscal policy to be adopted to re-balance the public finances needs an analysis of the nature of the additional unemployment generated by the crisis. In other words, has the crisis mainly resulted in cyclical unemployment or structural unemployment?

A study of the Non-Accelerating Inflation Rate of Unemployment (NAIRU)[1] offers one way of analysing whether the unemployment is structural or cyclical. Based on an estimate of the wage-price spiral, we propose in the OFCE’s  2013-2014 forecasts for the French economy taking a look at the level of the equilibrium rate of unemployment (ERU) using a recursive estimate of the NAIRU since 1995 in order to identify the share of cyclical unemployment.

First, our estimate of the ERU takes good account of the lack of real inflationary pressures since 1995. Indeed, the actual unemployment rate is consistently higher than the ERU over this period (Figure 1). However, between 1995 and 2012 underlying inflation varies between 0 and 2%. It reaches 2% in 2002 and 2008, times when the actual unemployment rate is closer to the ERU, although this does not reflect the real inflationary pressures. In 2012, the increase in the unemployment rate led to a wider gap with the equilibrium rate of unemployment and was accompanied by a slowdown in underlying inflation, which fell below 1% by the end of the year.

Second, the NAIRU is estimated at 7.2% on average over the years 2000-2012, with an average inflation rate of 1.9% over the period. Inflation rose to an average 7.7% over the period 2008-2012 (Table 1) and to 7.8% in 2012 (Figure 1).

Third, these estimates also indicate that the NAIRU has increased by 0.9 percentage points since the onset of the crisis. This explains at most 30% of the rise in the unemployment rate since 2008, with the remainder coming from an increase in cyclical unemployment. The cyclical component of unemployment would therefore represent 2.1 percentage points of unemployment in 2012. This change in the gap between the actual unemployment rate and the equilibrium rate of unemployment is also consistent with underlying inflation, which has been declining since 2009. Given our forecast of unemployment, this gap will increase by 1.5 percentage points, to a level of 3.6% in 2014 on an annual average.

Estimates of the equilibrium rate of unemployment thus indicate that the gap with the actual unemployment rate has widened during the crisis. The share of cyclical unemployment has increased, with the rise in cyclical unemployment accounting for about 70% of the rise in the unemployment rate since 2008. This confirms our diagnosis of a high output gap for the French economy in 2012, a gap that will continue to widen in 2014 under the combined impact of fiscal austerity and a high fiscal multiplier.

This text draws on the analysis of the economic situation and the forecast for 2013-2014, which is available [in French] on the OFCE site.


[1] The NAIRU is the rate of unemployment at which the inflation rate remains stable. Above it, inflation slows, which eventually makes possible an increase in employment and a reduction in unemployment. Below it, the dynamic is reversed, leading to higher inflation, a fall in employment and a return of unemployment to its equilibrium level.


A recession is not inevitable

By Marion Cochard, Bruno Ducoudré and Danielle Schweisguth

The cold blast from the autumn forecasts continues with the publication of the European Central Bank’s latest forecasts. Revising its growth outlook for the euro zone downwards (to -0.3% for 2013, against the forecast of 0.9% in September), the ECB in turn is now pointing to the reinforced austerity measures and the growing impact of uncertainty in the financial markets. It is clear that the intensity of the fiscal consolidation is paralyzing growth in the euro zone through the interplay of the fiscal multipliers, while not managing to restore confidence. In this note we show that the recessionary spiral that the euro zone is getting sucked into is not an inevitability.

In the first edition of the 2013 iAGS report, which was produced in partnership with the German IMK institute and the Danish ECLM institute, the OFCE offers an alternative strategy to the current fiscal consolidation policy. This alternative would make it possible to restore growth in the medium term while still meeting the European budget commitments. As Jérôme Creel showed in his latest post, “Could France have a different fiscal policy?”, there is room for budgetary manoeuvring in a way that is consistent with the current treaty framework.

Under the aegis of the European Commission, the European countries have pledged to continue their austerity programmes from 2013 to 2015 on a relatively large scale, especially if we take into account the efforts already made. Apart from Germany, where the cumulative fiscal impulse will be virtually nil, most European countries are planning to reduce their primary structural deficit by more than 2 GDP points between 2012 and 2015 (from -1.4 points for Finland to -7.5 points for Greece, cf. the table).

These adjustments are being undertaken in a very poor economic climate, which has been marked by austerity budgets from 2010 to 2012: growth in the euro zone will be -0.4% in 2012 and -0.3% in 2013. However, according to a series of recent theoretical and empirical studies[1], the fiscal multipliers turn upwards as the economic cycle heads downwards. In this context, the speed and magnitude of the fiscal adjustment is especially costly in terms of growth, and thus counter-productive in terms of the fiscal consolidation.[2] Encouraging a return to growth by easing the austerity would enable the economies of the euro zone to pull out of their recessionary spiral, which is marked by a steep rise in unemployment.

In order to develop this alternative strategy, we used the iAGS model to carry out simulations for the euro zone countries over a period of 20 years. These were conducted in two steps:

  1. In our central scenario, we integrated the planned budget cuts announced by the various countries up to 2015. Starting from 2016, we calculated the fiscal impulses needed to achieve the 60% debt threshold by 2032, while limiting the size of these impulses to +/-0.5 GDP points per year. As shown in Figure 1 (central scenario), the structural adjustment carried out between 2010 and 2015 is significant enough in most countries to allow a relaxation of economic policy starting in 2016, while meeting the debt criterion by 2032.
  2. For each country, we then decided on an alternative budget strategy by staggering the reduction of the structural deficit over time. This strategy consists in starting in 2013 with the implementation of fiscal impulses of a more limited amount in absolute value than those announced by the current governments (maximum +/-0.5 GDP points per year), and doing this until the adjustment is sufficient to achieve the debt target of 60% of GDP by 2032. This strategy leads to more measured fiscal adjustment for the euro zone countries in difficulty and to slightly positive fiscal impulses in countries whose debt trajectory is in better shape (Germany, Finland, and Italy). For the zone as a whole, the fiscal impulse is almost zero in 2013 and 2014, with the bulk of the adjustment spread from 2017 to 2024.


Figure 1 shows the difference in the level of GDP between the two scenarios. Limiting the size of the fiscal impulses helps to achieve a higher level of GDP and is compatible with a debt target of 60% of GDP by 2032 (alternative scenario). The effectiveness of the fiscal consolidation is enhanced when it is being conducted in an environment that is less unfavourable to the economy. This strategy achieves the same debt target with a cumulative fiscal adjustment that is 50 billion euros less than in the central scenario.

According to our calculations, the alternative scenario would restore a 2% growth rate in the euro zone in 2013, compared with -0.3% if the planned fiscal policies are carried out. The revival of activity would boost the labour market and help to turn around the unemployment rate in 2013, with a decline to 10.2% in 2015, compared with 12.8% if the austerity policies are continued, representing 3 million fewer unemployed people in 2015.


[1] A review of the recent literature on fiscal multipliers: size matters!

[2] What is the value of the fiscal multipliers today?