Trump’s budget policy: Mortgaging the future?

By Christophe Blot

While the momentum for growth has lost steam in some countries – Germany, France and Japan in particular – GDP in the United States is continuing to rise at a steady pace. Growth could even pick up pace in the course of the year as a highly expansionary fiscal policy is implemented. In 2018 and 2019, the fiscal stimulus approved by the Trump administration – in December 2017 for the revenue component, and in February 2018 for the expenditure side – would amount to 2.9 GDP points. This level of fiscal impulse would come close to that implemented by Obama for 2008. However, Trump’s choice has been made in a very different context, since the unemployment rate in the United States fell back below the 4% mark in April 2018, whereas it was accelerating 10 years ago, peaking at 9.9% in 2009. The US economy should benefit from the stimulus, but at the cost of accumulating additional debt.

Donald Trump had made fiscal shock one of the central elements of his presidential campaign. Work was begun in this direction at the beginning of his mandate, and came to fruition in December 2017 with the passing of a major tax reform, the Tax Cuts and Jobs Act [1], which provided for a reduction in household income tax – in particular by reducing the maximum marginal income tax rate – and corporation tax, whose effective rate would fall from 21% to 9% by 2018 [2]. In addition to this initial stimulus, expenditure will also rise in accordance with the agreement reached with the Democrats in February 2018, which should lead to raising federal spending by USD 320 billion (1.7 GDP points) over two years. These choices will push up domestic demand through boosting household disposable income and corporate profitability, which should stimulate consumption and investment. The multiplier effect – which measures the impact on GDP of a one dollar increase in public spending or a one dollar cut in taxes – will nevertheless be relatively small (0.5) because of the US position in the cycle.

Moreover, the public deficit will expand sharply, to reach a historically high level outside a period of crisis or war (graph). It will come to 5.8% of GDP in 2018 and 7.0% in 2019, while the growth gap will become positive [3]. While the risk of overheating seems limited in the short term, the fact remains that the fiscal strategy being implemented could push the Federal Reserve to tighten monetary policy more quickly. However, an excessive rise in interest rates in a context of high public debt would provoke a snowball effect. Above all, by choosing to re-launch the economy in a favourable environment, the government risks being forced to make adjustments later when the economic situation deteriorates. This pro-cyclical stance in fiscal policy risks amplifying the cycle by accelerating growth today while taking the risk of accentuating a future slowdown. With a deficit of 7% in 2019, fiscal policy’s manoeuvring room will actually shrink.

IMG1_post28-05_ENG


[1] See the section on Budget policy: Crisis-free acceleration [“Politiques budgétaires : accélération sans crise”] in our April 2017 forecast for greater detail.

[2] See here for more on this.

[3] The growth gap expresses – as a % of potential GDP – the difference between observed GDP and potential GDP. Recall that potential GDP is not observed but estimated. The method of calculation used by the Congressional Budget Office (CBO) is explained here.


The end of a cycle?

OFCE Analysis and Forecasting Department

This text is based on the 2018-2019 outlook for the world economy and the euro zone, a full version of which is available here [in French].

Global growth remained buoyant in 2017, allowing both the recovery and the reduction in unemployment to continue, especially in the advanced countries where growth rose to 2.3%, up from 1.6% the previous year. Although there are still a few countries where GDP has not recovered to its pre-crisis level, this improvement will gradually erase the stigma of the Great Recession that hit the economy 10 years ago. Above all, activity seemed to be gathering pace at the end of the year as, with the exception of the United Kingdom, annual GDP growth continued to pick up pace (Figure 1). However, the gradual return of the unemployment rate to its pre-crisis level and the closing of growth differentials, particularly in the United States and Germany, which had widened during the crisis, could foreshadow a coming collapse of growth. The first available estimates of growth in the first quarter of 2018 seem to lend credence to this assumption.

After a period of improvement, euro zone growth stalled in the first quarter of 2018, falling from 2.8% year-on-year in the fourth quarter of 2017 to 2.5%. While the slowdown has been more significant in Germany and France, it can also be seen in Italy, the Netherlands and, to a lesser extent, Spain (Figure 2). As for the United Kingdom, the slowdown is continuing as the prospect of Brexit draws nearer, while the country’s budgetary policy is also more restrictive than in the other European countries. Japan is experiencing rather more than a slowdown, with quarterly GDP growth even falling in the first quarter. Finally, among the main advanced economic countries, growth is still gathering steam only in the United States, where GDP rose 2.9% year-on-year in the first quarter of 2018.

Does the slowdown testify to the end of the growth cycle? Indeed, the gradual closing of the gaps between potential GDP and actual GDP would steadily lead countries towards their long-term growth paths, with estimates converging at what is indicated to be a lower level. In this respect, Germany and the United States would be representative of this situation since the unemployment rate in the two countries is below its pre-crisis level. In these conditions, their growth would be slowed. It is clear that this has not been the case in the United States. We must therefore refrain from any generalized conclusion. In fact, despite the fall in unemployment, other indicators – the employment rate – provide a more nuanced diagnosis of the improvement in the state of the labour market in the US. Furthermore, in the case of France this performance is mainly the consequence of the fiscal calendar, which caused a decrease in household purchasing power in the first quarter and therefore a slowdown in consumption [1]. This would therefore amount more to an air pocket than the sign of a lasting slowdown in French growth.

Above all, the factors that have supported growth will not generally be reversed. Monetary policy will remain expansionary even if a normalization is already underway in the United States, with the euro zone to start in 2019. On the fiscal side, the focus is more often neutral and should become highly expansionary for the United States, pushing growth above its potential. Finally, there are many uncertainties about estimates of the growth gap, meaning that maneuvering room might not necessarily be exhausted in the short term. An economic recovery is in fact still not being accompanied by a return of inflationary pressures or sharp wage increases, which would then indicate that the labour market is overheating. We anticipate continued growth in the industrialized countries in 2018 and accelerating growth in the emerging countries, bringing global growth to 3.7% in 2018. Growth should then peak, slowing down very slightly in 2019 to 3.5%. In the short term, the growth cycle would not then be over.

IMG1_post18-05_ENGIMG2_post18-05_ENG


The French economy: Lasting or transitory slowdown?

By the OFCE France team

On Friday, April 27, the INSEE published the national accounts for the first quarter of 2018. With growth of 0.3%, the French economy seems to be slowing down, even though after five years of sluggish growth (0.8% on average over the period 2012-16) a recovery finally materialized in 2017 when GDP rose 2%. While the quarterly profile of GDP growth in 2018 will be marked by the timing of fiscal measures, which will affect purchasing power (rise in indirect taxation and the CSG tax) and thus the trajectory of household consumption, the impact, which is anticipated in our spring forecast (Table), should be only provisional. Household purchasing power should increase in the following quarters, with a sharp acceleration at the end of the year driven by the fall in the housing tax and the second tranche of reductions in social security contributions.

The increase in consumption, weak in the first half and strong in the second, will therefore lead growth to pick up pace through the year, from 0.3% in the first quarter to 0.7% by year end. In 2019, as a result of the rise in the tax measures to shore up household purchasing power, the latter will increase by 2.4% (from 1.6% in 2018), boosting consumption for the year as a whole (2.2% in 2019 after 1.5% in 2018), despite a further rise in indirect taxation.

Business investment is expected to continue its robust growth in 2018 and 2019, supported by the ongoing improvement in profit rates, the continued low cost of capital, and growing demand, which is keeping the utilization rate at a high level. After shrinking for several years, general government investment is set to rise again in 2018 and 2019, with the gradual roll-out of the Grand Plan d’Investissement [Major Investment Plan] and the goal of maintaining investment by local authorities. Household investment should slow, as indicated by the downturn in housing demand surveys and the outlook for housing starts, probably in connection with the reduction in budget allocations for housing and with the wait-and-see attitude on the construction market following the discussion to be expected about the ELAN bill.

A pick-up in exports, confirmed by favorable survey trends, record levels of exporter margins and strong productive investment will translate into strengthening export market shares. Given the dynamic economic environment in the euro zone, foreign trade will no longer be a drag on France’s growth in 2018 and 2019.

Given this robust growth in 2018 and 2019, job creation, driven by the market sector, will remain dynamic (+194,000 in 2018 and +254,000 in 2019), which will push down the unemployment rate to 8.4% by the end of 2018 and to 7.9% by the end of 2019 (compared to 8.6% in the fourth quarter of 2017). On the other hand, the sharp fall in new government-assisted contracts in 2018 will slow the pace of the reduction in unemployment, despite the ramp-up of the Plan Formation et de la Garantie jeunes (Training Plan and Youth Guarantee).

The public deficit will be reduced only slowly (2.4% of GDP in 2018 and 2.5% in 2019, after 2.6% in 2017), but this masks a sharp improvement in the government balance, which will reach 1.6% in 2019 excluding the one-off measure related to the conversion of the CICE credit into reductions in social contributions. However, deficit reduction should be sufficient to ensure that France leaves the corrective arm of the Stability Pact and to begin to reduce the public debt (from 97% of GDP in 2017 to 95.4% in 2019).

Tabe_Post_prevFrance_ENG


Italy: The horizon seems to be clearing

By Céline Antonin

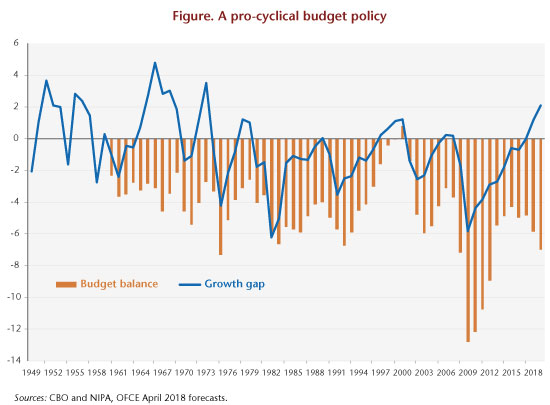
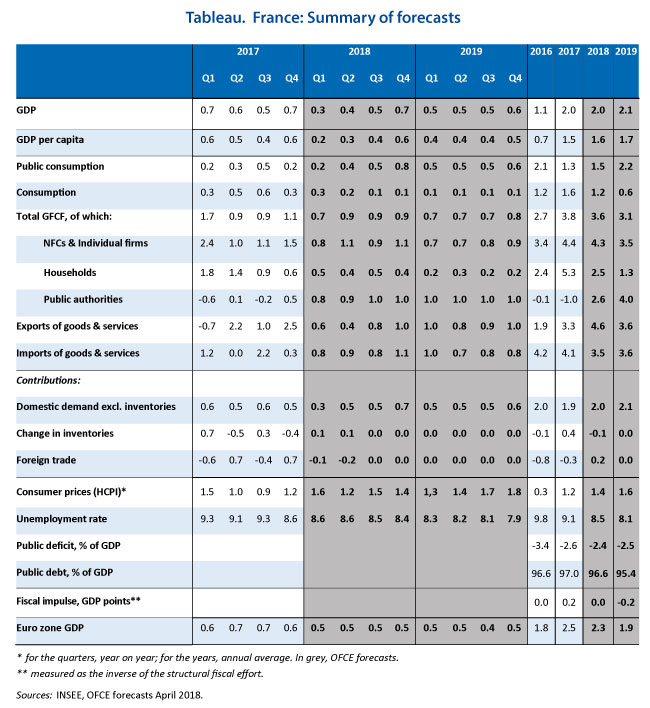
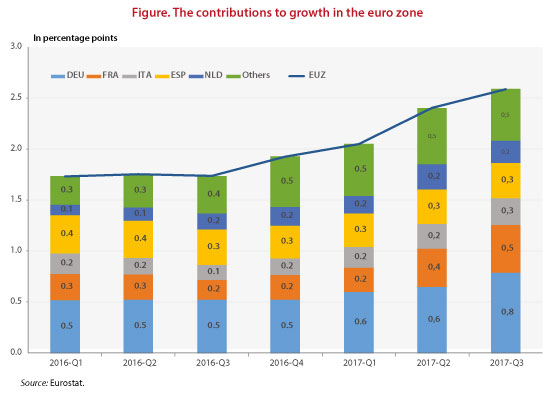
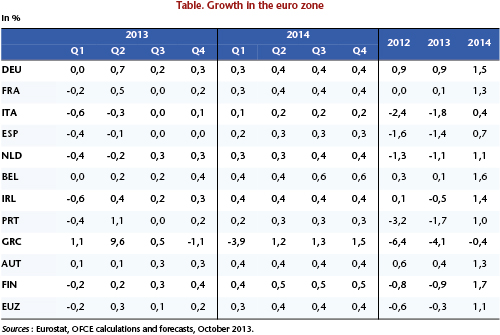
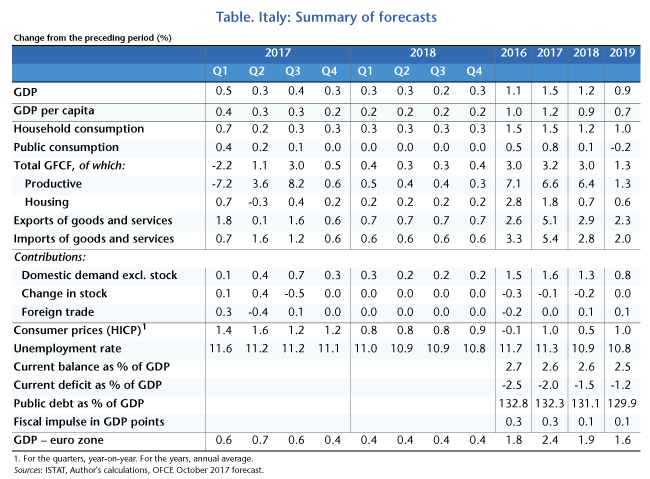
With growth in Italy of 0.4% in the third quarter of 2017 (see table below), the country’s economy seems to have recovered and is benefiting from the more general recovery in the euro zone as a whole. The improvement in growth is linked to several factors: first, the continued closing of the output gap, which had worsened sharply after a double recession (2008-2009 and 2012-2013). In addition, the expansionary fiscal policy in 2017 (+0.3 fiscal impulse), mainly targeted at businesses, and thriving consumption driven by expanding employment and rising wages explain this good performance. The increase in employment is the result of the reduction in social contributions that began in 2015 as well as the pick-up in growth in 2016 and 2017.

Despite all this, Italy remains the “sick man” of the euro zone: GDP in volume is still more than 6% below its pre-crisis level, and the recovery is less solid than for its euro zone partners. Furthermore, the public debt, now over 130%, has not yet begun to fall, potential growth remains sluggish (0.4% in 2017), and the banking sector is still fragile, as is evidenced by recent bank recapitalizations, in particular the rescue of the Monte dei Paschi di Sienna bank (see below).

In 2018-2019, Italy’s growth, while remaining above potential, should slow down. Indeed, fiscal policy will be neutral and growth will be driven mainly by domestic demand. Unemployment will fall only slowly, as the employment support measures implemented in 2017 wind down and productivity returns to its trend level [1] over the forecasting horizon (see OFCE, La nouvelle grande modération [in French], p. 71). Furthermore, the banking sector will continue its long and difficult restructuring, which will hold back the granting of bank loans.

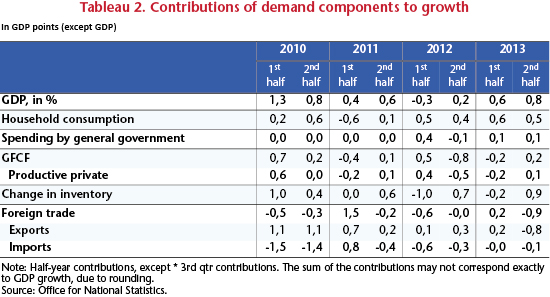
In the third quarter of 2017, the contribution of domestic demand to growth (consumption and investment) reached 0.8 point, but massive destocking attenuated the impact on growth (‑0.6 point). Gross Fixed Capital Formation (GFCF) leapt 3% in the third quarter of 2017, returning to its 2012 level, thanks to a strong increase in the productive sector (machinery, equipment and transport). Private consumption, the other pillar of domestic demand, grew on average by 0.4% per quarter between the first quarter of 2015 and the third quarter of 2017, thanks to falling unemployment and a reduction in precautionary savings. Credit conditions have improved slightly due to the quantitative easing policy pursued by the ECB, even though the channel for the transmission of monetary policy is suffering from the difficulties currently hitting the banking sector.

The number of people in employment rose to 23 million in the second quarter of 2017, back to its pre-crisis level, while the unemployment rate is declining only slowly due to the steady increase in the labour force [2]. Job creation did indeed take place between 2014 and 2017 (around 700,000 jobs created, 450,000 of them permanent), mainly due to the lowering of charges on new hires in 2015 and 2016 and the resumption of growth. Moreover, according to INPS figures, the number of new hires on permanent contracts decreased (between January-September 2016 and January-September 2017) by -3.1%, as did conversions from temporary contracts to fixed-term contracts (‑10.2%), while the numbers of new hires on temporary contracts exploded (+ 27.3%): in other words, it is mainly precarious contracts that are currently contributing to job growth. From 2018, the pace of job creation is expected to decline due to the winding down of the measures cutting employer social contributions (which represented a total of 3 billion euros) and the slowdown in economic growth. This underpins a forecast of a very slow decline in unemployment: employment is expected to rise more slowly in 2018 and 2019, but the labour force is also growing more slowly, due to a bending effect, a distortion linked to the slowdown in job creations and the retirement of the baby boom generation.

The productivity cycle in Italy is still in poor shape, despite the downward revision of the productivity trend (-1.0% for the period 2015-2019). The measures taken to cut social security contributions over the 2015-2016 period will have enriched employment growth by 27,000 jobs per quarter (extrapolating the estimates by Sestito and Viviano, Bank of Italy). Our hypothesis was for a closure of the productivity cycle over the forecast horizon, with productivity picking up pace in 2018 and 2019 [3].

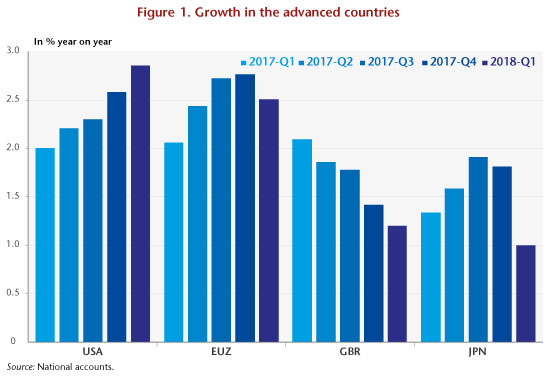
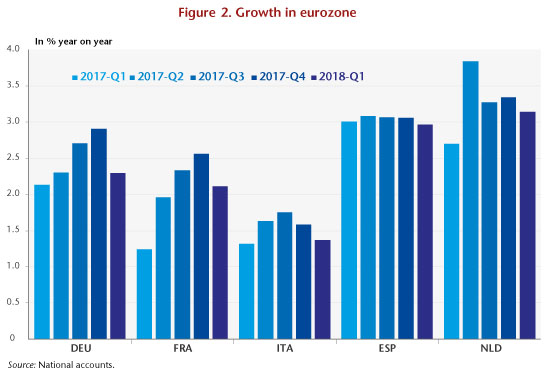
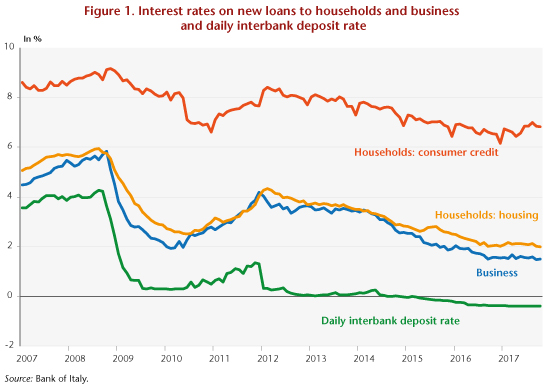
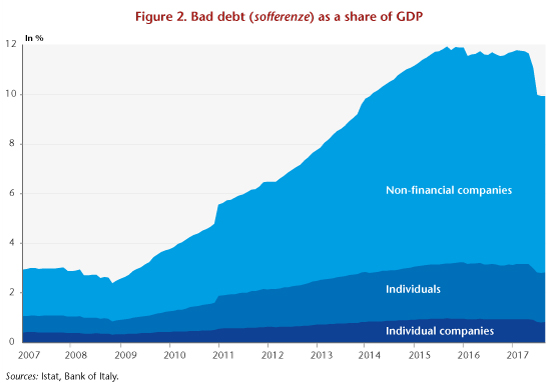
Moreover, the productive investment rate recovered strongly in the third quarter of 2017: it should continue to rise in 2018 and 2019, thanks in particular to a higher pace of extra-depreciation, to the ECB’s quantitative easing programme and to clearing up the situation of the banks, which should allow a better transmission of monetary policy (Figure 1). In addition, the amount of bad debt (sofferenze) began to fall sharply (down 30 billion euros between January and October, 2 GDP points – Figure 2). This is linked to the gradual restructuring of bank balance sheets and the economic recovery in certain sectors, particularly construction, which accounts for 43% of business bad debt.

Graphe1_post19-12_ENGGraphe2_post19-12_ENGIn 2017, it was domestic demand that was driving growth; the contribution of foreign trade was zero because of the dynamism of imports and the absence of any improvement in price competitiveness. We anticipate that the contribution of foreign trade will be null in 2018 and slightly positive in 2019 thanks to an improvement in competitiveness (Table).

Fiscal policy was expansionary in 2017 (+0.3 point impulse) and supported growth. This has mainly benefited business: support for the world of agriculture, extra-depreciation, the reduction of the corporate tax rate (IRES) from 27.5% to 24% in 2017, a boost in the research tax credit, etc. 2018 should not see a noticeable increase in taxation, and spending is expected to increase slightly (0.3%). The additional public expenditure should reach 3.8 billion euros, for: youth bonuses (youth employment measures), prolongation of extra-depreciation in industry, the renewal of civil service contracts and the fight against poverty. As for public revenue, the government has ruled out a VAT hike that would have brought in 15.7 billion euros; the adjustment will therefore come from a smaller reduction in the deficit and an increase in revenue (5 billion euros forecast). To boost revenue, the government is counting on the fight against tax evasion (repatriation, recovery of VAT with electronic invoicing), and the establishment of a web tax on large companies on the Net.

A banking sector in full convalescence

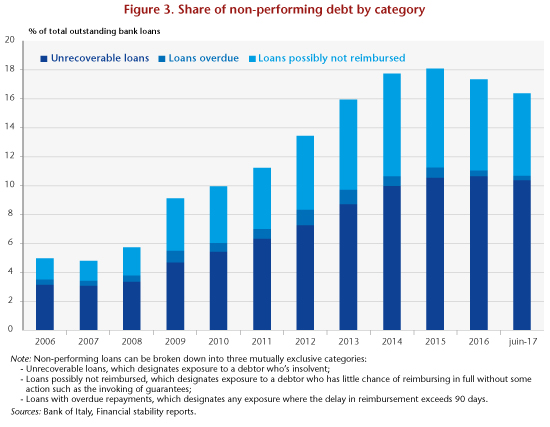
The deterioration in the situation of Italy’s businesses, in particular small and medium-sized enterprises, has led since 2009 to a sharp increase in non-performing loans. Since 2016, the situation of the Italian banking sector has improved somewhat, with a return on equity of 9.3% in June 2017 against 1.5% in September 2016. The ROE is higher than the European average (7% in June 2017) and puts the country ahead of Germany (3.0%) and France (7.2%). In addition, at the end of June 2017, the ratio of bad debt to total loans came to 16.4% (8.4% net of provisions), of which 10.4% was for unrecoverable loans (Figure 3). Banks are shedding these loans at an increasing pace with various partners (Anglo-American hedge funds, doBank, Atlante and Atlante 2 funds, etc.). Hence, between 2013 and 2016, the share of bad loans that were repaid in the year rose from 6 to 9%. Overall, the amount of bad loans was cut by 25 billion euros between 2016 and June 2017, down to 324 billion euros, of which 9 billion euros came from the liquidation of the Venetian banks (Banca Popolare di Vicenza and Veneto banca). This improvement reflects the fact that the banks are increasingly adopting active management policies for bad debts. In addition, the 2015 Asset Seizure Reform reduced the length of property seizure proceedings.

Graphe3_post19-12_ENGThe Italian government has implemented various reforms to cope with the difficulties facing the country’s banking sector. First, it has been working to accelerate the clearance of bad debts and to reform the law on bankruptcy. Legislative Decree 119/2016 introduced the “martial pact” (patto marciano), which makes it possible to transfer real estate used as collateral to creditors (other than the debtor’s principal residence); the real estate can then be sold by the creditor if the default lasts more than 6 months. Other rules aim at speeding up procedures: the use of digital technologies for hearings of the parties, the establishment of a digital register of ongoing bankruptcy proceedings, the reduction of opposition periods during procedures, an obligation for judges to order provisional payments for amounts not in dispute, the simplification of the transfer of ownership, etc.

In April 2016, the government introduced a public guarantee system (Garanzia Cartolarizzazione Sofferenze, GCS) covering bad debts, for a period of 18 months (extendable for another 18 months). To benefit from this guarantee, the bad debt must be securitized and repurchased by a securitization vehicle; the latter then issues an asset-backed security, the senior tranche of which is guaranteed by the Italian Treasury.

The Atlante investment fund was also set up in April 2016, based on public and private capital, in order to recapitalize troubled Italian banks and redeem bad debt.

There are many lessons to be drawn from the case of the Monte dei Paschi di Sienna bank (MPS, the country’s fifth-largest bank), which has been a cause of major concern. The Italian State, working in coordination with the European Commission and the ECB, had to intervene as a matter of urgency, following the failure of the private recapitalization plan at the end of 2016. A system of public financial support for banks in difficulty was introduced after a government proposal – “Salva Risparmio” [4] of 23 December 2016 – was enacted on 16 February 2017. The precautionary recapitalization of MPS was approved by the Commission on 4 July 2017 [5], in the amount of 8.1 billion euros. The Italian State increased its stake in the bank’s capital by 3.9 billion euros on the one hand, and on the other 4.5 billion euros of the bank’s subordinated bonds were converted into shares. The State is also to buy 1.5 billion euros of shares resulting from the forced conversion of bonds held by individuals (i.e. a total of 5.4 billion euros injected by the State, giving it a 70% holding in the capital of MPS). MPS will also sell 26.1 billion euros of bad debt to a special securitization vehicle, and the bank will be restructured.

Two other banks, the Venetian banks Banca Popolare di Vicenza and Veneto banca (the 15th and 16th largest banks in the country in terms of capital), were put into liquidation on 25 June 2017, in accordance with a “national” insolvency procedure, which lies outside the framework set by the European BRRD Directive [6]. The Intesa Sanpaolo bank was selected to take over, for one symbolic euro, the assets and liabilities of the two banks, with the exception of their bad debts and their subordinated liabilities. The Italian State will invest 4.8 billion euros in the capital of Intesa Sanpaolo in order to keep its prudential ratios unchanged, and it can grant up to 12 billion euros of public guarantees.

The Italian banking sector is thus in the midst of restructuring, and the process of clearing up bad debt is underway. However, this process will take time; the ECB nevertheless seems to want to tighten the rules. In early October 2017, the ECB unveiled proposals demanding that the banks fully cover the unsecured portion of their bad debt within two years at the latest, with the secured portion of the debt to be covered within at most seven years. These proposals will apply only to new bad debt. The Italian parliament and the Italian government reacted to these announcements by warning of the risk of a credit crisis. Even though these are only proposals, for now, this indicates that it is a priority to clear Italy’s bad debt rapidly, and that the government must stay the course.

Tab_-post19-12_ENG


[1] Estimated according to a model using trend breaks, we estimate the productivity trend at -1.0% for the period 2015-2019, due to growth that is more job-rich.

[2] This increase in the labour force is due to a higher participation rate among older workers (aged 55-64), which is linked to the lowering of the minimum retirement age. It is also due to women’s increased participation in the labour market, as a result of the Jobs Act (extension of maternity leave, telecommuting, financial measures to reconcile work and family life, a budget of 100 million euros for the creation of childcare services, etc.).

[3] The increase in productivity per capita in market waged employment rose from -0.7 % in 2017 to 0.3 % in 2018 and 0.6 % in 2019.

[4] The Salva Risparmio Decree Law provides for the creation of a fund with 20 billion euros to support the banking sector. This allows the State to carry out precautionary recapitalizations of banks; it provides guarantees on new issues of bank debt; and it provides liquidity from the central bank under Emergency Liquidity Assistance (ELA). It also protects savers by providing the possibility of the State buying back subordinated bonds converted into shares prior to the public intervention.

[5] European Parliament, The precautionary precaution of Monte dei Paschi di Sienna

[6] For greater detail, see the note [in French] by Thomas Humblot, Italie : liquidation de Veneto Banca et de Banca Popolare di Vicenza, July 2017.


The euro zone: A general recovery

By Christophe Blot

This text is based on the 2017-2019 outlook for the global economy and the euro zone, a full version of which is available here.

The euro zone has returned to growth since mid-2013, after having experienced two crises (the financial crisis and the sovereign debt crisis) that led to two recessions: in 2008-2009 and 2011-2013. According to Eurostat, growth accelerated during the third quarter of 2017 and reached 2.6% year-on-year (0.6% quarter-on-quarter), its highest level since the first quarter of 2011 (2.9%). Beyond the performance of the euro zone as a whole, the current situation is marked by the generalization of the recovery to all the euro zone countries, which was not the case in the previous phase of recovery in 2010-2011. Fears about the sustainability of the debt of the so-called peripheral countries were already being reflected in a sharp fall in GDP in Greece and the gradual slide into recession of Portugal, Spain and a little later Italy.

Today, while Germany remains the main engine of European growth, all of the countries are contributing to the accelerating recovery. In the third quarter of 2017, Germany’s contribution to euro zone growth was 0.8 point, a faster pace than in the previous two quarters, reflecting the vitality of the German economy (see the Figure). However, this contribution was even greater in the first quarter of 2011 (1.5 points for growth of 2.9% year-on-year). This catching-up trend is continuing in Spain, which in the third quarter of 2017 had quarterly growth of 3.1% year-on-year (0.8% quarter-on-quarter), making a 0.3 point contribution to the euro zone’s overall growth. Above all, activity is accelerating in the countries that up to now had been left a little bit out of the recovery, particularly in France and Italy, which contributed respectively 0.5 and 0.3 points to the growth of the zone over the third quarter[1]. Finally, the recovery is taking root in Portugal and Greece.

This renewed dynamism of the European economy is due to several factors. Monetary policy is still very expansionary, and the securities purchases being carried out by the Eurosystem help to keep interest rates low. Credit conditions are favourable for investment, and the access to credit for SMEs is being loosened up, especially in the countries that were hit hardest by the crisis. Finally, fiscal policy is generally neutral or even slightly expansionary.

The current optimism must not nevertheless hide the scars left by the crisis. The euro zone unemployment rate is still higher than its pre-crisis level: 9% against 7.3% at the end of 2007. The level still exceeds 10% of the active population in Italy, 15% in Spain and 20% in Greece. The social consequences of the crisis are therefore still very visible. These conditions justify the need to continue to support growth, particularly in these countries.

Graphe_post20-12_ENG


Renewed growth in the United Kingdom in 2013: trompe-l’oeil effects

By Catherine Mathieu

The latest estimate of the British national accounts, published on 27 November, confirmed GDP growth of 0.8% in the third quarter of 2013, following 0.7% in the second quarter and 0.4% in the first quarter. This represents a sparkling performance for the UK economy, especially in comparison with the euro zone. GDP was up 1.5% year on year in the third quarter of 2013 in the UK, against -0.4% in the euro zone, 0.2% in France and 0.6% in Germany. In the eyes of some observers, Britain’s return to growth shows that fiscal austerity does not undermine growth … on the contrary. But the argument seems at a minimum questionable.

Let’s look at the numbers a little more closely. Admittedly, GDP is up 1.5% year on year in the third quarter, but it rose by only 0.1% in 2012 and is still 2.5 percentage points below its pre-crisis level: this does not really represent a great success. Even more striking has been the change in GDP since the start of the crisis: GDP initially fell 7 points between the first quarter of 2008 and the second quarter of 2009; the recovery then got underway, allowing GDP to rise 2 points in the third quarter of 2010, before it fell again. The GDP trajectory since the third quarter of 2010 has been quite unusual with respect to recoveries from previous crises (Figure 1).

graph1_0212blogCMang

In 2008, the United Kingdom was one of the first industrialized countries to implement a recovery plan. Gordon Brown, Chancellor of the Exchequer in the Tony Blair government, lowered the standard VAT rate by 2.5 percentage points in December 2008 in an effort to boost household consumption. The measure, which was announced as temporary, was ended in late 2009. In 2009, fiscal policy was highly expansionary, with a fiscal impulse of 2.8 percent of GDP following a 0.6 point impulse in 2008 (Table 1). The public deficit increased under the dual impact of the recession and fiscal policy, as did the public debt.

In May 2010, the Conservatives won the election on a programme focused on reducing the public debt and deficit. This was supposed to ensure market confidence and maintain the AAA rating of Britain’s public debt, and thus keep the interest rate on the debt at a low level. This was combined with a very active monetary policy, with the Bank of England maintaining its key rate at 0.5%, buying government securities and making great efforts to facilitate the refinancing of banks and kick-start lending to businesses and households. The resumption of growth was supposed to come from business investment and exports.

The fiscal policy implemented by the David Cameron government has therefore been highly restrictive. At first, the measures focused on increasing revenue by raising the VAT rate and cutting spending, including on social benefits. The resumption of growth was interrupted. Fiscal policy had also become restrictive elsewhere in Europe, so economic activity slowed in the UK’s main trading partners. In 2012, fiscal austerity was sharply curtailed (Table 1). The growth figures in recent times are a long way from demonstrating the success of austerity.

tab1_20212postCM

It is also important to note that David Cameron has excluded health expenditure from his cost-cutting plan. The British are attached to their public health care system, and the newly elected Conservatives were determined in 2010 not to repeat the mistake made in the 1980s when Margaret Thatcher was head of government. So fiscal austerity has not hit the health sector. The result is clear in terms of activity: value added (by volume) in the health sector is now 15 points above its pre-crisis level – in other words, it has continued to grow at an average annual rate of nearly 3% (Figure 2). The second sector where activity has remained strong since 2008, and which has even accelerated since the end of 2012, is real estate. Property prices in the UK had risen sharply before the crisis, leading to record household debt, and have not dropped much since then. Indeed, they have remained historically high and even begun to rise from 2012 (at an annual rate of about 5%). But other sectors are lagging behind. Most services have for instance only now regained the level of pre-crisis output, and some of them are still well below this level: -9% for financial services and insurance, which is comparable to the figure for manufacturing, while output in the building sector is down 13%.

graph2_0212blogangCM

Since 2008, British growth has thus been driven in part by a public service spared from fiscal austerity and by real estate services supported by an ultra-active monetary policy… The British recovery could, moreover, give birth to a new housing bubble. Household consumption is now the main engine of growth (Table 2). The failure of investment to pick up represents one of the main setbacks suffered by the supply-side policy implemented since 2010 by the government. The government wants to make the UK tax system the most competitive in the G20, and to this end has slashed the corporate tax rate to the lowest in the G20 (the rate, lowered to 23% this year, will be only 20% in 2015). But business investment has nevertheless not picked up again. The government is also relying on exports to drive growth, but given the economic situation prevailing in Britain’s main foreign markets, in particular the euro zone, this is just not realistic. After having experienced sustained growth in previous quarters, boosted by strong sales outside the European Union until the summer, exports have contributed to a sharp fall-off in growth in the third quarter (-0.8 GDP point). As the British government prepares to present its budget on 5 December, support for fiscal policy would be welcome to help keep the UK economy on the road to recovery in the coming months…

tab2_20212postCM


The euro zone quartered

By Céline AntoninChristophe Blot, Sabine Le Bayon and Danielle Schweisguth

This text summarizes the OFCE’s 2013-2014 forecast for the euro zone economy.

After six quarters of decline, GDP in the euro zone has started to grow again in the second quarter of 2013. This upturn in activity is a positive signal that is also being corroborated by business surveys. It shows that the euro zone is no longer sinking into the depths of depression. It would nevertheless be premature to conclude that a recovery is underway, as the level of quarterly growth (0.3%) is insufficient to cause any significant reduction in unemployment. In October 2013, the unemployment rate stabilized at 12% of the workforce, a record high. Above all, the crisis is leaving scars and creating new imbalances (unemployment, job insecurity and wage deflation) that will act as obstacles to future growth, especially in certain euro zone countries.

Several factors point towards a pick-up in economic activity that can be expected to continue over the coming quarters. Long-term sovereign interest rates have fallen, particularly in Spain and Italy. This reflects that the threat of a breakup of the euro zone is fading, which is due in part to the conditional support announced by the ECB a little over a year ago (see Friends of acronyms: here comes the OMT). Above all, there should be an easing of fiscal austerity, given that the European Commission has granted additional time to several countries, including France, Spain and the Netherlands, to deal with their budget deficits (see here for a summary of the recommendations made by the European Commission). Driven by the same mechanisms that we have already described in our previous forecasts, a little higher growth should follow this easing of austerity (-0.4 GDP point of fiscal effort in 2013, down from -0.9 point in 2013 and -1.8 in 2012). After two years of recession in 2012 and 2013, growth is expected to come to 1.1% in 2014.

Nevertheless, this growth will not be sufficient to erase the traces left by the widespread austerity measures implemented since 2011, which pushed the euro zone into a new recession. In particular, employment prospects are improving only very slowly because growth is too weak. Since 2008, the euro zone has destroyed 5.5 million jobs, and we do not expect a strong recovery in net job creation. Unemployment could fall in some countries, but this would be due mainly to discouraged jobseekers withdrawing from the workforce. At the same time, less austerity does not mean that there will be no austerity. With the exception of Germany, fiscal consolidation efforts will continue in all the euro zone countries. And whether this is achieved through a reduction in public spending or an increase in the tax burden, households will bear the brunt of the adjustment. At the same time, the persistence of mass unemployment will continue to fuel the deflationary pressures already at work in Spain and Greece. The improved competitiveness that results in these countries will boost exports, but at the expense of increasingly undermining domestic demand. The impoverishment of the countries of southern Europe is going to be aggravated. Growth in these countries in 2014 will again be lower than in Germany, Austria, Finland and France (Table).

As a consequence, the euro zone will be marked by increasing heterogeneity, which could wind up solidifying public opinion in different countries against the European project and making the governance of the monetary union more difficult as national interests diverge.

Tab_Post-28-10ang


France: less austerity, more growth

By Eric Heyer

This text summarizes the OFCE’s 2013-2014 forecast for the French economy.

In 2013, the French economy should experience annual average growth of 0.2%, which means that by the end of the year its level of production should return to the level of six years earlier, at the end of 2007. This mediocre performance is very far from the trajectory that an economy recovering from a crisis should be on.

The French economy did however have great potential for recovery: average spontaneous growth of about 2.6% per annum over the period 2010-2013 was possible and would have allowed France to make up the output gap accumulated in 2008-2009. But this “recovery” has been hampered mainly by the introduction of budget savings plans in France and across Europe. For the single year 2013, this fiscal strategy will cut economic activity in France by 2.4 GDP points.

The understanding that the fiscal multipliers were high came late, and occurred only after the austerity plans had already had a negative impact on growth. At the end of May 2013, this awareness pushed the European authorities to give additional time to six EU countries, including France, to correct their excessive deficits. The easing of the Commission’s requirements provided a breath of fresh air that enabled the government to relax the austerity measures set for 2014. According to the budget presented in autumn 2013, the domestic impact of the austerity measures will be reduced by 0.5 GDP points between 2013 and 2014; since our partners are also relaxing their policies, a boost to external demand is also anticipated. Overall, the easing of austerity will mean the addition of almost one point of growth in 2014 compared to 2013, despite the still high fiscal multipliers.

In these conditions, growth should come to 1.3% in 2014 on an annual average. By running at a rate still below its potential, the forecast growth will add to the output gap accumulated since 2008 and will continue to hurt the labour market. The unemployment rate in metropolitan France will rise slightly, reaching 10.9% by end 2014.

As a result of the easing of austerity, the public deficit will be higher than what was initially planned. It is expected to come to 3.5% of GDP in 2014, after reaching 4.1% in 2013, with gross government debt near 95% of GDP next year.


Does too much finance kill growth?

By Jérôme Creel, Paul Hubert and Fabien Labondance

Is there an optimal level of financialization in an economy? An IMF working paper written by Arcand, Berkes and Panizza (2012) focuses on this issue and attempts to assess this level empirically. The paper highlights the negative effects caused by excessive financialization.

Financialization refers to the role played by financial services in an economy, and therefore the level of indebtedness of economic agents. The indicator of the level of financialization is conventionally measured by calculating the ratio of private sector credit to GDP. Until the early 2000s, this indicator took into account only the loans granted by deposit banks, but the development of shadow banking (Bakk-Simon et al., 2012) has been based on the credit granted by all financial institutions. This indicator helps us to understand financial intermediation (Beck et al., 1999) [1]. The graph below shows how financialization has evolved in the euro zone, France and the United States since the 1960s. The level has more than doubled in these three economies. Before the outbreak of the subprime crisis in the summer of 2007, loans to the private sector exceeded 100% of GDP in the euro zone and 200% in the United States.

Graphe-Blog_English-28-08

Arcand, Berkes and Panizza (2012) examined the extent to which the increasingly predominant role played by finance has an impact on economic growth. To understand the importance of this paper, it is useful to recall the existing differences in the findings of the empirical literature. On the one hand, until recently the most prolific literature highlighted a positive causal relationship between financial development and economic growth (Rajan and Zingales, 1998, and Levine, 2005): the financial sector acts as a lubricant for the economy, ensuring a smoother allocation of resources and the emergence of innovative firms. These lessons were derived from models of growth (especially endogenous) and have been confirmed by international comparisons, in particular with regard to developing countries with small financial sectors.

Some more skeptical authors believe that the link between finance and economic growth is exaggerated (Rodrik and Subramanian, 2009). De Gregorio and Guidotti (1995) argue that the link is tenuous or even non-existent in the developed countries and suggest that once a certain level of economic wealth has been reached, the financial sector makes only a marginal contribution to the efficiency of investment. It abandons its role as a facilitator of economic growth in order to focus on its own growth (Beck, 2012). This generates major banking and financial groups that are “too big to fail”, enabling these entities to take excessive risks since they know they are covered by the public authorities. Their fragility is then rapidly transmitted to other corporations and to the economy as a whole. The subprime crisis clearly showed the power and magnitude of the effects of correlation and contagion.

In an attempt to reconcile these two schools of thought, a nonlinear relationship between financialization and economic growth has been posited by a number of studies, including in particular the Arcand, Berkes and Panizza (2012) study. Using a dynamic panel methodology, they explain per capita GDP growth by means of the usual variables of endogenous growth theory (i.e. the initial GDP per capita, the accumulation of human capital over the average years of education, government spending, trade openness and inflation) and then add to their model credit to the private sector and the square of this same variable in order to take account of potential non-linearity. They are thus able to show that:

  1. The relationship between economic growth and private sector credit is positive;
  2. The relationship between economic growth and the square of private sector credit (that is to say, the effect of credit to the private sector when it is at a high level) is negative;
  3. Taken together, these two factors indicate a concave relationship – a bell curve – between economic growth and credit to the private sector.

The relationship between finance and growth is thus positive up to a certain level of financialization, and beyond this threshold the effects of financialization gradually start to become negative. According to the different specifications estimated by Arcand, Berkes and Panizza (2012), this threshold (as a percentage of GDP) lies between 80% and 100% of the level of loans to the private sector. [2]

While the level of financialization in the developed economies is above these thresholds, these conclusions point to the marginal gain in efficiency that financialization can have on an economy and the need to control its development. Furthermore, the argument of various banking lobbies, i.e. that regulating the size and growth of the financial sector would negatively impact the growth of the economies in question, is not supported by the data in the case of the developed countries.


[1] While this indicator may seem succinct as it does not take account of disintermediation, its use is justified by its availability at international level, which allows comparisons. Furthermore, more extensive lessons could be drawn with a protean indicator of financialization.

[2] Cecchetti and Kharroubi (2012) clarify that these thresholds should not be viewed as targets, but more like “extrema” that should be reached only in times of crisis. In “normal” times, it would be better that debt levels are lower so as to give the economies some maneuvering room in times of crisis.


A fiscal policy to promote structural reform – lessons from the German case

By Eric Heyer

“France should copy Germany’s reforms to thrive”, Gerhard Schröder entitled an opinion piece in the Financial Times on 5 June 2013. As for the European Commission (EC), its latest annual recommendations to the Member states, released on 29 May, seem to take a step back from its strategy of a rapid and synchronized return to balancing the public finances, which has been in place since 2010. The EU executive’s priority now seems to be implementation of structural reforms of the labour and services markets in the euro zone countries. These countries will of course continue to consolidate their public finances, but the EC has given them an extra year or two to do this. While, for example, France will further consolidate its accounts over the coming two years (the fiscal effort demanded of the French government by the EC comes to 0.8 percent of GDP, or 16 billion euros per year), it has been given another two years to bring its deficit below 3% of GDP (2015 instead of 2013). This change in course – or at least in tone – by the EC, which had emphasized the enactment of extreme austerity reforms, should be welcomed. However, it is important to consider whether the new environment, in particular the fiscal situation, will be favourable enough to ensure that the structural reforms are effective. An examination of the economic context in which Germany introduced its reforms in the early 2000s, which became a benchmark for the countries of southern Europe, provides some important lessons. While the purpose here is not to go into these reforms in depth, it is nevertheless useful to remember that they were enacted while the German economy had a substantial trade deficit (‑1.8 percent of GDP in 2000 against a surplus of 1.4 percent for France at that same time) and was considered a “low achiever” in Europe. These reforms led to a significant reduction in the share of wages in value added, boosting the margins of German business, and helped to quickly restore the competitiveness of the German economy: by 2005, Germany was once again generating a large trade surplus while France ran a deficit for the first time since 1991. The non-cooperative character of the the euro zone (OFCE, 2006) and the steep increases in Germany in poverty – (Heyer, 2012) and Figure 1 – and in wealth inequality (de Grauwe et Yi, 2013) were the hidden fruit of this strategy. Europe’s “low achievers” today are the southern European countries, and the pressure to take steps to boost competitiveness has shifted from Germany to France, Italy and Spain. Despite this parallel, the question remains: is the economic environment similar today? Figures 1 and 2 summarize the economic situation in Germany at the time the structural reforms were implemented. Two main points stand out:

  1. These reforms were carried out in a context of strong global growth: the world experienced average growth of over 4.7% per year in 2003-2006 (Figure 1).  By comparison, the figure for growth is likely to be less than 3% over the next two years;
  2. In addition, the fiscal situation of the German economy in the early 2000s was not good: in 2001, the general government deficit for Germany exceeded 3%, and came close to 4% in 2002, the year before the enactment of the first Hartz reform. Government debt then exceeded the threshold of 60% of GDP allowed by the Maastricht Treaty for the first time. Despite this poor fiscal performance – with public debt approaching 70% in 2005 – it is interesting to note that the German government continued to maintain a highly expansionary fiscal policy for as long as the reforms had not been completed: in the period 2003-2006, the fiscal impulse was positive at on average 0.7 GDP point each year (Figure 2). Thus, during this period the German government supported its structural reforms with a highly accommodative fiscal policy.

Thus not only was the structural reform of the labour market conducted under Schröder implemented in a very favourable economic environment (strong global growth and a strategy that differed from the other European countries), but it was also accompanied by a particularly accommodative fiscal policy, given in particular the poor state of Germany’s public finances. This situation differs greatly from contemporary conditions:

  1. Global growth is likely to be under 3% over the coming two years;
  2. The EC is asking a large number of European countries to implement the same structural reforms simultaneously, which in a highly integrated euro zone limits their effectiveness; and
  3. Despite the extra time being granted for deficit reduction, fiscal policy will remain very tight: as is indicated in Table 1, the fiscal impulses for France and Spain will still be very negative (-0.8 GDP point per year) as the structural reforms in these countries are being implemented.

So while the pressure to boost the competitiveness of the countries of southern Europe is similar to that facing Germany in the early 2000s, the external environment is less favourable and there is greater pressure to reduce the public debt. On this last point, the German example teaches us that it is difficult to juggle structural reforms to boost business competitiveness with efforts to reduce the public debt.