Austerity in Europe: a change of course?

By Marion Cochard and Danielle Schweisguth

On 29 May, the European Commission sent the members of the European Union its new economic policy recommendations. In these recommendations, the Commission calls for postponing the date for achieving the public deficit goals of four euro zone countries (Spain, France, Netherlands and Portugal), leaving them more time to hit the 3% target. Italy is no longer in the excessive deficit procedure. Only Belgium is called on to intensify its efforts. Should this new roadmap be interpreted as a shift towards an easing of austerity policy in Europe? Can we expect a return to growth in the Old Continent?

These are not trivial matters. An OFCE Note (no. 29, 18 July 2013) attempts to answer this by simulating three scenarios for fiscal policy using the iAGS model. It appears from this study that postponing the public deficit targets in the four euro zone countries does not reflect a real change of course for Europe’s fiscal policy. The worst-case scenario, in which Spain and Portugal would have been subject to the same recipes as Greece, was, it is true, avoided. The Commission is implicitly agreeing to allow the automatic stabilizers to work when conditions deteriorate. However, for many countries, the recommendations with respect to budgetary efforts still go beyond what is required by the Treaties (an annual reduction in the structural deficit of 0.5 percent of GDP), with as a consequence an increase of 0.3 point in the unemployment rate in the euro zone between 2012 and 2017.

We believe, however, that a third way is possible. This would involve adopting a “fiscally serious” position in 2014 that does not call into question the sustainability of the public debt. The strategy would be to maintain a constant tax burden and to allow public spending to keep pace with potential growth. This amounts to maintaining a neutral fiscal stimulus between 2014 and 2017. In this scenario, the public deficit of the euro zone would improve by 2.4 GDP points between 2012 and 2017 and the trajectory in the public debt would be reversed starting in 2014. By 2030, the public deficit would be in surplus (0.7%) and debt would be close to 60% of GDP. Above all, this scenario would lower the unemployment rate significantly by 2017. The European countries could perhaps learn from the wisdom of Jean de La Fontaine’s fable of the tortoise and the hare: “Rien ne sert de courir, il faut partir à point“, i.e. Slow and steady wins the race.


France: why such zeal?

By Marion Cochard and Danielle Schweisguth

On 29 May, the European Commission sent the members of the European Union its new economic policy recommendations. As part of this, the Commission granted France an additional two years to reach the deficit reduction target of 3%. This target is now set for 2015, and to achieve this the European Commission is calling for fiscal impulses of -1.3 GDP points in 2013 and -0.8 point in 2014 (see “Austerity in Europe: a change of course?”). This would ease the structural effort needed, since the implementation of the previous commitments would have required impulses of -2.1 and -1.3 GDP points for 2013 and 2014, respectively.

Despite this, the French government has chosen not to relax its austerity policy and is keeping in place all the measures announced in the draft Finance Act (PLF) of autumn 2012. The continuing austerity measures go well beyond the Commission’s recommendations: a negative fiscal impulse of -1.8 GDP point, including a 1.4 percentage point increase in the tax burden for the year 2013 alone. Worse, the broad guidelines for the 2014 budget presented by the government to Parliament on 2 July 2013 point to a structural effort of 20 billion euros for 2014, i.e. one percentage point of GDP, whereas the Commission required only 0.8 point. The government is thus demanding an additional 0.6 GDP point fiscal cut, which it had already set out in the multi-year spending program in the 2013 Finance Act.

The table below helps to provide an overview of the effort and of its impact on the French economy. It shows the trends in growth, in unemployment and in the government deficit in 2013 and 2014, according to three budget strategies:

  1. One using the relaxation recommended by the Commission in May 2013;
  2. One based on the budget approved by the government for 2013 and, a priori, for 2014;
  3. One based on an alternative scenario that takes into account the negative 1.8 GDP point fiscal impulse for 2013 and calculates a fiscal impulse for 2014 that would be sufficient to meet the European Commission’s public deficit target of -3.6%.

MC_DS_Tab_Blog29-07English (2)

According to our estimates using the iAGS model [1], the public deficit would be cut to 3.1% of GDP in 2014 in scenario (2), whereas the Commission requires only 3.6%. As a consequence of this excess of zeal, the cumulative growth for 2013 and 2014 if the approved budget is applied would be 0.7 percentage point lower than growth in the other two scenarios (0.8 point against 1.5 points). The corollary is an increase in unemployment in 2013 and 2014: the unemployment rate, around 9.9% in 2012, would thus rise to 11.1% in 2014, an increase of more than 350,000 unemployed for the period. In contrast, the more relaxed scenario from the European Commission would see a quasi-stabilization of unemployment in 2013, while the alternative scenario would make it possible to reverse the trend in unemployment in 2014.

While the failure of austerity policy in recent years seems to be gradually impinging on the position of the European Commission, the French government is persisting along its same old path. In the face of the social emergency that the country is facing and the paradigm shift that seems to be taking hold in most international institutions, the French government is choosing to stick to its 3% fetish.


[1] iAGS stands for the Independent Annual Growth Survey. This is a simplified model of the eleven main economies in the euro zone (Austria, Belgium, Finland, France, Germany, Greece, Ireland, Italy, Netherlands, Portugal and Spain). For more detail, see the working document Model for euro area medium term projections.


How can one defend the 1%?

By Guillaume Allègre

In a forthcoming article in the Journal of Economic Perspectives[1], Harvard Professor and bestselling textbook author Greg Mankiw defends the income earned by the richest 1% and denounces the idea of taxing them at a marginal rate of 75%. For Mankiw, people should receive compensation in proportion to their contributions. If the economy were described by a classical competitive equilibrium, then every individual would earn the value of his or her own marginal productivity, and it would be neither necessary nor desirable for the government to redistribute income. The government would limit itself to correcting market distortions (externalities, rent-seeking).

In a OFCE’s Note (no. 4, 19 July 2013), we show that the economy in which the 1% live is very different from a classic competitive equilibrium in ways that Mankiw does not discuss, which seems to us to be a significant limitation in his argument. It is because the 1% do not live in a world of perfect competition that they are able to secure astronomical incomes. The incomes received on the market by the 1% do not therefore correspond to their marginal social contribution. This does not mean that their social contribution is null, but rather that the market is unable to measure this contribution. These astronomical incomes cannot therefore be defended on the basis of “merit measured by marginal contribution”, as proposed by Mankiw.

_____________

See the following OFCE blogs on the same subject: “Superstars and equity: Let the sky fall” and “Pigeons: how to tax capital gains”.


[1] G. Mankiw, 2013, “Defending the one percent”, forthcoming Journal of Economic Perspectives. http://scholar.harvard.edu/files/mankiw/files/defending_the_one_percent_0.pdf


Tales from EDF

By Evens Saliesa

The challenge facing policy-making on the reduction of greenhouse gas emissions is not just environmental. It is also necessary to stimulate innovation, a factor in economic growth. Measures to improve energy efficiency [1] demand high levels of investment to transform the electricity network into a smart grid. To this end, EU Member States have until 2020 to replace the meters of at least 80% of their customers in the residential and commercial sectors with “smarter” meters. In France, these two sectors account for 99% of the sites connected to the low-voltage grid (< 36 kVA), or about 43% of electricity consumption and nearly 25% of greenhouse gas emissions (without taking into account emissions from the production of the electrical power that supplies these sites).

These new meters have features which, as has been shown by research, lead to lower energy consumption. The remote reading at 10 minute intervals of data on consumption, which is transmitted in real time to a remote display (a computer screen, etc.), immediately shows the savings in electricity, which, with two surveys per year, was previously impossible. High-frequency remote reading also makes it possible to expand the range of vendor contracts to include rates that are better suited to customers’ actual consumption profiles. The “pilot” flying the transmission network can better optimize the balance between demand and a supply system that has fragmented due to the growing number of small independent producers. For distributors [2], remote reading solves the problem of gaining access to meters [3].

These features are supposed to create the conditions for the emergence of a market for demand-side management (DSM) that is complementary to the supply market. This market would give non-traditional suppliers an opportunity to differentiate themselves further by offering services that are tailored to the needs of the DSM customer [4]. This could lead to significant gains in innovation if other companies that specialize in information and communication technology also develop software applications that are adapted to the use of the smart meters. However, in France, the policy on the roll-out of smart meters does not seem to be facilitating greater competition. Innovation could stop at the meter due to a decision by the French Regulatory Commission (CRE) which states that:

“The features of advanced metering systems must strictly meet the missions of the electricity [distributors] … Thus the additional features requested by some stakeholders [essentially suppliers] which are subject to competition (basically remote displays) are not accepted.”

A reading of this paragraph would seem to indicate that the suppliers are not willing to bear the cost of developing these features. However, according to Article 4 of this decision, which specifies the list of features for distributors, none of them seems to have been left exclusively to the competitive sector. In practice, households with a computer can check their consumption data without going through their provider or a third party.

It is worth considering the costs and benefits of such an approach, which a priori would seem to amount to the monopolization of the DSM market by the distributors.

This approach will make it possible to quickly reach the goal of 80%, since the CRE has opted for a public DSM service: the distributors, who have public service obligations, will roll out the smart meters. The “Linky” meter alone, from the dominant electricity distributor, the ERDF, will be installed on 35 million low-voltage sites, covering 95% of the national distribution network [5]. There is thus little risk of under-investment in the demand-response capacity that electricity suppliers will soon have. In fact, as the suppliers do not have to bear the costs of the manufacture and deployment of the meters, they can quickly invest in the development of these capabilities. In addition, the equalization of subcontracting costs for the manufacturing of the meters and their installation throughout the French distribution network will make for considerable economies of scale. Finally, the low rate of penetration of meters in countries that have opted for a decentralized approach (the cost of the meter and services are then borne partly by the households concerned) argues in favour of the French model. This model is more practical since it removes most of the barriers to adoption.

Despite this, the degree of concentration in the business of the distribution and supply of electricity to households raises questions: ERDF is affiliated with EDF and has a virtual monopoly on the supply of electricity to households. In terms of innovations in DSM services, it would seem that EDF has little reason to go beyond its subsidiary’s Linky project – first, because of the costs already incurred by the Group (at least five billion euros), and second, because the quality of the default basic information mechanism in Linky will be sufficient to lead to a cost for migrating to DSM services offered by competitors. [6] Alternative suppliers will of course be able to introduce innovative tariffs. But so will EDF. One way to overcome this problem would be to set up a Linky platform so that other companies’ applications could interact with its operating system. With the agreement of the household and possibly a charge for access to the data, the business would of course be regulated, but entry would be free. This would stimulate innovation in DSM services, but would not increase competition since these companies would not be electricity suppliers. Would the consumer have a lot to lose? This would obviously depend on the amount of the reduction in their bills. Given that the price of electricity is likely to rise by 30% by 2017 (including inflation), we are worried that consumers’ efforts to optimize their consumption will not be rewarded. The net gain in the medium term could be negative.

Finally, we can ask ourselves whether with Linky the EDF group is not trying to reinforce its position as the dominant company in the supply of electricity, a position that has grown weaker since the introduction of competition. With DSM service installed by default on 95% of the country’s low-voltage sites, Linky will become an element in the network infrastructure that all DSM service providers will have to use. From the point of view of the rules on competition, one must then ask whether ERDF and its partners have properly communicated information about the Linky operating system, without any favouritism being shown to the EDF Group and its subsidiaries (Edelia, NetSeenergy). The  story tellers would like to tell us a beautiful tale about encouraging innovation in energy and the digital economy in order to deal with the ecological transition. Knowing that the current CEO of the company in charge of the architecture of the Linky information system, Atos, was Minister of the Economy and Finance just prior to the launch of the Linky project in 2007, there seems to be room for doubt ….


[1] “Energy efficiency improvement” and “energy savings” are used interchangeably in this post. For precise definitions, see Article 2 of Directive 2012/27/EU of the European Parliament and of the Council.

[2] The distributors manage low and medium-voltage lines. ERDF has the largest network. The networks and meters are licensed equipment, which are the property of the local public authorities.

[3] This would nevertheless involve, for example for ERDF, the elimination of 5000 jobs (compared with 5900 retirements, see Senate Report no. 667, 2012, Vol. II, p. 294).

[4] In accordance with the NOME law of 2010, suppliers and other operators must be able to make ad hoc reductions in the consumption of electricity for certain customers (temporarily cut the supply to an electric boiler, etc.), which is called demand-response load-shedding.

[5] In areas where the ERDF is not a supplier, other experiments exist, such as that of the distributor SRD in Vienna, which has installed its smart meter, i-Ouate, on 130,000 sites.

[6] See the document by the DGEC, 2013, the Working group on smart electricity meters (GTCEC) – Coordination document, February [in French].

———-

The author would like to thank C. Blot, K. Chakir, S. Levasseur, L. Nesta, F. Saraceno, and especially O. Brie, M.-K. Codognet and M. Deschamps. The opinions expressed in this post are those of the author alone.


Livret A accounts – drowning in criticism

By Pierre Madec

As the Governor of the Bank of France and the Minister of the Economy and Finance announced a further (probable) reduction in the interest rate on Livret A accounts for August 1st, the rating agency Standard&Poor’s (S&P) released a study of the French banking system. The U.S. agency argues that Livret A accounts, and regulated savings more generally, “penalize French banks” and are at the root of “distortions in the banking market”. This debate, which is hardly new, has been the subject of a number of reports: Duquesne, 2012; Camdessus, 2007; Noyer-Nasse, 2003, and more. Some ardently defend the peculiar French approach represented by Livret A, while others advocate, on the contrary, a deep-going reform of a system they describe as “lose-lose”.

So what’s the actual situation? Do Livret A accounts really threaten the French banking system? How are the household savings deposited in them used? What has been the impact of the series of increases in the ceilings on deposits? What will be the impact of the (probable) new rate cut proposed by the Minister of Economy and Finance, Pierre Moscovici, both for savers and for the financing of social housing? We provide a few answers below.

What are Livret A accounts?

Livret A accounts date from almost 195 years ago. They are a regulated investment that gives the right to a fiscal benefit (exemption from all taxation and social charges), with guaranteed deposits at a rate set by the State [1].

In 2011, the French savings rate was 16% on average, which was 1.1 points higher than in 2006. The increase in the savings rate went largely into regulated savings, and especially into Livret A accounts, which are held by 63.3 million French people, with total savings of 230 billion euros in April 2013, twice the level of January 2007. Three successive developments contributed to this massive increase in total holdings: the financial crisis, which redirected a portion of household savings into risk-free investments; the widespread distribution of Livret A passbooks to all banks after 1 January 2009, under the Act to modernize the economy [2]; and finally, the 50% increase in the ceiling on Livret A accounts, which took place in two stages (in October 2012 and January 2013). This growing attraction for Livret A is also due to the full liquidity of the accounts and the deposit guarantee – neither of which is available, for example, for life insurance.

What is the role of Livret A accounts?

One of (many) specific features of the French model for financing housing is (among others) that providers of social housing do not draw on the bond markets (Levasseur, 2011). Social landlords are therefore financed mainly (73% in 2012) by the Caisse des Depots et Consignations (CDC), where a portion of household’s Livret A savings are deposited. The CDC operates a savings fund that centralizes 65% of Livret A holdings, which in April represented more than 150 billion euros (Banque de France). The deposits made available are used primarily for lending for social housing and urban policy [3]. These borrowings are largely used for the construction, acquisition and rehabilitation of social rental housing by social landlords (HLM bailleurs), but they can also be used to finance specific housing operations and urban policy measures such as the National urban renovation plan (“NERP”). In order to secure the deposits and ensure the savings fund has the amounts needed, the amount of deposits centralized under Livret A funds must always be greater than or equal to 125% of the outstanding loans for social housing and urban policy granted by the CDC.

It is obvious that the target of building 150,000 social housing units per year (compared to 105,000 in the year 2012) will give rise to a significant increase in the sector’s financing needs [4]. To meet this goal, 13.7 billion euros in lending for social rental housing will need to be granted for one year in 2013, i.e. 4 billion more than in 2012.

Finally, the Livret A resources that are not centralized by the CDC (80 billion euros) are subject to a “duty of use”. Eighty percent must be used by the banks for financing SMEs while 10% must be used to finance energy savings measures in existing buildings [5]. Similarly, a certain number of local government investment programmes (Campus Plan, 2012 Hospital plan, Grenelle Environment programme) have benefited from Livret A funds.

Are Livret A accounts endangering the French banking system?

Given the increasing interest of households in regulated savings (especially Livret A), one might think (like S&P) that this type of investment threatens the banking system by depleting bank liquidity, which has already been undermined by the crisis. The higher ceilings established ​​in recent months have indeed led – in essence – to a transfer of savings to tax-exempt investments, whose share in total household financial savings increased by 0.6 percentage point between 2011 and 2012. In October 2012, there was a significant drop in savings accounts subject to tax (‑12 billion euros), a drop that can be explained in part by the higher ceilings on Livret A accounts (+6 billion euros) [6] (see Figure 1).

graph1_1707PMblog-English


It is important to put S&P’s alarmist declarations into perspective – on the one hand, because, except for the month of October 2012, the flow from taxed accounts has been relatively stable, and on the other hand, because in 2012 regulated savings, although up significantly, accounted for only 9.5% (6.2% of which for Livret A) of total household financial savings, which amounted to 3,664 billion euros. In addition, if there were a real and lasting lack of liquidity, technical adjustments exist or can be made. According to the latest annual report of the Cour des comptes (French Court of Auditors), at the beginning of the year the coverage ratio of savings deposits was 156% of outstanding loans to social housing and urban policy, instead of the regulatory 125%. This over-coverage represents about 50 billion euros, which are allocated neither to the financing of social housing nor to bank liquidity. Now claimed by the banks, these funds are to be quickly allocated. As the savings fund has substantial liquidity, while leaving unchanged the ratios of coverage and of centralization (the fruit of bitter negotiations), it is clear that a number of temporary transfer mechanisms between the savings fund and the banking sector could quickly deal with any risk of a liquidity crisis. Finally, note that the banks have also benefited from the more widespread distribution of Livret A, notably through the payment by the savings fund of a commission on the amounts centralized. This commission, which is directly drawn on the funds for social housing, took 1 billion euros from the savings fund in 2012. Without drawing any conclusions about what should be done with these counterflows, it is questionable whether a better trade-off could be established between the centralisation rate and the coverage rate, the commission rate and the long-term funding of social housing [7].

What about the “probable” cut in the rates?

The reduction in Livret A rates, the proposal advanced on June 23 by the Minister of the Economy, Pierre Moscovici, who was echoing the statements made a few days earlier by the Governor of the Bank of France, Christian Noyer, should come into force on August 1, and is the result of a fall in the inflation rate on which it is partly indexed. What effect would this rate cut have on the flow of savings into Livret A accounts, and thus on the financing of social housing?

In May 2013, the interest rate on Livret A was 0.5% in real terms, a relatively low level. Over the period 2011-2012, it even came to an average of zero (see Figure 2). However, the net flow remained stable over the period. This is explained partly by the low rates offered by other investments, in particular taxed savings accounts such as the CEL home savings plan, which have had a negative real net rate since late 2009. Given the trade-offs made ​​by households, in particular the wealthiest ones, in their efforts to obtain the best return on their savings, it is relatively complex to demonstrate a strict correlation between the rate on Livret A accounts (real or nominal) and changes in the total outstandings. Thus, in the second half of 2009, Livret A suffered outflows even though the real rate on it was high; in 2010 and 2011, however, net deposits were high even though the rate was no longer so high.

Given, on the one hand, the lower real net rates offered by comparable investments and, secondly, current social and economic uncertainties, we can expect some stability in the flows during the second half of 2013, despite the decline in the rate of remuneration. This stability will obviously depend on the size of the rate reduction. As the rate is currently 1.75%, it seems unlikely that the high inflows will continue if the rate is revised below 1.25%. As France’s Economic commission expects inflation of 1.2% for 2013, fixing the Livret A rate below this would result in a fall in household purchasing power, which would go against the government’s commitments.

graph2_1107PMblog

Nevertheless, it should not be forgotten that this re-valuation in the rate is not automatic and in fact depends on a political decision. In the second half of 2009, while the collapse of inflation would have justified a decrease of 1.5 points to reduce the rate to 0.25%, the rate reduction ultimately applied was only 0.5 point, leaving the rate at 1.25%. An additional 2 billion euros was thus distributed to households. Conversely, in February 2012, given the return of higher inflation (even temporarily), the rate should have been lifted to 2.75%. The savings shortfall for households due to not changing the rate is estimated at 1 billion euros.

As with households’ choice between safety, liquidity and yields, the public trade-off between household purchasing power and the lending terms for social landlords can prove to be complicated. So while undervaluing the rate significantly benefits beneficiaries of the allocation of funds from Livret A (mainly social landlords) whose loan rates are “indexed” on the Livret A rate, it is disadvantageous for the saver.

While “small” savers are not very sensitive to changes in interest rates, “big” investors, that is to say, those approaching the deposit ceiling, can make rapid trade-offs out of Livret A. However, these 10% of the depositors, with the largest accounts, represent 51% of Livret A deposits. A massive reduction in rates could therefore lead to a significant outflow and subsequently substantially reduce the CDC’s capacity to lend to the social housing sector, a sector with ambitious building targets and mounting financing needs. On the contrary, it seems clear that maintaining higher rates during a period of low inflation would push up the cost of lending to social housing, at a time when the State and the housing agencies have committed to the construction of 120 000 social housing units per year between 2013 and 2015.


[1] For greater detail on the method of determining the interest rates, see Péléraux (2012).

[2] In January 2009, the total balance experienced a historic increase of 12.5%. For comparison, the successive increases in the ceiling in last October and January resulted in increases of 3.1% and 3.5%.

[3] In 2012, total lending of 9.7 billion euros was granted by the savings fund simply for financing the 105,000 social housing units.

[4] This objective corresponds to a campaign promise of the candidate Francois Hollande. It was recently downgraded: 120 000 housing financed per year until 2015 and 150,000 from 2016.

[5] For example, in 2012 Oséo and the FSI Strategic investment fund (Fonds stratégique d’investissement, FSI) received, respectively, 5.2 billion and 0.5 billion euros of resources from Livret A.

[6] The transfer was made ​​primarily to the LDD Sustainable development account (Livret de développement durable), whose outstandings grew by nearly 14 billion euros in October 2012 following the doubling of the ceiling.

[7] While the commission rate should converge by 2022 to 0.50% for all the distributing institutions, in 2011 it was 0.37% for new distributors and 0.53% for traditional distributors (CDC, 2012).


When Brazil’s youth dream of something besides football…

By Christine Rifflart

The rise in public transport prices had barely been in force for two weeks when this lit the fire of revolt and led to a new twist in the so-called “Brazilian development model”. With its aspirations for high-quality public services (education, health, transport, etc.), the new middle class that formed during the last decade is claiming its rights and reminding the government that the money put up to host major sports events (2014 World Cup, 2016 Olympics) should not be spent to the detriment of other priorities, especially when growth has ceased and budget constraints demand savings.

Over the years, Brazil’s growth accelerated from 2.5% per year in the 1980s and 1990s to almost 4% between 2001 and 2011. More importantly, for the first time the growth benefited a population that had traditionally been left out. Up to then, the slow growth of per capita income had gone hand in hand with rising inequality (the Gini coefficient for the period, at over 0.6, is one of the highest in the world) and an increase in poverty rates, which exceeded 40% during the 1980s. As hyperinflation was finally defeated by the 1994 “Plan Real”, growth resumed but remained fragile due to the series of external shocks that have hit the country (impact of the Asian crisis of 1997 and the Argentine crisis of 2001).

IMG1_Post-CR_English


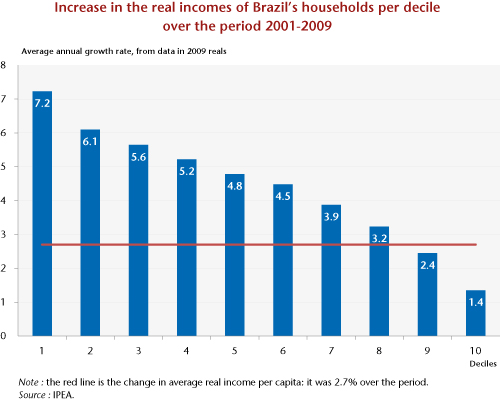
Lula’s accession to the presidency on 1 January 2003 marked a real turning point in this growth dynamic (Figure 1). While continuing the liberal orthodoxy of his predecessor F. H. Cardoso with respect to macro-economic policy and financial stability (unlike Argentina, for example), the new government took advantage of the renewed growth to better distribute the country’s wealth and to try to eradicate poverty. According to household surveys, real household income grew in local currency by 2.7% per year between 2001 and 2009, and the poverty rate fell by almost 15 percentage points to 21.4% of the population by the end of the period. In addition, the real income of the first eight deciles, especially the poorest 20% of the population, has increased much faster than the average income (Figure 2). Ultimately, 29 million Brazilians have joined the ranks of the new middle class, which now numbers 94.9 million (50.5% of the population), while the upper income class has welcomed 6.6 million additional Brazilians (and now represents 10.6% of the population). In contrast, the ranks of the poor decreased by 23 million, to 73.2 million in 2009. In terms of income, the new middle class now accounts for 46.2% of distributed income, more than the richest category, which saw its share decline to 44.1% [1].

IMG2_Post-CR_English

This new configuration of Brazilian society is changing consumption patterns and aspirations, particularly in terms of education, access to health care, infrastructure, etc. But while consumer spending has accelerated for 10 years (durables in particular) and stimulated private investment, the wind of democratization is posing a serious challenge to the government. For while the hike in public transport prices was quickly canceled, providing new infrastructure and improving the quality of public services in a country that is 15 times the size of France is not done in a day. In 2012, of 144 countries surveyed, the World Economic Forum (pp 116-117) ranked Brazil 107th for the quality of its infrastructure and 116th for the quality of its education system. The authorities must skillfully respond to the legitimate demands of the population, especially the youth [2].

The country has a solid basis for dealing with this and stimulating investment: a stable political and macroeconomic environment, sound public finances, external debt below 15% of GDP, abundant foreign exchange reserves, the confidence of the financial markets and direct foreign investors, and of course varied and abundant natural resources in agriculture (soybeans, coffee, etc.), mining (iron ore, coal, zinc, bauxite, etc.) and energy (hydroelectricity, oil).

But many difficulties lie ahead. Currently, growth is lacking, and it is even running up against problems with production capacity. In 2012, growth came to only 0.9% (insufficient to increase per capita income) and, even though investment is recovering, the forecasts for 2013 have been regularly revised downwards to around 3%. At the same time, inflation is picking up, driven by strong pressure on the labour market (at 5.5%, the unemployment rate is very low), and since 2008 productivity has stagnated. Inflation, which hit 6.5% in May, is at the top of the range allowed by the monetary authorities. To meet the target of 4.5%, which would mean a reduction of more or less 2 percentage points, in April the central bank raised its key rate from 7.25% to 8%. Monetary policy is nevertheless still very accommodative – the difference between the interest rate and the inflation rate has never been so small – and the moderate growth should lead to calming the inflationary pressures. In addition, the relative support monetary policy is giving to the economy is being offset by a policy of continuing fiscal consolidation. Following a primary surplus of 2.4% of GDP in 2012, the goal for this year is to maintain this at 2.3%. The net public sector debt is continuing to decline: from 60% ten years ago to 43% in 2008, reaching 35% last April.

The virtual stagnation in growth has been due in particular to a serious problem with competitiveness, which undercut the country’s growth potential. In a lackluster international economy, higher production costs and a seemingly overvalued currency have resulted in a drop in export performance, a reluctance to invest, and greater recourse to imports. The current account balance deteriorated by 1 GDP point in one year, reaching 3% in April.

To deal with this supply-side problem, Brazil’s central bank is intervening more and more to counter the adverse effects of capital inflows – attracted by high interest rates – on the exchange rate, while the government is seeking to boost investment. The investment rate, which has been under 20% of GDP over the last 20 years and close to 15% between 1996 and 2006, is structurally insufficient to lead the economy back onto a path of virtuous growth. For comparison, the investment rate over the past five years has been 44% in China, 38% in India and 24% in Russia. To lift Brazil’s investment rate towards a target of around 23%-25​​%, in 2007 the government introduced a “​​growth acceleration programme” (PAC), based on the implementation of major infrastructure projects.

In four years, public investment rose from 1.6% of GDP to 3.3%. The year 2011 saw the launch of the second phase of the PAC, which is slated to receive a budget of 1% of GDP per year for 4 years. There are also other investment programmes whose benefits, though disappointing in 2012, should still help resolve some of the problems. But the efforts being made are still insufficient. According to a 2010 study by Morgan Stanley [3], Brazil would need to invest 6 to 8% of its GDP in infrastructure every year for 20 years to catch up with the level of the infrastructure in South Korea, and 4% to catch that of Chile, the benchmark in the field in South America!

By improving the productive supply and by stimulating demand through increased public investment, the authorities’ objective is therefore to make up some of the delay built up from the past. But is it possible to carry out large-scale investment projects while simultaneously pursuing a policy of debt reduction when net public debt is close to 35% of GDP? The authorities should speed up the reform process to spur private investment, in particular by promoting the development of a national long-term savings programme (pension reform, etc.) while stimulating financial intermediation, which goes hand in hand with this.

The volume of loans granted by the financial sector to the non-financial sector represented only 54.7% of GDP in May. A little less than half of these are earmarked loans (rural credit, National Development Bank, etc.) at heavily subsidized interest rates (0.5% in real terms against 12% for non-subsidized loans to business, and 0.2% against 27.7% respectively for individuals). But the state must also reform a cumbersome and corrupt government.

Brazil has been an emerging country for over four decades. With an income of 11,500 dollars (PPP) per capita, it is time that this great country reaches adulthood by providing developed country quality standards for its public services and by refocusing its new development model on its new middle class, whose needs are still going unmet.


[1]See The Agenda of the New Middle Class | Portal FGV on the site of the Fondation Gétulio Vargas.

[2]http://www.oecd.org/eco/outlook/48930900.pdf

[3]See the study by Morgan Stanley Paving the way, 2010.


Roofs or ceilings?

by Philippe Weil

The bill to promote access to housing and urban renovation provides for regulating rents “mainly in urban areas where there is a strong imbalance between housing supply and demand and where rents have experienced the steepest increase in recent years”. Rents that exceed the median rent, set by neighbourhood and housing type, by more than 20% “will be targeted for a reduction”. The purpose of the cap is of course laudable, as it is “designed to combat the housing crisis, which for many years has been characterized by a sharp increase in prices, housing shortages and a decline in consumer purchasing power”. The road to hell is, alas, paved with good intentions, as today’s ceilings often destroy tomorrow’s roofs:

  • “Rent ceilings […] cause haphazard and arbitrary allocation of space, inefficient use of space, retardation of new construction and indefinite continuance  of rent ceilings, or subsidization of new construction and a future depression in residential building. Formal rationing by public authority  would probably make matters still worse.”

Opposing rent ceilings does not mean, however, resolving the inequalities that arise with respect to housing:

  • “The fact  that, under free market conditions, better quarters go to those who have  larger incomes or more wealth is, if anything, simply a reason for taking long-term measures to reduce the inequality of income and wealth. For  those, like us, who would like even more equality than there is at  present, not alone for housing but for all products, it is surely better  to attack directly existing inequalities in income and wealth at their  source than to ration each of the hundreds of commodities and services  that compose our standard of living. It is the height of folly to permit individuals to receive unequal money incomes and then to take elaborate  and costly measures to prevent them from using their incomes.”

The authors of these two quotes, which enjoin us to allow the free market system to allocate the available housing to tenants and which advocate attacking inequality of income and wealth directly at the source, are none other than Milton Friedman and George Stigler – the two founders of the Chicago School. The title of this post is borrowed – I hope they forgive me – from their 1946 article “Roofs or Ceilings: the Current Housing Problem” [1].

The Duflot bill envisages a rent control mechanism that is far more sophisticated than the one denounced by Friedman and Stigler nearly seventy years ago. Its impact on the French real estate market can of course be evaluated in a few years, but the recent economic literature warns that so-called “second generation” rent control mechanisms often have ambiguous effects [2] – not always negative but not necessarily positive [3]. In these circumstances, it is regrettable that a preliminary experiment of the sort that prudence demands is not being considered for some randomly selected cities. While political urgency undoubtedly argues against delay, nevertheless in economics as in medicine it is crucial to ensure that efforts to cure the patient do not wind up killing him.

To conclude, the warning of Friedman and Stigler still holds: inequalities in income and wealth need to be attacked directly at the source, and not later down the line.

______________________________________

[1] Foundation for Economic Education, Irvington-on-Hudson, NY.

[2] Cf., for example, The Economics and Law of Rent Control, by Kaushik Basu and Patrick Emerson, World Bank, 1998.

[3] Please see Le Bayon, Madec and Rifflart (2013) [ in French] for an evaluation of the regulation of the French rental market.


Vertical networks or clusters: what tool for industrial policy?

By Jean-Luc Gaffard

The concept of a “vertical network” [filière] is back in the spotlight and is playing the role of an instrument of the new industrial policy. A working document of the Fabrique de l’Industrie [Manufacturing Industry], ‘What use are ‘vertical networks’?” (Bidet-Mayer and Tubal, 2013) recognizes that the concept has the virtue of helping to identify good practices and develop their application in relationships between businesses and between business and government. However, the same paper concludes by questioning the merits of a concept that emphasizes an approach to industrial organization that is more technical than entrepreneurial.

Our purpose here is to explore this issue and to challenge the relevance of the “vertical network” concept and to advocate instead the notion of a “cluster”, which seems to correspond better to the need – for industrial policy – to recognize the leading role of the company in making strategic decisions.

The “vertical network”: a simplistic notion

In its old but strict sense, a “vertical network” consists of all or part of the successive stages of production, ranging from raw materials to the final product. This chain of products extends from upstream to downstream and is composed of technical relationships, which are identifiable based on technical coefficients of production. These are subsets of input-output tables that are characterized by the existence of a high level of spill-over or dominance effects that stem from the fact that the concentration of relationships is denser in some industries than in others (Mougeot, Auray and Duru, 1977).

Defined like this, a “vertical network” obviously says nothing about industrial organization per se, that is to say, about how firms set the boundaries for their activities. The companies concerned may choose to integrate the different stages in a vertical network or on the contrary focus on one stage and build pure market relations both upstream and downstream. They can also choose to form a relationship that could be described as a hybrid, based on medium-term contractual relationships both upstream and downstream.

The organizational decision takes place in a specific technical context, based on a comparison between the costs of operating through the market, through contracts or through internal transactions (Coase, 1937; Williamson, 1975). The technical features are covered over by the transaction costs and have limited relevance. The specific characteristics of the assets, which have a technical dimension, are taken into account in making the choice, but primarily because of the possibility for opportunistic behaviour (hostage-taking) that it permits.

The designation of a thusly defined “vertical network” as a tool of industrial policy, based on a certain stability of technical relations, creates an obstacle to innovation, whose major characteristic is to upset linkages within the vertical network and thus its very structure. In fact, the use of the “vertical network” concept really holds interest only for a short-term perspective, when it comes to measuring the impact of the transmission of cyclical fluctuations within a technically stable, productive structure (Mougeot, Auray and Duru, 1977).

The industrial policy measures that flow from this may affect how companies define the scope of their activities by affecting transaction costs. One example is the rules governing the relationships between contractors and subcontractors. But their effects are somewhat unclear with respect to the expected impact on the innovative capacity of the firms concerned.

The simplicity of the concept of a vertical network, together with its limitations, make the way that the concept is used (1) dangerous, if the fixed nature of the technique is taken literally (as has been the case in the past), and (2) ambiguous, if it is understood as dealing with the technical and organizational changes inherent in a market economy. As evidence of this ambiguity, consider a list of “vertical networks” today, which refer to objects such as cars, trains and planes; to luxury items whose most common feature is that they are aimed at a very rich clientele; to generic technologies such as information and communication technology; and to social issues such as health care and the ecological transition, not to mention the mishmash constituted by the consumer goods industry.

While the notion of a vertical network, that is to say, a group of industries that are technically related, has to some extent fallen into disuse since the 1980s, it is precisely because strategic business decisions are far from being dominated by technology, and a frozen state of technology in particular. The structuring of the industrial fabric is constantly changing as a result of the choices and constraints that determine them. In other words, industries are more the result of processes of innovation than of technical frameworks that supposedly control strategic choices.

It is not surprising, then, that industrial policy in the narrow sense of direct aid to companies in specific sectors has itself fallen into disuse and made room for policies on competition and regulation that are designed as efforts to move closer to a state of full competition.

The company: the essential reference

This observation does not mean that intra- and inter-vertical network relations do not matter and that all that counts are market incentives. Companies are not islands of planned coordination in a sea of ??market relations. They come to agreements about technology, distribution and marketing and develop subcontracting relationships and create joint ventures (Richardson, 1972). There is a major reason for this. To invest, a company has a need for coordination that cannot be met simply by the competitive market, but rather involves the emergence of forms of cooperation that reflect membership in a particular group. This company is characterized by its mobility, which leads it to introduce new products or even to change vertical network, thereby upsetting the relationships it has formed with others, but always along a trajectory that is determined by its core competencies.

Generally speaking, companies interact and have to solve difficulties in coordination arising from a lack of information. This is not so much a lack of technical information as a lack of information about market conditions, meaning the configuration of demand but also of competing and complementary suppliers (Richardson, 1960).

In fact, companies face two deadlines: a deadline for the gestation of irreversible investments, including investments in intangibles, and a deadline for acquiring market information. To deal with this and decide how to invest effectively, companies need to have a certain degree of confidence about the levels of competing investments and of complementary investments. The coordination required is not assured solely by market signals or, more precisely, by price signals alone. This also demands that cooperative relationships between companies complement their competitive relations (Richardson, 1960). These relationships constitute business networks for which the qualification of a “vertical network” is undoubtedly too narrow, even if technical proximities or complementarities do play a role. Belonging to a group characterized by having broadly similar skills or qualifications, rather than to a vertical network or business sector, is related to these relationships which secure the investments of each group member.

Companies seeking to innovate do not mainly face the existence of entry barriers (due to the price or investment behaviour of the established companies) or barriers to business creation. They have to deal in particular with the existence of barriers to growth that are related to their ability to be mobile (Caves and Porter, 1977). It is obviously difficult for companies to enter new business fields or to increase their size significantly. They are successful in attaining new size thresholds whenever they can acquire new managerial capabilities and ensure control of their capital. They enter into a new activity, possibly one that is quite different from their current activity in terms of the markets served, only so long as the technical and managerial skills in one business are useful in the other. Thus business groups come into being that are organized around similar or complementary skills, which transcend divisions into industries or sectors. These groups are the arenas where competition is carried out. Their very nature limits, or even thwarts, the development of an oligopolistic consensus. Because of their structural similarities, each group member responds in the same way to internal and external disturbances and anticipates the reactions of the others with a good deal of accuracy (Caves and Porter, 1977). A sort of coordination and mutual dependence thus develops within each group.

Based on this dual observation of the need for both coordination and mobility, it is clear that an industrial fabric is complex and can only with difficulty be reduced to “vertical networks” in the original meaning. Industrial policy is thereby inevitably affected, as it cannot be reduced to direct aid to firms, sectors or even technologies, nor to the application of rules on supposedly perfect competition.

Clusters: a suitable response

The nature of the productive system requires a horizontal industrial policy, which involves in particular subsidizing R&D and occupational training, but which makes sense only if this type of aid is conditional on the achievement of the objective of business mobility and of vertical as well as horizontal cooperation between companies.

It is with regard to this objective that the creation and development of clusters should be preferred, this being understood to mean groups or networks of companies and institutional structures that, while certainly having a geographical dimension, cannot necessarily be reduced to a strictly defined territory. A cluster is primarily a tool that aims to develop both voluntary cooperation between companies and a network of expertise. Its configuration is determined by the companies. The capacity building that arises from this organizational network nourishes a capillary type of action and the progressive entry of the individual members into new fields of activity.

Logically speaking, the initiative for these clusters should come from the companies themselves, with the government’s role being to encourage them, specifically by making its aid contingent on the reality of the cooperation achieved. Ensuring that there is genuine cooperation requires that public funding be conditional on the contribution of private funds. The method of governance must recognize the pre-eminent role of the firms in the industry. It is this feature that has underpinned the success of German industry – it is, to say the least, risky to chalk this success up to competitiveness gains generated by labour market reform (Duval, 2013).

In this light, there should be nothing surprising about the successes and failures of industrial policy. When these configurations have the characteristics of clusters in the sense used here, whether this involves aerospace, automotive or railway, the mechanisms implemented have allowed for credible projects that have promoted competitiveness. When the supposed industries are loosely or not at all structured and bear no relationship to clusters, the failures are obvious, because there are no eligible projects under existing public procedures and in particular because of the weak involvement of small and medium-sized enterprises in collaborative projects.

The fact that the vertical networks adopted cover almost every industry forbids, moreover, any real discrimination between the forms of industrial organization. There is thus a very real risk that public funds will be wasted. Some groups, who are accustomed to dealing with the government, will capture aid for projects that they would have carried out anyway, while at the same time companies that are engaged in innovative activities will not win any support, due to failing to fit the pre-defined framework.

Once again on the question of company size

There is a functional relationship between organizational efficiency and the growth rate, with the first falling when the second rises beyond a certain threshold (Richardson, 1964). The exploitation of new investment opportunities normally goes to companies that have the most suitable production experience, business contacts and marketing skills. These capabilities are a matter of degree. The degree of organizational constraint will depend not only on the growth rate but also on the direction in which the expansion takes place. This will also depend on the extent to which the company concerned can acquire the skills, including managerial, required to be mobile without incurring excessive costs (Richardson, 1964). A cluster type organization will be able to help.

The cluster is a place for exchanges and skills transfers that facilitate the entry of firms into new fields of activity, even if only geographical, which should enable the smaller ones to grow in size. The cluster organization can also promote mechanisms that facilitate the access by small firms to the financing required for investment, while at the same time allowing them to retain control of their capital, and thus their identity.

By way of a conclusion

As is clear, industrial policy should not amount to planning based on a purely technical approach to industrial organization, the kind captured in the “vertical network” concept, which would make it hostage to local and national lobbies. Nor should it be reduced to regulatory and competition policies designed for a virtual world where the only relations among companies are market relations. It must be understood as a way to stimulate the creation and development of clusters designed as operational networks of expertise, whose governance must be ensured under conditions that favour entrepreneurial decisions, and not bureaucratic ones.


Bibliography

Bidet-Mayer, T. and L. Toubal (2013): “A quoi servent les filières?” [What’s the use of “industries”], Working document, La Fabrique de l’Industrie.

http://www.la-fabrique.fr/Chantier/a-quoi-servent-les-filieres-document-de-travail

Duval, G. (2013): Made in Germany: le modèle allemand au delà du mythe, Paris: Le Seuil.

Mougeot M., Auray J.-P. and G. Duru (1977): La structure productive française, Paris: Economica.

Richardson, G.B. (1960): Information and Investment, Oxford: Clarendon Press (Reed. 1990).

Williamson, 0. (1975): Markets and Hierarchies, Analysis and Anti-Trust Implications, New York: Free Press.


Croatia in the European Union: an entry without fanfare

By Céline Antonin and Sandrine Levasseur

On 1 July 2013, ten years after filing its application to join the European Union, Croatia will officially become the 28th member state of the EU and the second member country from former Yugoslavia. Given the country’s size (0.33% of the GDP of the EU-28) and the political consensus on its membership, Croatia’s accession should pass relatively unnoticed. However, there are challenges posed by its entry. Indeed, at a time when the European Union is going through the worst crisis in its history, legitimate questions can be raised about whether Croatia is joining prematurely, particularly as it is experiencing its fifth successive year of recession. The latest OFCE Note (no. 27, 26 June 2013) reviews two of the country’s main weaknesses: first, a lack of competitiveness, and second, a level of corruption that is still far too high to guarantee steady and sustainable growth.

With 4.3 million inhabitants, Croatia initially experienced a period of strong economic growth up to 2008, based on the strength of its tourist industry and on consumption that was largely underpinned by lending from foreign capital. The crisis revealed, yet again, the limitations of this development model and highlighted the country’s structural weaknesses: a high level of dependence on foreign capital, the vulnerability of a system of (quasi) fixed exchange rates, an unfavourable environment for investment and wide-scale tax evasion.

Even though negotiations thankfully addressed some of these problems, others are still unresolved. For instance, with respect to the economy, the domestic market is still not open enough to competition, with the result that the country suffers from a lack of competitiveness. At the legal level, the progress made in the fight against corruption, tax evasion and the underground economy has been woefully inadequate, depriving the country of the foundations for robust growth. Following on the heels of Romania and Bulgaria, the entry of Croatia may unfortunately endorse the idea that curbing corruption is not a prerequisite for joining the EU. In view of the repeated institutional crises that have hit the European Union since 2009 and widespread Euroscepticism, it is now urgent for the EU to makes its priority deepening rather than widening.