Has the 35-hour work week really “weighed down” the French economy?

By Eric Heyer

Did the Aubry laws introducing the 35-hour work week in France between 1998 and 2002 really make French business less competitive and lead to job losses, as is suggested in the latest report from the OECD? Has France seen its economic performance decline post-reform relative to its European partners? Have the public finances been “weighed down” by these laws?

A review of our recent macroeconomic history, coupled with international comparisons, provides some answers to these questions.

Record macroeconomic performances in the private sector between 1998 and 2002…

Leaving aside an analysis of the recent Great Recession, over the past 30 years private sector activity in France grew by an annual average of 2.1%. Since the establishment of the 35‑hour work week, far from collapsing, economic growth in this sector instead accelerated sharply, from 1.8% before 1997 to 2.6% afterwards, and even hit a peak during the period in which the 35-hour week was being established (an annual average of 2.9%, Table 1). Furthermore, it is noteworthy that of the five best years recorded by the French market sector over the past 30 years, three were in the period 1998-2002 based on the criterion of GDP growth, and four if the criterion used is job creation.

The global economic environment accounts for some of this good performance, but only in part: foreign demand for French output was certainly more dynamic after 1997 than before, but this acceleration continued after 2002, and cannot therefore explain the better performances recorded between 1998 and 2002 (Table 1).

tab1_blogang_0212


… and better than the performance of our European partners

Since the establishment of the 35-hour work week, France’s performance has been superior to that of the rest of the euro zone, especially in comparison with our two main partners, Germany and Italy. For instance, over the decade 1998-2007 France’s average annual growth was 1 point higher than for Italy and 0.8 point than for Germany (Table 2).

During this period, French companies and households spent more than their German and Italian counterparts. Business investment, which rose at an annual average of 0.8%, was more dynamic in France than in Germany (0.3%) or Italy (0.5%). As for households, consumption grew by an annual average of 1.4% in France against, respectively, 0.4% in Germany and 0.9% in Italy. Furthermore, it should be noted that the continued higher consumption in France does not reflect the behaviour of household savings. The savings rate was not only higher than elsewhere in Europe, but it has also risen since 1998. The solid performance of French consumption is the consequence of greater dynamism in job creation in France during this period, especially when compared to what was taking place in Germany (Table 2).

tab2_20212postEHang


Unit labour costs [1] under control

Considering the large countries, France has cut hourly unit labour costs in the manufacturing sector the most during the period 1997-2002 (Figure 1). With respect to labour costs for the economy as a whole, only Germany has done better than France over this period.

graph1_blog_0212EHang

The implementation of the Aubry laws has not therefore led to reducing the competitiveness of the French economy. The reasons why are now well known: the way the increase in hourly wages linked to the 35-hour week was offset by wage moderation; the more flexible organization of working time, which helped to boost the hourly productivity of labour (Table 1); the suppression of overtime pay; and finally State aid in the form of lower social contributions.

Between 1997 and 2002 , by better controlling wage costs than most European and Anglo-American countries, France improved its price competitiveness and thereby its market share of world trade (Figure 2). The share of French exports in world trade, which was helped by the weakness of the euro and by wage moderation, reached a peak in 2001.

Since 2002, France’s market share has declined considerably, for two basic reasons: first, the loss of price competitiveness of French exports subsequent to the appreciation of the nominal effective exchange rate in France, comparable to that observed in the early 1990s, and second, Germany’s commitment to a policy of drastically reducing production costs. Since 2002, Germany has engaged in a process of improving its supply by restricting income and social transfers ( Hartz reforms , social VAT), which led to lower unit labour costs in absolute terms but also relative to its other European partners, including France. It is this policy that accounts for the 30% loss in market share experienced by France in the period 2002-2007.

graph2_blog_0212EHang

The loss in market share is thus not peculiar to France. The policy being implemented in Germany has enabled it to gain market share in countries that are geographically and structurally close to it, i.e. the large European countries. In this respect, France is not the only country to have suffered from this strategy, as Italy too has lost market share during this period[2].

In total, since the introduction of the 35-hour week, Italy has lost even more market share than the French economy (-27% for Italy against -20% for France).

A limited cost for the public purse

Since the implementation of the Aubry laws, the relief on charges on low wages has cost general government an annual average of nearly 22 billion euros. But this amount is not attributable solely to the Aubry laws, since even before that such measures had been established by the Balladur and Juppé governments in the early and mid 1990s. The additional relief generated by the Aubry laws, which was made more long term by the “Fillon” measures, comes to nearly 12.5 billion euros per year. But this amount does not represent the cost actually incurred by general government. Indeed, as the Aubry laws have created jobs (350,000 over the period 1997-2002 according to official figures ​​by the DARES and used by the INSEE), the cost for the public purse has been smaller: this job creation generates four billion euros in additional payroll taxes; this has reduced the number of unemployed, and thus unemployment benefits by 1.8 billion euros; and finally this has boosted household income, and the consequent consumption is generating additional tax revenues (VAT, income tax, etc.) in the amount of 3.7 billion euros. In sum, once the macroeconomic feedback is taken into account, the additional cost of these reductions comes to 3 billion euros annually, or 0.15 percentage point of GDP.

A review of our macroeconomic history does not therefore corroborate the thesis that the 35-hour week has “weighed down” the French economy: business growth and job creation were higher during the period from 1997 to 2007 than in the rest of the euro zone, and the competitiveness of the French economy, as measured by unit labour costs, fell by less than in the rest of the euro zone, with the exception of Germany. In this regard, it appears that the strategy conducted in Germany from 2002 (Hartz reform and social VAT) better explains the losses in market share by both the French economy and our other European partners. It is rather in the public sector, including hospitals, that the 35-hour work week has proven ineffective.

____________________________________________________________________________________________

 The different measures relaxing the 35-hour week

I –The Fillon law of 2003

The Law of 17 January 2003 has two main provisions:

          (1)    Regulation of overtime

By increasing the overtime quota from 130 to 180 hours, this law permits companies to use overtime structurally. Allowing for an additional 4 hours per week throughout the year enables companies to stay on a 39-hour week if they so wish. Specific industries also have the right to negotiate a higher amount. The Decree of 9 December 2004 brought the regulatory overtime quota to 220 hours per year.

The Law also reduces the cost of overtime. For companies with 20 employees or fewer, overtime begins only with the 37th hour, and the rate of extra pay is only 10%. For other firms, this may be negotiated between 10% and 25% by an industry agreement.

          (2) Measure easing social contributions

The provisions for the reduction of employer social contributions introduced by the Aubry laws were henceforth disconnected from the length of the work week. All companies, whether or not they had shifted to the 35-hour week, now benefited. Structural aid beyond 1.6 times the minimum wage (SMIC) was eliminated.

II – The tax exemption of overtime hours in 2007

This measure had several provisions:

           (1) Lump-sum reduction in payroll taxes

This measure introduced a lump-sum reduction in payroll taxes of 1.5 euros per hour of overtime worked by companies with fewer than 20 employees and 0.50 euros in enterprises with more than 20 employees.

          (2) Alignment of extra pay for overtime

This measure provided that extra pay for overtime be aligned at the minimum rate of 25% for all companies.

          (3) Exemption from income tax

This measure allowed employees to exempt their pay for overtime hours from income tax, up to a limit of 25% extra.

          (4) Exemption from social contributions

This measure also included a reduction of payroll taxes equal to the amount of the CSG / CRDS tax as well as all legal and contractual contributions.

______________________________________________________________________________

For more information:

Philippe Askenazy, Catherine Bloch-London and Muriel Roger, 2004, “La réduction du temps de travail 1997-2003: dynamique de construction des lois ‘Aubry’ et premières evaluations” [The reduction of the work week 1997-2003: dynamics of the development of the Aubry laws and initial evaluations], Economie et Statistiques, no. 376-377.

Chen R., GM. Milesi-Ferreti and T. Tressel, 2013, “Eurozone external imbalances”, Economic Policy, 28 (73), pp. 102-142.

DARES, 2003, Les politiques de l’emploi et du marché du travail, Collection Repères, Editions La Découverte.

Guillaume Duval, 2008, Sommes-nous des paresseux? et 30 autres questions sur la France et les Français, Editions du Seuil.

Alain Gubian, Stéphane Jugnot, Frédéric Lerais and Vladimir Passeron, 2004, “Les effets de la RTT sur l’emploi: des simulations ex-ante aux évaluations ex-post” [Impact of the shorter work week on employment: from ex-ante simulations to ex-post evaluations], Economie et Statistiques, n° 376-377.

Éric Heyer and Xavier Timbeau, 2000, “35 heures : réduction réduite” [35 hours: the reduction reduced], Revue de l’OFCE, no. 74, July.


[1] The unit labour cost is the ratio of the hourly cost of labour to the hourly productivity of the work.

[2] Other factors may of course explain Germany’s better performance, such as the emergence of China. For a recent version of this idea, see Chen R., G.M. Milesi-Ferreti and T. Tressel (2013).


Austerity in Europe: a change of course?

By Marion Cochard and Danielle Schweisguth

On 29 May, the European Commission sent the members of the European Union its new economic policy recommendations. In these recommendations, the Commission calls for postponing the date for achieving the public deficit goals of four euro zone countries (Spain, France, Netherlands and Portugal), leaving them more time to hit the 3% target. Italy is no longer in the excessive deficit procedure. Only Belgium is called on to intensify its efforts. Should this new roadmap be interpreted as a shift towards an easing of austerity policy in Europe? Can we expect a return to growth in the Old Continent?

These are not trivial matters. An OFCE Note (no. 29, 18 July 2013) attempts to answer this by simulating three scenarios for fiscal policy using the iAGS model. It appears from this study that postponing the public deficit targets in the four euro zone countries does not reflect a real change of course for Europe’s fiscal policy. The worst-case scenario, in which Spain and Portugal would have been subject to the same recipes as Greece, was, it is true, avoided. The Commission is implicitly agreeing to allow the automatic stabilizers to work when conditions deteriorate. However, for many countries, the recommendations with respect to budgetary efforts still go beyond what is required by the Treaties (an annual reduction in the structural deficit of 0.5 percent of GDP), with as a consequence an increase of 0.3 point in the unemployment rate in the euro zone between 2012 and 2017.

We believe, however, that a third way is possible. This would involve adopting a “fiscally serious” position in 2014 that does not call into question the sustainability of the public debt. The strategy would be to maintain a constant tax burden and to allow public spending to keep pace with potential growth. This amounts to maintaining a neutral fiscal stimulus between 2014 and 2017. In this scenario, the public deficit of the euro zone would improve by 2.4 GDP points between 2012 and 2017 and the trajectory in the public debt would be reversed starting in 2014. By 2030, the public deficit would be in surplus (0.7%) and debt would be close to 60% of GDP. Above all, this scenario would lower the unemployment rate significantly by 2017. The European countries could perhaps learn from the wisdom of Jean de La Fontaine’s fable of the tortoise and the hare: “Rien ne sert de courir, il faut partir à point“, i.e. Slow and steady wins the race.


France: why such zeal?

By Marion Cochard and Danielle Schweisguth

On 29 May, the European Commission sent the members of the European Union its new economic policy recommendations. As part of this, the Commission granted France an additional two years to reach the deficit reduction target of 3%. This target is now set for 2015, and to achieve this the European Commission is calling for fiscal impulses of -1.3 GDP points in 2013 and -0.8 point in 2014 (see “Austerity in Europe: a change of course?”). This would ease the structural effort needed, since the implementation of the previous commitments would have required impulses of -2.1 and -1.3 GDP points for 2013 and 2014, respectively.

Despite this, the French government has chosen not to relax its austerity policy and is keeping in place all the measures announced in the draft Finance Act (PLF) of autumn 2012. The continuing austerity measures go well beyond the Commission’s recommendations: a negative fiscal impulse of -1.8 GDP point, including a 1.4 percentage point increase in the tax burden for the year 2013 alone. Worse, the broad guidelines for the 2014 budget presented by the government to Parliament on 2 July 2013 point to a structural effort of 20 billion euros for 2014, i.e. one percentage point of GDP, whereas the Commission required only 0.8 point. The government is thus demanding an additional 0.6 GDP point fiscal cut, which it had already set out in the multi-year spending program in the 2013 Finance Act.

The table below helps to provide an overview of the effort and of its impact on the French economy. It shows the trends in growth, in unemployment and in the government deficit in 2013 and 2014, according to three budget strategies:

  1. One using the relaxation recommended by the Commission in May 2013;
  2. One based on the budget approved by the government for 2013 and, a priori, for 2014;
  3. One based on an alternative scenario that takes into account the negative 1.8 GDP point fiscal impulse for 2013 and calculates a fiscal impulse for 2014 that would be sufficient to meet the European Commission’s public deficit target of -3.6%.

MC_DS_Tab_Blog29-07English (2)

According to our estimates using the iAGS model [1], the public deficit would be cut to 3.1% of GDP in 2014 in scenario (2), whereas the Commission requires only 3.6%. As a consequence of this excess of zeal, the cumulative growth for 2013 and 2014 if the approved budget is applied would be 0.7 percentage point lower than growth in the other two scenarios (0.8 point against 1.5 points). The corollary is an increase in unemployment in 2013 and 2014: the unemployment rate, around 9.9% in 2012, would thus rise to 11.1% in 2014, an increase of more than 350,000 unemployed for the period. In contrast, the more relaxed scenario from the European Commission would see a quasi-stabilization of unemployment in 2013, while the alternative scenario would make it possible to reverse the trend in unemployment in 2014.

While the failure of austerity policy in recent years seems to be gradually impinging on the position of the European Commission, the French government is persisting along its same old path. In the face of the social emergency that the country is facing and the paradigm shift that seems to be taking hold in most international institutions, the French government is choosing to stick to its 3% fetish.


[1] iAGS stands for the Independent Annual Growth Survey. This is a simplified model of the eleven main economies in the euro zone (Austria, Belgium, Finland, France, Germany, Greece, Ireland, Italy, Netherlands, Portugal and Spain). For more detail, see the working document Model for euro area medium term projections.


When Brazil’s youth dream of something besides football…

By Christine Rifflart

The rise in public transport prices had barely been in force for two weeks when this lit the fire of revolt and led to a new twist in the so-called “Brazilian development model”. With its aspirations for high-quality public services (education, health, transport, etc.), the new middle class that formed during the last decade is claiming its rights and reminding the government that the money put up to host major sports events (2014 World Cup, 2016 Olympics) should not be spent to the detriment of other priorities, especially when growth has ceased and budget constraints demand savings.

Over the years, Brazil’s growth accelerated from 2.5% per year in the 1980s and 1990s to almost 4% between 2001 and 2011. More importantly, for the first time the growth benefited a population that had traditionally been left out. Up to then, the slow growth of per capita income had gone hand in hand with rising inequality (the Gini coefficient for the period, at over 0.6, is one of the highest in the world) and an increase in poverty rates, which exceeded 40% during the 1980s. As hyperinflation was finally defeated by the 1994 “Plan Real”, growth resumed but remained fragile due to the series of external shocks that have hit the country (impact of the Asian crisis of 1997 and the Argentine crisis of 2001).

IMG1_Post-CR_English


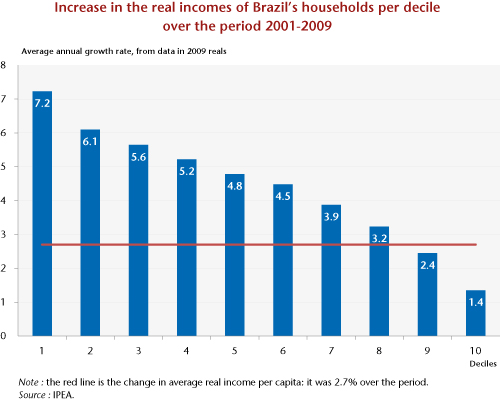
Lula’s accession to the presidency on 1 January 2003 marked a real turning point in this growth dynamic (Figure 1). While continuing the liberal orthodoxy of his predecessor F. H. Cardoso with respect to macro-economic policy and financial stability (unlike Argentina, for example), the new government took advantage of the renewed growth to better distribute the country’s wealth and to try to eradicate poverty. According to household surveys, real household income grew in local currency by 2.7% per year between 2001 and 2009, and the poverty rate fell by almost 15 percentage points to 21.4% of the population by the end of the period. In addition, the real income of the first eight deciles, especially the poorest 20% of the population, has increased much faster than the average income (Figure 2). Ultimately, 29 million Brazilians have joined the ranks of the new middle class, which now numbers 94.9 million (50.5% of the population), while the upper income class has welcomed 6.6 million additional Brazilians (and now represents 10.6% of the population). In contrast, the ranks of the poor decreased by 23 million, to 73.2 million in 2009. In terms of income, the new middle class now accounts for 46.2% of distributed income, more than the richest category, which saw its share decline to 44.1% [1].

IMG2_Post-CR_English

This new configuration of Brazilian society is changing consumption patterns and aspirations, particularly in terms of education, access to health care, infrastructure, etc. But while consumer spending has accelerated for 10 years (durables in particular) and stimulated private investment, the wind of democratization is posing a serious challenge to the government. For while the hike in public transport prices was quickly canceled, providing new infrastructure and improving the quality of public services in a country that is 15 times the size of France is not done in a day. In 2012, of 144 countries surveyed, the World Economic Forum (pp 116-117) ranked Brazil 107th for the quality of its infrastructure and 116th for the quality of its education system. The authorities must skillfully respond to the legitimate demands of the population, especially the youth [2].

The country has a solid basis for dealing with this and stimulating investment: a stable political and macroeconomic environment, sound public finances, external debt below 15% of GDP, abundant foreign exchange reserves, the confidence of the financial markets and direct foreign investors, and of course varied and abundant natural resources in agriculture (soybeans, coffee, etc.), mining (iron ore, coal, zinc, bauxite, etc.) and energy (hydroelectricity, oil).

But many difficulties lie ahead. Currently, growth is lacking, and it is even running up against problems with production capacity. In 2012, growth came to only 0.9% (insufficient to increase per capita income) and, even though investment is recovering, the forecasts for 2013 have been regularly revised downwards to around 3%. At the same time, inflation is picking up, driven by strong pressure on the labour market (at 5.5%, the unemployment rate is very low), and since 2008 productivity has stagnated. Inflation, which hit 6.5% in May, is at the top of the range allowed by the monetary authorities. To meet the target of 4.5%, which would mean a reduction of more or less 2 percentage points, in April the central bank raised its key rate from 7.25% to 8%. Monetary policy is nevertheless still very accommodative – the difference between the interest rate and the inflation rate has never been so small – and the moderate growth should lead to calming the inflationary pressures. In addition, the relative support monetary policy is giving to the economy is being offset by a policy of continuing fiscal consolidation. Following a primary surplus of 2.4% of GDP in 2012, the goal for this year is to maintain this at 2.3%. The net public sector debt is continuing to decline: from 60% ten years ago to 43% in 2008, reaching 35% last April.

The virtual stagnation in growth has been due in particular to a serious problem with competitiveness, which undercut the country’s growth potential. In a lackluster international economy, higher production costs and a seemingly overvalued currency have resulted in a drop in export performance, a reluctance to invest, and greater recourse to imports. The current account balance deteriorated by 1 GDP point in one year, reaching 3% in April.

To deal with this supply-side problem, Brazil’s central bank is intervening more and more to counter the adverse effects of capital inflows – attracted by high interest rates – on the exchange rate, while the government is seeking to boost investment. The investment rate, which has been under 20% of GDP over the last 20 years and close to 15% between 1996 and 2006, is structurally insufficient to lead the economy back onto a path of virtuous growth. For comparison, the investment rate over the past five years has been 44% in China, 38% in India and 24% in Russia. To lift Brazil’s investment rate towards a target of around 23%-25​​%, in 2007 the government introduced a “​​growth acceleration programme” (PAC), based on the implementation of major infrastructure projects.

In four years, public investment rose from 1.6% of GDP to 3.3%. The year 2011 saw the launch of the second phase of the PAC, which is slated to receive a budget of 1% of GDP per year for 4 years. There are also other investment programmes whose benefits, though disappointing in 2012, should still help resolve some of the problems. But the efforts being made are still insufficient. According to a 2010 study by Morgan Stanley [3], Brazil would need to invest 6 to 8% of its GDP in infrastructure every year for 20 years to catch up with the level of the infrastructure in South Korea, and 4% to catch that of Chile, the benchmark in the field in South America!

By improving the productive supply and by stimulating demand through increased public investment, the authorities’ objective is therefore to make up some of the delay built up from the past. But is it possible to carry out large-scale investment projects while simultaneously pursuing a policy of debt reduction when net public debt is close to 35% of GDP? The authorities should speed up the reform process to spur private investment, in particular by promoting the development of a national long-term savings programme (pension reform, etc.) while stimulating financial intermediation, which goes hand in hand with this.

The volume of loans granted by the financial sector to the non-financial sector represented only 54.7% of GDP in May. A little less than half of these are earmarked loans (rural credit, National Development Bank, etc.) at heavily subsidized interest rates (0.5% in real terms against 12% for non-subsidized loans to business, and 0.2% against 27.7% respectively for individuals). But the state must also reform a cumbersome and corrupt government.

Brazil has been an emerging country for over four decades. With an income of 11,500 dollars (PPP) per capita, it is time that this great country reaches adulthood by providing developed country quality standards for its public services and by refocusing its new development model on its new middle class, whose needs are still going unmet.


[1]See The Agenda of the New Middle Class | Portal FGV on the site of the Fondation Gétulio Vargas.

[2]http://www.oecd.org/eco/outlook/48930900.pdf

[3]See the study by Morgan Stanley Paving the way, 2010.


Competitiveness: danger zone!

By Céline Antonin, Christophe Blot, Sabine Le Bayon and Catherine Mathieu

The crisis affecting the euro zone is the result of macroeconomic and financial imbalances that developed during the 2000s. The European economies that have provoked doubt about the sustainability of their public finances (Spain, Portugal, Greece and Italy [1]) are those that ran up the highest current account deficits before the crisis and that saw sharp deteriorations in competitiveness between 2000 and 2007. Over that same period Germany gained competitiveness and built up growing surpluses, to such an extent that it has become a model to be emulated across the euro zone, and especially in the countries of southern Europe. Unit labor costs actually fell in Germany starting in 2003, at a time when moderate wage agreements were being agreed between trade unions and employers and the coalition government led by Gerhard Schröder was implementing a comprehensive programme of structural reform. This programme was designed to make the labour market [2] more flexible and reform the financing of social protection but also to restore competitiveness. The concept of competitiveness is nevertheless complex and reflects a number of factors (integration into the international division of production processes, development of a manufacturing network that boosts network effects and innovation, etc.), which also play an important role.

In addition, as is highlighted in a recent analysis by Eric Heyer, Germany’s structural reforms were accompanied by a broadly expansionary fiscal policy. Today, the incentive to improve competitiveness, strengthened by the implementation of improved monitoring of macroeconomic imbalances (see here), is part of a context marked by continued fiscal adjustment and high levels of unemployment. In these conditions, the implementation of structural reforms coupled with a hunt for gains in competitiveness could plunge the entire euro zone into a deflationary situation. In fact, Spain and Greece have already been experiencing deflation, and it is threatening other southern Europe countries, as we show in our latest forecast. This is mainly the result of the deep recession hitting these countries. But the process is also being directly fueled by reductions in public sector wages, as well as in the minimum wage (in the case of Greece). Moreover, some countries have cut unemployment benefits (Greece, Spain, Portugal) and simplified redundancy procedures (Italy, Greece, Portugal). Reducing job protection and simplifying dismissal procedures increases the likelihood of being unemployed. In a context of under-employment and sluggish demand, the result is further downward pressure on wages, thereby increasing the deflationary risks. Furthermore, there has also been an emphasis on decentralizing the wage bargaining process so that they are more in tune with business realities. This is leading to a loss of bargaining power on the part of trade unions and employees, which in turn is likely to strengthen downward pressure on real wages.

The euro zone countries are pursuing a non-cooperative strategy that is generating gains in market share mainly at the expense of other European trading partners. Thus since 2008 or 2009 Greece, Spain, Portugal and Ireland have improved their competitiveness relative to the other industrialized countries (see graph). The continuation of this strategy of reducing labor costs could plunge the euro zone into a deflationary spiral, as the countries losing market share seek in turn to regain competitiveness by reducing their own labour costs. Indeed, this non-cooperative strategy, initiated by Germany in the 2000s, has already contributed to the crisis in the euro zone (see the box on p.52 of the ILO report published in 2012). It is of course futile to hope that the continuation of this strategy will provide a solution to the current crisis. On the contrary, new problems will arise, since deflation [3] will make the process of reducing both public and private debt more expensive, since debt expressed in real terms will rise as prices fall: this will keep the euro zone in a state of recession.


[1] The Irish case is somewhat distinct, as the current account deficit seen in 2007 was due not to trade, but a shortfall in income.

[2] These reforms are examined in detail in a report by the Conseil d’analyse économique (no. 102). They are summarized in a special study La quête de la compétitivité ouvre la voie de la déflation (“The quest for competitiveness opens the door to deflation”).

[3] For a more comprehensive view of the dynamics of debt-driven deflation, see here.


A fiscal policy to promote structural reform – lessons from the German case

By Eric Heyer

“France should copy Germany’s reforms to thrive”, Gerhard Schröder entitled an opinion piece in the Financial Times on 5 June 2013. As for the European Commission (EC), its latest annual recommendations to the Member states, released on 29 May, seem to take a step back from its strategy of a rapid and synchronized return to balancing the public finances, which has been in place since 2010. The EU executive’s priority now seems to be implementation of structural reforms of the labour and services markets in the euro zone countries. These countries will of course continue to consolidate their public finances, but the EC has given them an extra year or two to do this. While, for example, France will further consolidate its accounts over the coming two years (the fiscal effort demanded of the French government by the EC comes to 0.8 percent of GDP, or 16 billion euros per year), it has been given another two years to bring its deficit below 3% of GDP (2015 instead of 2013). This change in course – or at least in tone – by the EC, which had emphasized the enactment of extreme austerity reforms, should be welcomed. However, it is important to consider whether the new environment, in particular the fiscal situation, will be favourable enough to ensure that the structural reforms are effective. An examination of the economic context in which Germany introduced its reforms in the early 2000s, which became a benchmark for the countries of southern Europe, provides some important lessons. While the purpose here is not to go into these reforms in depth, it is nevertheless useful to remember that they were enacted while the German economy had a substantial trade deficit (‑1.8 percent of GDP in 2000 against a surplus of 1.4 percent for France at that same time) and was considered a “low achiever” in Europe. These reforms led to a significant reduction in the share of wages in value added, boosting the margins of German business, and helped to quickly restore the competitiveness of the German economy: by 2005, Germany was once again generating a large trade surplus while France ran a deficit for the first time since 1991. The non-cooperative character of the the euro zone (OFCE, 2006) and the steep increases in Germany in poverty – (Heyer, 2012) and Figure 1 – and in wealth inequality (de Grauwe et Yi, 2013) were the hidden fruit of this strategy. Europe’s “low achievers” today are the southern European countries, and the pressure to take steps to boost competitiveness has shifted from Germany to France, Italy and Spain. Despite this parallel, the question remains: is the economic environment similar today? Figures 1 and 2 summarize the economic situation in Germany at the time the structural reforms were implemented. Two main points stand out:

  1. These reforms were carried out in a context of strong global growth: the world experienced average growth of over 4.7% per year in 2003-2006 (Figure 1).  By comparison, the figure for growth is likely to be less than 3% over the next two years;
  2. In addition, the fiscal situation of the German economy in the early 2000s was not good: in 2001, the general government deficit for Germany exceeded 3%, and came close to 4% in 2002, the year before the enactment of the first Hartz reform. Government debt then exceeded the threshold of 60% of GDP allowed by the Maastricht Treaty for the first time. Despite this poor fiscal performance – with public debt approaching 70% in 2005 – it is interesting to note that the German government continued to maintain a highly expansionary fiscal policy for as long as the reforms had not been completed: in the period 2003-2006, the fiscal impulse was positive at on average 0.7 GDP point each year (Figure 2). Thus, during this period the German government supported its structural reforms with a highly accommodative fiscal policy.

Thus not only was the structural reform of the labour market conducted under Schröder implemented in a very favourable economic environment (strong global growth and a strategy that differed from the other European countries), but it was also accompanied by a particularly accommodative fiscal policy, given in particular the poor state of Germany’s public finances. This situation differs greatly from contemporary conditions:

  1. Global growth is likely to be under 3% over the coming two years;
  2. The EC is asking a large number of European countries to implement the same structural reforms simultaneously, which in a highly integrated euro zone limits their effectiveness; and
  3. Despite the extra time being granted for deficit reduction, fiscal policy will remain very tight: as is indicated in Table 1, the fiscal impulses for France and Spain will still be very negative (-0.8 GDP point per year) as the structural reforms in these countries are being implemented.

So while the pressure to boost the competitiveness of the countries of southern Europe is similar to that facing Germany in the early 2000s, the external environment is less favourable and there is greater pressure to reduce the public debt. On this last point, the German example teaches us that it is difficult to juggle structural reforms to boost business competitiveness with efforts to reduce the public debt.


The strange forecasts of the European Commission for 2014

By Mathieu Plane

The figures for French growth for 2014 published by the European Commission (EC) in its last report in May 2013 appear to reflect a relative consensus. Indeed, the Commission expects GDP to grow by 1.1% in 2014, which is relatively close to the forecasts by the OECD (1.3%) and the IMF (0.9%) (Table 1). However, these forecasts of broadly similar growth hide some substantial differences. First, in defining future fiscal policy, the Commission, unlike the other institutions, considers only the measures already approved. While the Commission’s growth forecasts for 2013 included the measures enacted by the Finance Act for 2013 (and therefore the austerity measures), the forecasts for 2014 do not include any forthcoming fiscal measure, even though according to the stability programme submitted to Brussels in April 2013 the government plans austerity measures amounting to 20 billion euros in 2014 (a fiscal impulse of -1 GDP point). The exercise carried out by the Commission for 2014 is thus closer to an economic framework than an actual forecast, as it fails to include the most likely fiscal policy for the year. As a result, the French government has no reason to rely on the Commission’s growth forecast for 2014 as it makes radically different assumptions about fiscal policy. But beyond this difference, there is also a problem with the overall coherence of the economic framework set out by the Commission for 2014. It is indeed difficult to understand how for 2014 the Commission can forecast an increase in the unemployment rate with a significantly worsened output gap and a positive fiscal impulse.

Overall, all the institutions share the idea that the output gap in France is currently very wide, lying somewhere between -3.4 percent of GDP (for the EC) and -4.3 percent (for the OECD) in 2013 (Table 1). Everyone thus believes that current GDP is very far from its long-term trajectory, and this deficit in activity should therefore lead, in the absence of an external shock or a constraint on fiscal and monetary policy, to a spontaneous catch-up in growth in the coming years. This should result in a growth rate that is higher than the potential, regardless of the latter’s value. So logically, if there is a neutral or positive fiscal stimulus, GDP growth should therefore be much greater than the trend potential. For the IMF, the negative fiscal impulse (-0.2 percent of GDP) is more than offset by the spontaneous catch-up of the economy, resulting in a slight closing of the output gap (0.2) in 2014. For the OECD, the strongly negative fiscal impulse (-0.7 percent of GDP) does not allow closure of the output gap, which continues to widen (-0.3), but less than the negative impact of the impulse due to the spontaneous process of catching up. In both these cases (OECD and IMF), the restrictive fiscal policy holds back growth but leads to an improvement in the public accounts in 2014 (0.5 percent of GDP for the OECD and 0.3 for the IMF).

As for the Commission, its budget forecasts include a positive fiscal impulse for France in 2014 (+0.4 GDP point). As we saw above, the Commission takes into account only the fiscal measures already approved that affect 2014. However, for 2014, if no new fiscal measures are taken, the tax burden should spontaneously decrease due to the fall between 2013 and 2014 in the yield of certain tax measures or the partial financing of other measures (such as the CICE Tax credit for competitiveness and jobs). This could of course result in a positive fiscal impulse in 2014. But despite this impact, which is similar to a stimulus policy (on a small scale), the closure of the output gap (0.1 percent of GDP) is less than the fiscal impulse. This suggests implicitly that fiscal policy has no effect on activity and especially that there is no spontaneous catch-up possible for the French economy despite the very large output gap. But it is not clear why this is the case. Suddenly, the government balance deteriorates in 2014 (-0.3 percent of GDP) and the unemployment rate rises by 0.3 percentage points (which may seem paradoxical with an output gap that doesn’t worsen). The French economy is thus losing on all fronts according to the major macroeconomic indicators.

In view of the potential growth, the output gaps and the fiscal impulses adopted by the Commission (the OECD and the IMF), and based on incorporating relatively standard assumptions (a short-term fiscal multiplier equal to 1 and spontaneous closure of the output gap in 5 years), one would have expected the Commission to go for growth in France in 2014 of 2.1% (1.7% for the OECD and 1.2% for the IMF), and thus a steep reduction in unemployment.

Paradoxically, we do not find this same logic in the Commission’s forecasts for Germany and the euro zone as a whole (Table 2). In the case of Germany, despite a slight deterioration in the output gap in 2013 (-1 GDP point), which would normally point to some spontaneous catch-up by the German economy in 2014, and an almost neutral fiscal impulse (0.1 GDP point), Germany’s growth in 2014 is expected to be 1.8%, thus permitting the output gap to close by 0.5 GDP point, resulting in a fall in the unemployment rate and a reduction in Germany’s public deficit in 2014.

In the case of the euro zone, we find the same scenario: a marginally positive fiscal impulse (0.2 percent of GDP) and a rapid reduction in the output gap (0.7 percent of GDP), which translates both into an improvement in the public accounts despite the positive fiscal impulse and a fall in the unemployment rate (even if we would have expected a greater reduction in the latter in light of the improvement in the output gap).

Given the potential growth, the output gaps and the fiscal impulses adopted for each country by the Commission, the forecast for 2014 could have been for growth of 2.1% in France, 1.6% in Germany and 1.3% for the euro zone.

Finally, why would France, despite a greater output gap than Germany and the euro zone and a stronger positive fiscal impulse, experience an increase in its unemployment rate in 2014 while the rate falls in the other countries? Should we interpret this as reflecting that it is a problem or even impossible for the Commission to include in a forecast that a policy without fiscal consolidation could lead to growth and reduce unemployment spontaneously in France?


What factors have put the brakes on growth since 2010?

By Eric Heyer and Hervé Péléraux

At the end of 2012, five years after the start of the crisis, France’s GDP has still not returned to its earlier level (Figure 1). At the same time, the labour force in France has grown steadily and technical progress has constantly raised workers’ productivity. We are therefore more numerous and more productive than 5 years ago when output was lower: the explosion in unemployment is a symptom of this mismatch. Why had the shoots of recovery seen in 2009 been choked off by mid-2010?

The main factor stifling the recovery has been the austerity measures that were enacted in France and Europe in 2010 and then intensified in 2011 and 2012 (Table 1). The impact of austerity has been all the more marked as it has been generalized throughout the euro zone. The effects of domestic cutbacks have combined with the effects of undercutting demand from other European partners. Given that 60% of France’s exports are to the European Union, any external stimulus had virtually vanished by mid-2012, less due to the slowdown in global growth, which is still almost 3%, than to the consequence of the poor performance of the euro zone, which is on the brink of recession.

It is austerity that is at the root of the lack of growth: after shaving -0.7 GDP point off growth in 2010, its effects increased in 2011 and 2012 (respectively -1.5 and -2.1 points) because of the stepped-up measures and the existence of high fiscal multipliers. Indeed, in a period of low economic activity simultaneously tightening fiscal policy in all the European countries while there is very little manoeuvring room for monetary policy (real interest rates close to zero) has led to raising the value of the multiplier. There is now a broad consensus that the short-term fiscal multipliers are high, especially as full employment is still out of reach (see Heyer (2012) for a review of the literature on multipliers). The theoretical debate about the value of the multiplier and the role of agents’ expectations must give way to empirical observation: the multipliers are positive and greater than 1.

In addition to the fiscal drag, there is the effect of tight monetary conditions: the easing of monetary policy – seen in particular in the lower key interest rates – is far from enough to offset the negative effect on the economy of tighter borrowing conditions and the widening of the spread between private investment and risk-free public investment.

All things considered, including taking into account the impact of the resurgence in oil prices after the onset of the recession, the spontaneous growth of the French economy would have averaged 2.6% over the past three years. The realization of this potential would have led to a further reduction in excess production capacity and would ultimately have cut short the downturn in the economy that actually took place.


In the Netherlands, change is for now!

By Christophe Blot

While France has just reaffirmed that it will meet its commitment to reduce its budget deficit to below 3% by 2014 (see Eric Heyer), the Netherlands has announced that it is abandoning this goal on the grounds that additional austerity measures could jeopardize growth. The country plunged into recession in 2012 (-1%), and GDP will fall again in 2013 (see the analysis of the CPB, the Netherlands Bureau for Economic Policy Analysis). In these circumstances, the social situation has deteriorated rapidly, with a 2 percentage point rise in unemployment in five quarters. In the first quarter of 2013, 7.8% of the workforce was out of work. Beyond the implications for the Netherlands itself, could this rejection of austerity (finally) signal a shift in Europe’s strategy of fiscal consolidation?

Up to now, the coalition government elected in September 2012 and led by the Liberal Mark Rutte had followed the general strategy of consolidation, with expectations of rapidly bringing the deficit below 3%. However, the austerity measures already being implemented together with an adjustment in the housing market and the general decline in activity throughout the euro zone led the Netherlands into a new recession in 2012 and put off the prospects of meeting the budget target in 2013. In view of the European Commission’s projections for growth and for the budget deficit in 2013, it does however seem that the Dutch government would have been able to achieve a deficit of 3% in 2014, but like France, at the cost of taking additional measures.

The budget deficit is expected by the Commission to come to 3.6% in 2013. The CPB expects an even slightly lower deficit (3.3%), using growth forecasts similar to those of the Commission. In these conditions, the fiscal effort required to reach the 3% target in 2014 would amount to between 3.5 and 7 billion euros. In comparison, for France this would require the approval of additional austerity measures for 2014 amounting to 1.4 GDP points, i.e. just under 30 billion euros (see France: holding to the required course).

However, under pressure from the social partners, the Dutch government ultimately abandoned the plan announced on March 1 that provided for savings of 4.3 billion euros, which mainly consisted of a wage freeze in the public sector, a freeze in the income tax scale and the stabilization of public spending in real terms. Putting austerity on hold like this should give a small boost to the economy without calling into question fiscal sustainability, as the improved prospects for growth should reduce the cyclical component of the budget deficit.

While the 3% target will of course not be met, it is not at all clear that the markets will make much out of this infringement of the rules. In fact, the difference in interest rates vis-à-vis the German rate has stabilized since it was announced that the plan had been abandoned, whereas the difference had tended to increase in the previous weeks (see figure).

While this decision should not upset the economic and financial stability of the Netherlands or the euro zone, it does nevertheless send a strong anti-austerity signal from a country that had hitherto favored fiscal consolidation. It is therefore one more voice that is challenging the effectiveness of this strategy and emphasizing the economic and social risks associated with it (see here for an overview of the case against austerity and the 2013 iAGS report for more specific points concerning an alternative strategy for Europe). It is also a decision that should give France inspiration. Credibility is not necessarily gained by sacrificing one objective (growth and employment) for another (the budget deficit). It is still necessary to await the response of the European Commission in that the Netherlands, like most countries in the euro zone, is subject to an excessive deficit procedure. If the decision of the Netherlands is not challenged, then this will represent a significant shift in European macroeconomic strategy.


France’s Stability Programme: the missing line

By Eric Heyer

On April 17, the government presented its Stability Programme for 2013-2017 for the French economy. For the next two years (2013-2014), the government has relied on the projections of the European Commission in forecasting growth of 0.1% in 2013 and 1.2% in 2014. Our purpose here is not to revisit these forecasts, though they do seem overly optimistic, but rather to discuss the analysis and outlook for France for the period 2015-2017 that is explicit and sometimes implicit in this document.

According to the document provided to Brussels, the government is committed to maintaining its fiscal consolidation strategy throughout the five-year period. The structural effort will lessen over the years, representing only 0.2 percent of GDP in 2017, i.e. nine times less than the effort required of citizens and business in 2013. Under this assumption, the government expects a return to 2% annual growth during the period 2015-2017. The deficit will continue to shrink, reaching 0.7 percent of GDP in 2017. This effort would even lead for the first time in over 30 years to a structural fiscal surplus in 2016, rising to 0.5 percent of GDP in 2017. For its part, public debt would peak in 2014 (at 94.3 GDP points) then begin to decline from 2015 to a level of 88.2 GDP points by the end of the five-year period, which is lower than the level when the Socialists came to power (Table 1). It should be noted, however, that in this official document nothing is said about the changes in unemployment that the government expects will result from its policies by the end of the five-year period. This is the reason for our introduction of a missing line in Table 1.

Based on assumptions similar to those of the government for fiscal policy as well as for the potential for growth, and starting from the same short-term situation, we have attempted to verify the analysis provided by the government and to supplement it by integrating the changes in unemployment related to its Programme.

Table 2 summarizes this work: it indicates that growth would accelerate gradually over the period 2015 to 2017, to over 2% in 2017. Growth over the period would average 1.8%, a rate close to but slightly lower than the 2% expected in the Stability Programme [1].

At end 2017, the deficit would be close to the government target, without however reaching it (1 GDP point instead of 0.7 GDP point). The public debt would also fall to a level comparable to that in 2012.

In this scenario, which is similar to that of the government, the trend in unemployment will not reverse until 2016; by the end of the five-year period, the unemployment rate is expected to be 10.4% of the working population, i.e. a level higher than that prevailing at the time François Hollande assumed office.

The scenario proposed by the government in the Stability Programme seems optimistic in the short term and misses the goal in the medium term. On this last point, it seems surprising to want to stick to a policy of austerity after the economy has seen the public finances balanced in structural terms and while the unemployment rate is rising above its historical peak.

A more balanced approach could be considered: assume that from 2014 the euro zone adopts a “reasonable” austerity plan aimed at both restoring the structural balance of the public finances and reducing the unemployment rate. This alternative strategy would involve rolling back the planned fiscal stimulus in all the euro zone countries and limiting it to 0.5 GDP point [2]. This would constitute a fiscal effort that could be sustained over time and allow France, for example, to eliminate its structural deficit by 2017. Compared to the current plans, this would provide a greater margin for maneuver that would spread the burden of the adjustment more fairly.

Table 3 summarizes the results of simulating this new strategy. Less austerity leads to more growth in all the countries. However, our simulation also takes into account the impact of economic activity in one country on other countries via international trade. In 2017, in the “less austerity” scenario, the public finances would be in the same state as in the baseline scenario, with the additional growth offsetting the reduced effort. However, in this scenario, unemployment would decline in 2014, and by 2017 would have fallen to a level comparable to the 2012 level.


[1] The difference in growth can arise either because of not taking into account the impact of foreign trade due to the austerity plans being implemented in other partner countries, or because the fiscal multiplier used in the Stability Programme is lower than in our simulation, where it is around 1. Indeed, we believe that in a period of low economic activity, adopting policies of fiscal restraint that are applied simultaneously in all the European countries and when there is little maneuvering room for monetary policy (real interest rates are close to zero) leads to pushing up the value of the multiplier. There is also now a broad consensus on the fact that the short-term multipliers are high, especially given that full employment is still out of reach (see Heyer (2012) for a review of the literature on multipliers).

[2] This strategy has already been simulated in previous OFCE work, such as that by Heyer and Timbeau in May 2012, by Heyer, Plane and Timbeau in July 2012 and by the iAGS report in November 2012.