By Eric Heyer
In May, inflation in the euro area moved closer to the ECB target. The sharp rise in inflation, from 1.2% to 1.9% per annum in the space of one month, did not nevertheless provoke a reaction, since the main reason for it was well known and common to all the countries: the surge in oil prices. After having plummeted to 30 dollars a barrel at the beginning of 2016, the price per barrel now stands at around 77 dollars, the highest level since 2014. Even after adjusting for the exchange rate – the euro has appreciated against the dollar – the price of a barrel has increased by almost 40% (18 euros) over the last 12 months, directly causing prices in the net oil importing countries to rise at an accelerating pace. In addition to this common effect, for France the impact of the hike in indirect taxes on tobacco and fuels, which came into force at the beginning of the year, will, according to our estimates, add 0.4 point to the price index.
At the same time, the underlying inflation (or core inflation) index, excluding products with volatile prices (such as oil and fresh produce) as well as prices subject to state intervention (electricity, gas, tobacco, etc.), is still not picking up pace and is staying below 1%. The second-round effect of an oil shock, which passes through a rise in wages, does not seem to be very significant, since consumers are absorbing most of the shock by reducing their purchasing power. This explains part of the observed slowdown in household consumption at the beginning of the year as well as the general lack of reaction of the monetary authorities to the announcement of the inflation figures.
There remains the question of the weakness of trend inflation and its link with the state of the economy. Have we already caught up with the output gap that arose since the Great Depression of 2008 (an output gap of close to zero), or are there still production capacities that can be mobilized in the event of additional demand (positive output gap)? In the first case, this would mean that the link between growth and inflation has been significantly broken; in the second case, this would indicate that the low level of inflation is not surprising and that the normalization of monetary policy needs to be gradual.
In 2017, even though the process of recovery was consolidating and spreading, most developed economies were still lagging behind their pre-crisis trajectory. Only a few seem to have already overcome the lag in growth. Thus, two categories of countries seem to be emerging: the first – in particular Germany, the United States and the United Kingdom – includes countries that have caught up with their potential level of production and are at the top of the cycle; the second – which includes France, Italy and Spain, for example – includes countries that are still experiencing a lag in production which, according to the economic analysis institutes, lies between 1 and 2 points of GDP for France and Italy and 3 points of GDP for Spain (Figure 1).
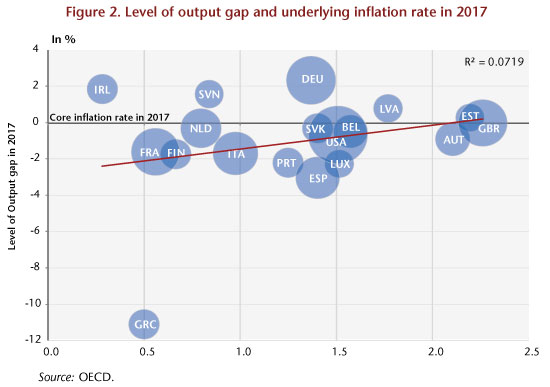
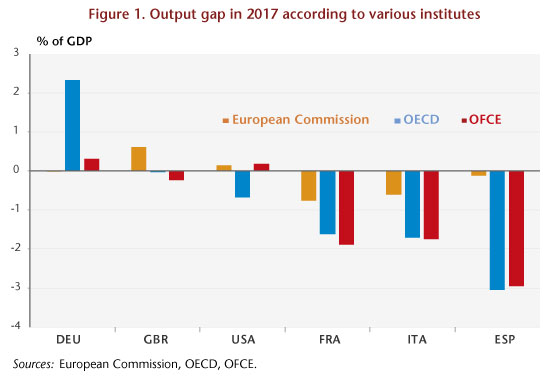 The presence of developed countries in both categories should logically result in the appearance of inflationary pressures in the countries listed in the first group and an inflation gap in those in the latter. However, these two phenomena were not apparent in 2017: as shown in Figure 2, the link between the level of the output gap and the underlying inflation rate is far from clear, casting doubt on the interpretation to be made with respect to the level of the output gap: to uncertainties relating to this notion is added that associated with the level of this gap in the past, in 2007 for example.
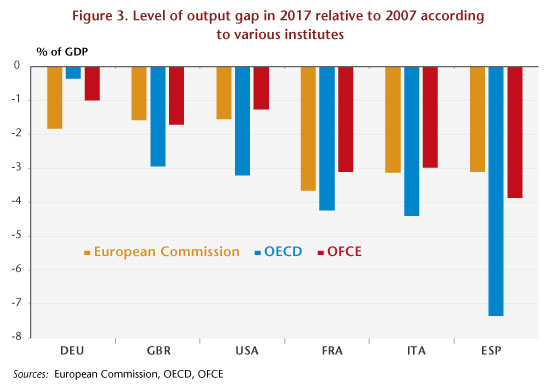
 Given this high level of uncertainty, it seems appropriate to make a diagnosis based on how this output gap has varied since 2007. Such an analysis leads to a clearer consensus between the different institutes and to the disappearance of the first category of countries, those with no additional growth margin beyond their own potential growth. Indeed, according to these, in 2017 none of the major developed countries would have come back to its output gap level of 2007, including Germany. This gap would be around 1 GDP point for Germany, 2 GDP points for the United Kingdom and the United States, more than 3 GDP points for France and Italy and around 5 GDP points for Spain (Figure 3).
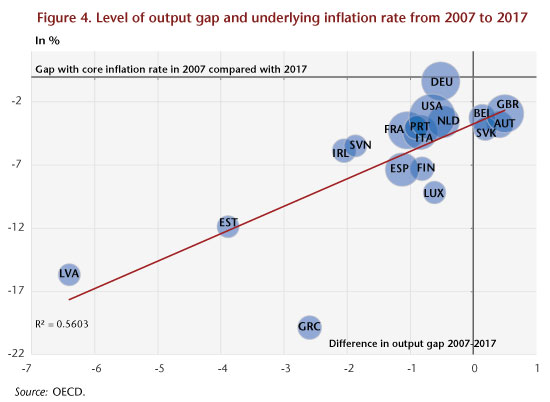
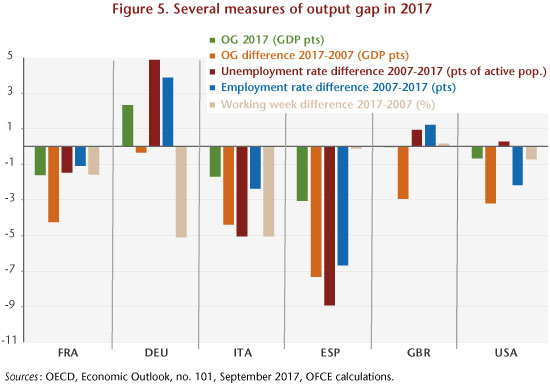
 This analysis is more in line with the diagnosis of the renewal of inflation based on the concept of underlying inflation: the fact that the economies of the developed countries had not in 2017 recovered their cyclical level of 2007 explains that inflation rates were lower than those observed during the pre-crisis period (Figure 4). This finding is corroborated by an analysis based on criteria other than the output gap, notably the variation in the unemployment rate and the employment rate since the beginning of the crisis and in the rate of increase in working hours during this same period. Figure 5 illustrates these different criteria. On the basis of these latter criteria, the qualitative diagnosis of the cyclical situation of the different economies points to the existence of relatively high margins for a rebound in Spain, Italy and France. This rebound potential is low in Germany, the United States and the United Kingdom: only an increase in working time in the former or in the employment rate for the latter two could make this possible.
Leave a Reply