German women work less than French women

By Hélène Périvier and Gregory Verdugo

In terms of the employment rate, French women work less than German women: in 2017 the employment rate of women aged 15 to 64 was 67.2% in France against 75.2% in Germany. But this commonly used indicator does not take into account that to arrange their time German women are more likely to be in part-time work than French women. This is because underemployment and labour market regulations differ in the two countries, in particular as Germany has a plentiful supply of part-time mini-jobs that are held by women more than men. Moreover, the differences in terms of policies affecting the family life-work-life balance in the two countries make it possible to deal with early childhood more extensively in France than in Germany and lead German women to take up part-time work.

To compare the employment situation of women in France and Germany, we use indicators that take into account working time, which we calculate by age to illustrate a life cycle perspective [1]. The results confirm that German women are in part-time work more than their French counterparts, and this is particularly marked at the age of maternity. These differences in women’s working hours explain why the gender pay gap is higher in Germany than in France.

Employment rate and employment rate in full-time equivalents by age

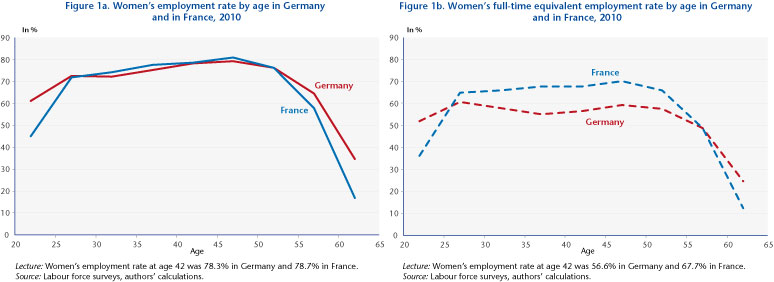
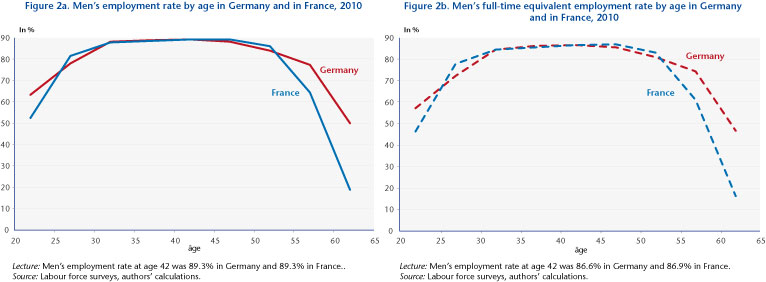
Comparing employment rates with employment rates in full-time equivalents over the life cycle highlights the significant differences between the two countries in terms of the reduction in women’s working hours at the ages when the family constraint is the strongest, between 30 and 40 years old. Figures 1A and 1B show employment rates and full-time equivalent employment rates by age for women in 2010, the moment when European countries were to have reached a female employment rate of 60% according to the Stratégie européenne de l’emploi (EES). Figures 2A and 2B show these same indicators for men.

If we restrict ourselves to employment rates, the models seem similar in the two countries: changes in the employment rates over the life cycle for women are quite similar, as is the case for men (with the exception of the ages of entering and leaving working life, which differ between the two countries for both sexes). In Germany as in France, women’s employment rate is high, but the gap with men increases between age 30 and 40 (solid lines).

Once part-time work is taken into account, the gender division of labour turns out to be much more marked in Germany than in France (dashed lines) [2].

At all ages, the full-time equivalent employment rate for women is lower in Germany than in France (whereas for men it is close to the employment rate, for both countries). From the age of 30, the female full-time equivalent employment rate falls below 60% in Germany, while in France it is above 65%. This means that German women are adjusting their working time more as family constraints become stronger. For men, the full-time equivalent employment rates are close to the employment rates at all ages in both countries.

Graphes1a-1b_post04-02ENGGraphes2a-2b_post04-02ENG

The overall wage gap: the impact of working time

The massive use of part-time work by women in Germany compared to France explains a large part of the wage differentials, which are higher there. The global wage gap indicator calculated by Eurostat [3] shows that the overall wage gap is very high in Germany (45% compared to 31% in France), and that this is due mainly to differences in working time. On average German women work 122 hours a month against 144 for French women, with the average hourly wage rate being comparable (Table).

Tabe_post04-02-2019ENGThus policies aimed at occupational equality cannot leave aside the issue of working time and the quality of the jobs held by women. It seems that from this point of view France is doing better than Germany, although much remains to be done in this area.


[1] This blog is taken from: « La stratégie de l’Union européenne pour promouvoir l’égalité professionnelle est-elle efficace ? », [Is the European Union’s strategy for promoting occupational equality effective?], Périvier H. and G. Verdugo, Revue de l’OFCE, no. 158, 2018.

[2] Full-time equivalent employment rates were calculated from the European Labour Force Surveys. Each job is weighted by the number of hours worked. A full-time job is defined as a job where the number of hours worked is greater than or equal to 35. If the number of hours worked is between 25 and 34, we assign a weight of 75% of a full-time job, a weight of 50% if the number of hours is between 15 and 24, and a weight of 25% if the number of hours is less than 14 hours.

[3] The gap calculated by Eurostat corresponds to the average wage differential for the entire population.


The French economy: Lasting or transitory slowdown?

By the OFCE France team

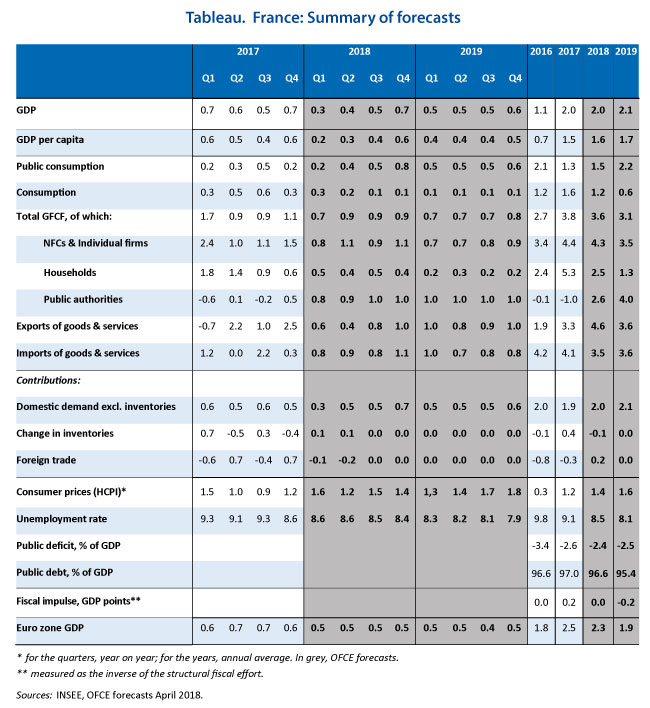
On Friday, April 27, the INSEE published the national accounts for the first quarter of 2018. With growth of 0.3%, the French economy seems to be slowing down, even though after five years of sluggish growth (0.8% on average over the period 2012-16) a recovery finally materialized in 2017 when GDP rose 2%. While the quarterly profile of GDP growth in 2018 will be marked by the timing of fiscal measures, which will affect purchasing power (rise in indirect taxation and the CSG tax) and thus the trajectory of household consumption, the impact, which is anticipated in our spring forecast (Table), should be only provisional. Household purchasing power should increase in the following quarters, with a sharp acceleration at the end of the year driven by the fall in the housing tax and the second tranche of reductions in social security contributions.

The increase in consumption, weak in the first half and strong in the second, will therefore lead growth to pick up pace through the year, from 0.3% in the first quarter to 0.7% by year end. In 2019, as a result of the rise in the tax measures to shore up household purchasing power, the latter will increase by 2.4% (from 1.6% in 2018), boosting consumption for the year as a whole (2.2% in 2019 after 1.5% in 2018), despite a further rise in indirect taxation.

Business investment is expected to continue its robust growth in 2018 and 2019, supported by the ongoing improvement in profit rates, the continued low cost of capital, and growing demand, which is keeping the utilization rate at a high level. After shrinking for several years, general government investment is set to rise again in 2018 and 2019, with the gradual roll-out of the Grand Plan d’Investissement [Major Investment Plan] and the goal of maintaining investment by local authorities. Household investment should slow, as indicated by the downturn in housing demand surveys and the outlook for housing starts, probably in connection with the reduction in budget allocations for housing and with the wait-and-see attitude on the construction market following the discussion to be expected about the ELAN bill.

A pick-up in exports, confirmed by favorable survey trends, record levels of exporter margins and strong productive investment will translate into strengthening export market shares. Given the dynamic economic environment in the euro zone, foreign trade will no longer be a drag on France’s growth in 2018 and 2019.

Given this robust growth in 2018 and 2019, job creation, driven by the market sector, will remain dynamic (+194,000 in 2018 and +254,000 in 2019), which will push down the unemployment rate to 8.4% by the end of 2018 and to 7.9% by the end of 2019 (compared to 8.6% in the fourth quarter of 2017). On the other hand, the sharp fall in new government-assisted contracts in 2018 will slow the pace of the reduction in unemployment, despite the ramp-up of the Plan Formation et de la Garantie jeunes (Training Plan and Youth Guarantee).

The public deficit will be reduced only slowly (2.4% of GDP in 2018 and 2.5% in 2019, after 2.6% in 2017), but this masks a sharp improvement in the government balance, which will reach 1.6% in 2019 excluding the one-off measure related to the conversion of the CICE credit into reductions in social contributions. However, deficit reduction should be sufficient to ensure that France leaves the corrective arm of the Stability Pact and to begin to reduce the public debt (from 97% of GDP in 2017 to 95.4% in 2019).

Tabe_Post_prevFrance_ENG


The minimum wage: from labour costs to living standards. Comparing France, Germany and the UK

By Odile Chagny, IRES, Sabine Le BayonCatherine Mathieu, Henri Sterdyniak, OFCE

Most developed countries now have a minimum wage, including 22 of the 28 EU countries. France has long stood out for its relatively high minimum wage, the SMIC. But in 1999, the United Kingdom introduced a minimum wage, and the British government’s goal is to raise this level to 60% of the median wage by 2020, which would bring it to the level of France’s SMIC and among the highest-ranking countries in the OECD. More recently, in 2015, Germany also introduced a minimum wage.

Note that gross pay is a legal concept. What matters from an economic point of view is the cost of labour for a firm as well as the disposable income (including benefits and taxes) of a household in which employees earn the minimum wage.

In OFCE Policy Brief no. 34 we present a comparison of the minimum wages in force in 2017 in these three countries, using standard cases, from the viewpoint first of the cost of labour and then with respect to employees’ standard of living.

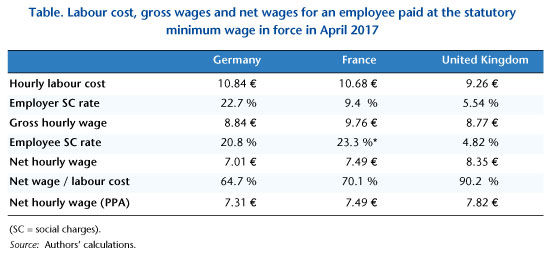
It appears that the cost of labour is slightly higher in Germany than in France, and much more so than in the United Kingdom, and that the reforms announced in France for 2019 (reducing contributions) will strengthen France’s competitive advantage vis-à-vis Germany. The cost of labour at the minimum wage is therefore not particularly high in France (Table).

Tabe_post_ENG

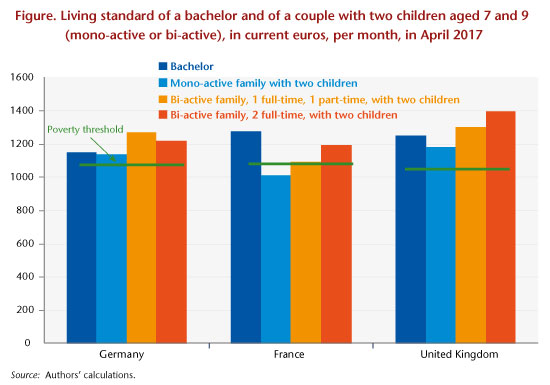
With regard to disposable income, a comparison of different arrangements for working time and family situations highlights different logics in the three countries. In Germany, the underlying rationale is to protect families from poverty, regardless of the parents’ working situation. In France, in contrast, a family with two children has to have two people working full-time at the SMIC to escape poverty, as the tax-benefit system seeks to encourage women’s integration into the labour market. France is thus the only one of the three countries where a mono-active family with two children, one of whose parents works full-time at the minimum wage, falls below the monetary poverty line (Figure).

Graphe_post23-3_ENGFrom the point of view of the relative position of minimum wage earners in relation to the general population, our study highlights the rather favourable situation of the United Kingdom. The living standard there is comparatively high: all the families considered in our typical cases have a standard of living above the poverty line, on the order of 30% higher for a family where both parents work full-time at the minimum wage. The gain from taking up a job is, as in France, high, while it is low in Germany in all the configurations.

Finally, our analysis is contributing to the debate about the establishment of a Europe-wide minimum wage. A policy to harmonize the minimum wage in Europe, as this is conceived by the European Federation of Trade Unions and supported by France, cannot be thought of solely in terms of labour income, but also needs to take into account the goals targeted in terms of living standards, especially for families.


France’s growth in 2018-2019: What the forecasters say …

By Sabine Le Bayon and Christine Rifflart

Following the INSEE’s publication of the first version of the accounts for the fourth quarter of 2017 and a first estimate of annual growth, we have been considering the outlook for 2018 and 2019 based on a comparative analysis of forecasts made for France by 18 public and private institutes, including the OFCE, between September and December 2017. This post presents the highlights of this analysis, which are given in detail in OFCE Policy Brief No. 32 of 8 February 2018 entitled, “A comparison of macroeconomic forecasts for France” and the associated working paper (No. 06-2018) (which contains the tables of the institutes’ forecasts).

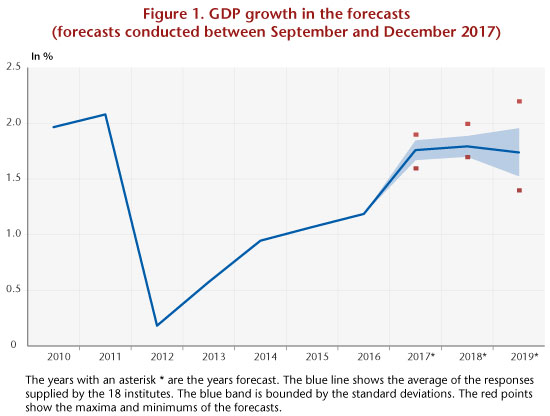
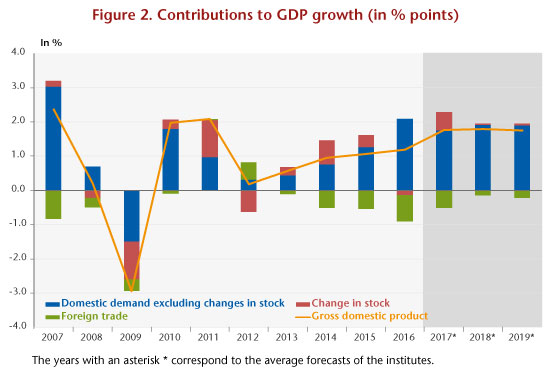
Following the deep recession of 2008-2009 and the euro zone crisis of 2011, the French economy started a slow recovery, which picked up pace in late 2016. The year 2017 was thus a year of recovery, with slightly higher growth than most forecasters had recently expected: 1.9% according to the INSEE’s first estimate, compared to an average forecast of 1.8%. This momentum is expected to continue in 2018 and 2019, with the forecasts averaging 1.8% and 1.7%, respectively. The standard deviations are low (0.1 point in 2018 and 0.2 in 2019), and the forecasts are fairly close for 2018 but diverge more sharply in 2019 (ranging from a low of 1.4% to a high of 2.2%) (Figure 1). In 2019, 5 out of 15 institutes expect growth to accelerate while 8 foresee a slowdown.

IMG1_postSLB-CR_ENG

Overall, all but four of the institutes anticipate a rebalancing of the drivers of growth over the period, with trade having less of an adverse effect than in the past and domestic demand still buoyant (Figure 2). However, the recovery in foreign trade is under debate in light of the chronic losses in market shares recorded since the beginning of the 2000s. Indeed, it seems that the expected pick-up in exports in 2018 will be due more to a recovery in foreign demand for France’s output and to the rundown of the export-oriented stocks accumulated in 2016 and 2017 in certain sectors (in particular transport equipment and aeronautics) than to any recovery in competitiveness. For 2019, there are differences in opinion about the impact of the supply policies implemented since 2013 on French companies’ price and non-price competitiveness. Some institutes expect an improvement in export performance and thus a regain of market share by 2019, while others foresee a loss of share due to insufficient investment in high value-added sectors and labour costs that still burden business.

IMG2_postSLB-CR_ENGThere is also debate over the forecasts for jobs and wages, in particular over the impact of the cutbacks in subsidized jobs, the effect of the policies to lower labour costs in 2019 (transformation of the CICE competitiveness tax credit into lower employer social contributions) and productivity (trend and cycle). On average, the unemployment rate should fall from 9.5% in 2017 to 8.8% in 2019, with forecasts ranging from 8.1% for the most optimistic to 9.2% for the most pessimistic. Some differences in the forecasts on wages can be attributed to differing assessments both of the degree of tension on the labour market and also of the impact on wages of the more decentralized collective bargaining set up in 2017. Wages are expected to rise by 1.8% in 2017 and on average by 1.9% in 2018 and 2% in 2019 (ranging from 1.3% for the lowest forecast to 2.6% for the highest).

In this context, growth will rise much faster than potential growth, which is estimated by most institutes at around 1.25% (some institutes expect an acceleration due to the positive impact of structural reforms and investment, while others foresee lower potential growth). While in 2017, the growth gap – the difference between observed GDP and potential GDP – is clearly negative (between -2.2 and -0.7 points of potential GDP), this will close by 2019. Most of the institutes (from those that provided us with data or qualitative information) believe the output gap will close (close to 0 or clearly positive) and inflationary pressures could appear. For four institutes, the output gap will be around -0.7 point.

Finally, for all the institutes the budget deficit should fall below the threshold of 3% of GDP by 2017. France will exit the excessive deficit procedure in 2018. But despite the vigorous growth, and in the absence of stricter fiscal consolidation, for most of the institutes the public deficit will remain high over the period.


France’s RSA income support: 35% lack of take-up?

By Guillaume Allègre, @g_allegre

The lack of take-up of France’s RSA income supplement benefit is often invoked as an argument for reforming the system for assisting people on low incomes (such as a Universal Income or establishment of a single social benefit that would merge the RSA, the in-work Prime d’activité benefit and Housing benefit). According to the CNAF, the lack of take-up of the base RSA benefit (RSA-socle) is 36% (CNAF, 2012). To arrive at this estimate, the CNAF relies on a quantitative survey conducted over the phone with 15,000 households selected from their tax returns. The RSA quantitative survey was specifically designed to replicate an eligibility test for the benefit. However, some households who are ineligible for the RSA claim they are benefitting from it. This category represented 524 households in the survey, i.e. 11% of the beneficiaries. This could result from a reporting error at the time of the survey, or from an approximation of the survey’s eligibility test. In any case, the existence of this category shows that it is difficult to estimate the lack of take-up of a benefit using a survey, even a specific one. In addition, the Secours catholique association estimates the lack of take-up of the base RSA at 40% (out of all the households they encountered in 2016) [1].

There is another way to estimate the lack of take-up of the RSA. Recently, the INSEE and DREES have opened up access to the INES micro-simulation software. The INES can be used to simulate the socio-fiscal legislation by using the ERFS (Survey of Tax and Social Income). The ERFS is based on tax declarations; the survey – based on administrative data – is therefore very exhaustive (households are required to report their income every year). The ERFS, however, has limitations: it concerns only so-called ordinary households. It excludes people who do not have a residence (the homeless) and people who live in institutions (army, retirement homes, etc. [2]). The survey field is metropolitan France. The tax returns are annual, but the resource base of the RSA are quarterly revenues, which implies, to simulate the RSA, rendering income “quarterly” on the basis of ad hoc assumptions.

According to the simulation done on the INES (2015 legislation), the number eligible for the base RSA in the fourth quarter of 2015 should be around 2,000,000 households, while according to the CNAF the actual number of beneficiaries of the base RSA (RSA-socle) in December 2015 was 1,720,000[3]. According to the ERFS survey (and microsimulations), the lack of take-up of the base RSA would be 14%[4].

So is the lack of take-up of the base RSA 14% or 36%? The truth undoubtedly lies in between, but at what level? The lack of take-up of housing benefits is estimated at 5% (Simon, 2000). But the two benefits (RSA, housing benefits) have similar target groups. The lack of take-up of the RSA is certainly higher than that for housing benefits (the target population is poorer, the administrative procedures are more extensive for the RSA). On the other hand, the difference between 5% (estimated lack of take-up for housing benefits) and 36% (lack of take-up estimated by CNAF for the RSA) is difficult to explain.


To cite this note: Guillaume Allègre (2018), “France’s RSA income support: 35% lack of take-up?”, OFCE Le Blog, January.


[1] Source: 2017 report by Secours catholique : https://www.secours-catholique.org/sites/scinternet/files/publications/rs17_0.pdf

[2] But this is not important for the RSA as people over age 65 are eligible for another means-tested benefit, the ASPA.

[3] Base RSA + Base RSA and RSA activité in-work benefit, metropolitan France. CAF+MSA Sources : http://data.caf.fr/dataset/foyers-allocataires-percevant-le-revenu-de-solidarite-active-rsa-par-caf

http://statistiques.msa.fr/wp-content/uploads/2017/01/Situation-du-RSA-au-regime-agricole-a-fin-2015.pdf

[4] This result varies by a few percentages depending on the year, which shows that the model is – like any model – imprecise. The INES team (INSEE-DREES) considers that the model cannot be used to measure the lack of take-up, in particular because the ERFS does not capture very low incomes well (the estimated lack of take-up using the INES would thus underestimate real non-take-up). Historically, the ERFS is not considered very good for estimating the eligibility for the base RSA. It is true that as RSA beneficiaries are by construction not taxable, they do not risk a penalty in case of misrepresentation. This problem has been solved (partially) by using pre-filled declarations.


France: growth as inheritance

by OFCE Department of Analysis and Forecasting (France team)

This text summarizes the OFCE’s 2017-2019 forecast for the French economy; the full version can be found here.

After five years of sluggish growth (0.8% on average over the period 2012-16), a recovery is finally taking shape in France, with GDP expected to rise by 1.8% in 2017, 1.7% in 2018 and 1.9% in 2019. Some negative factors that affected 2016 (a fall in agricultural production, impact of terrorist attacks on tourism, etc.) were no longer at work in 2017, and the economy should now feel the full benefit of the supply-side policies implemented during the Hollande presidency. Added to this is the ripple effect from stronger growth in the European economies. Fiscal consolidation should be at a lower level in the coming two years[1] (0.3 GDP point over 2018-2019), and should not jeopardize the ongoing recovery or the fall in unemployment that started in 2015. In total, by incorporating the delayed impact of past supply-side policies, fiscal policy will have a neutral impact on GDP growth in 2018 and a slightly positive one in 2019 (+0.2 GDP point). The reduction of the public deficit will be slow (2.9% of GDP in 2017, 2.6% in 2018 and 2.9% in 2019), but this masks a sharp improvement in the public balance in 2019, excluding the one-off impact from the conversion of the CICE tax credit. The reduction should be sufficient to stay below the 3% mark and ensure the exit from the corrective arm of the Stability Pact.

The brighter financial prospects for French business and the pick-up in productive investment since 2015 should boost export market shares. Given the more buoyant economic environment in the euro zone, foreign trade should no longer be a drag on France’s growth. Ultimately, economic growth will be relatively robust, creating jobs in the commercial sector (247,000 in 2017, 161,000 in 2018 and 223,000 in 2019) and bringing down the unemployment rate in metropolitan France to 9.2% by the end of the second quarter 2017, to 8.9% by the end of 2018 and to 8.5% by the end of 2019. But the sharp decline in new subsidized contracts in the second half of 2017, which will continue in 2018 (falling from 320,000 in 2017 to 200,000 in 2018) and the completion of the implementation of tax plans to enrich job growth (the CICE, Liability pact), and sometimes their elimination (hiring bonus), will be a significant drag on efforts to cut unemployment in 2018.

[1] This forecast does not take into account measures included in the 2018 supplemental Budget Bill (PLFR).


Universal basic income: An ambition to be financed

By Pierre Madec and Xavier Timbeau

This evaluation of Universal Basic Income (UBI), the flagship proposal of French presidential candidate Benoît Hamon, highlights a potentially important impact of the measure on the living standards of the least well-off households and on inequalities in living standards. If implemented, a universal basic income would have the effect of making France one of the most egalitarian countries in the European Union. In return, the “net” cost of the programme could be high, around 45 to 50 billion euros. Given the measure’s cost, financing it through an income tax reform could make the French socio-fiscal system even more redistributive, but would lead to a considerable increase in the marginal tax rates borne by the wealthiest households.

By making it one of the flagship proposals of his election programme for the presidency, Benoît Hamon has revived the debate around a universal basic  income (UBI). It is a radical project, the subject of numerous controversies (see, for example, Allègre and Sterdyniak, 2017), so the quantification of the programme is needed. Starting from Benoît Hamon’s proposal, which has been significantly modified in recent weeks, we attempt here, using a number of important assumptions (total or partial individualization, dependence on other social benefits) to make an initial evaluation. The idea here is neither to enter into the debate as to whether the modalities of application chosen are relevant, such as the exclusion of pensioners, nor to judge how close the proposal in its present form comes to an ideal of universality. Rather the aim is to avoid this type of debate and to qualify and quantify the effects of the implementation of the UBI as proposed by the presidential candidate.

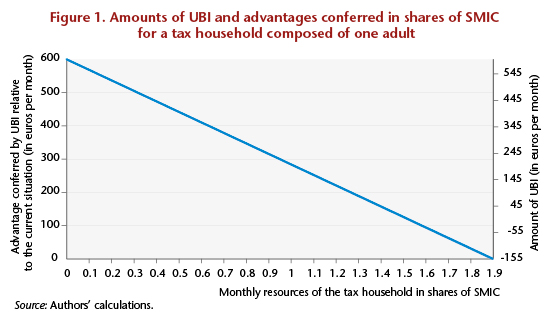
The latest version of the first step in the Universal Basic Income can be summarized as follows: “A basic income corresponds to a rise in net income that starts at 600 euros for people without resources and then disappears at 1.9 times the minimum wage (SMIC).”

Put like this, the proposal is for a differential allocation making it possible not to give rise to an artificial tax increase among those whose income situation is not changed by the universal income.

For married couples, the programme is not automatically individualized since it would still be possible to choose to maintain joint taxation. Couples with a family quotient that is less than the potential amount of the UBI should choose individualization. This is the case for couples with low incomes and not much income differential. Conversely, couples for whom the family quotient provides a bigger advantage than the basic income should choose to stick with joint taxation[1]. This would be the case for couples in which one of the individuals has a very high income and the other has no income[2].

For the most modest households the UBI replaces the RSA (income supplement for the working poor) and the Prime d’activité (working tax credit), and the calculation of social benefits (housing and family allowances, disabled adult allowance, scholarships, etc.) is not modified, as their amounts are included in the resources used to calculate the universal income.

In the general framework, for all tax households whose gross resources are less than 1.9 times the SMIC, i.e. 2,800 euros gross per month, the UBI is equal to the difference between the base amount of 600 euros per month (7,200 euros per year) and 27.4% of the tax household’s gross resources. For non-taxable households, the UBI is considered a tax on negative income. For taxable households with gross resources of between 1.5 and 1.9 times the SMIC (3.8 SMIC in the case of a married couple), the UBI reduces the income tax due, thereby increasing the household’s disposable income, with this additional income cancelling out at 1.9 SMIC. The measure’s cost to the public finances for these households therefore corresponds to the difference between the amount of the UBI and the income tax currently paid. For tax households with gross resources of more than 1.9 times the gross SMIC (3.8 SMIC for married couples), the current system applies and there is no gain (Figure 1).

Formally, the monthly amount of UBI received by a tax household composed of a single adult and with resources of less than 1.9 times the gross SMIC is based on the following formula:

UBI = 600 – 0.274 x GR

GR, gross resources, corresponds to the gross taxable income, as defined in the tax code, of the tax household, increased by a factor of 1.33 used to approximate the conversion between taxable income and gross resources including charges and contributions, the tax base for the calculation of the UBI. In the case of a married couple, the UBI is calculated as follows, since the UBI as proposed is not then individualized:

UBI = [600 – 0.274 x GR/2] x 2

In order to measure the measure’s redistributive impact, we have drawn on the micro-simulation model of the DREES and INSEE known as INES ([3] see the box). As the last operational version of the model dates from 2015, the results presented must be interpreted In line with the legislation of 2015. In fact, measures such as the Prime d’activité credit, introduced in 2016, are not taken into account, in contrast to the Prime pour l’emploi in-work tax credit (PPE).
RUE

As of January 2018, people over age 18 who are still reported in their parents’ tax household and who are UBI eligible must leave their parents’ tax household in order to benefit from the UBI. It should be noted that this case is not dealt with in our evaluation, given the complexity of taking into account transfers between parents and children when they are not in the same tax household. We will therefore focus on households in which the reference person was aged between 18 and 64, i.e. 20 million households out of the 28.3 million total households in France, as the rest, pensioners, are not eligible for the measure.

The UBI has been modelled as an additional line in the calculation of income tax, with the amount of UBI being subtracted, subject to conditions of age, resources and marital status explained above, from the latter.

Subject to these assumptions, the UBI should benefit 11.6 million households in which the reference person is aged 18 to 64, at a gross cost of around 51 billion euros, i.e. an average of 4,400 euros per year and per beneficiary household.

The gross cost is not the cost to the public purse. Indeed, the implementation of the UBI would de facto lead to the elimination of the base RSA income supplement and the Prime d’activité tax credit from the tax-benefit system. In 2016, these two programmes had a fiscal cost of close to 15 billion euros (10 billion euros for the RSA and 5 billion for the Prime d’activité). Moreover, the interactions between universal income and these other social benefits are not yet completely set out in Benoît Hamon’s proposal[4]. If the amount received from UBI were to be taken into account for the calculation of the other social benefits, the amounts paid for these would fall significantly. The gross cost of universal income would remain unchanged, but savings could be realized on social benefits.

We assume here that the amount received in social benefits by the household is taken into account for the final calculation. In other words, we subtract from the amount of UBI received by the household 27.4% of the total amount of social benefits received in cash (housing and family allowance, scholarships, disabled adult allowance, etc., i.e. 32 billion euros per year for potential UBI beneficiaries). While including the benefits in the calculation of the amount of UBI is complicated by the structure of the microsimulation model, it is possible to estimate the reduction in the overall amount of UBI paid by taking into account total social benefits, about 6 billion euros.

If this option is chosen – which we assume in the absence of further clarification – UBI’s “net” cost, excluding the 18-25 year-olds fiscally reporting under their parents, would be on the order of 30 billion euros, which is close to the amount declared by the candidate, to which, once again, it will be necessary to add the amount owed to individuals between the ages of 18 and 24 who are currently reported fiscally by their parents. In 2015, of the 5.2 million individuals aged 18 to 24, 1.7 million were fiscally independent of their parents. The additional gross cost if no 18-24 year-olds were included on their parents’ tax statements would therefore be on the order of 25 billion euros, from which should be subtracted 27.4% of the scholarships (0.115 billion euros per year) and housing benefits paid (1.4 billion euros per year), as well as the tax benefits currently enjoyed by the parents of the said individuals (benefit of up to 1,500 euros per year and per child, to a maximum of 5.2 billion if all households are at the ceiling).

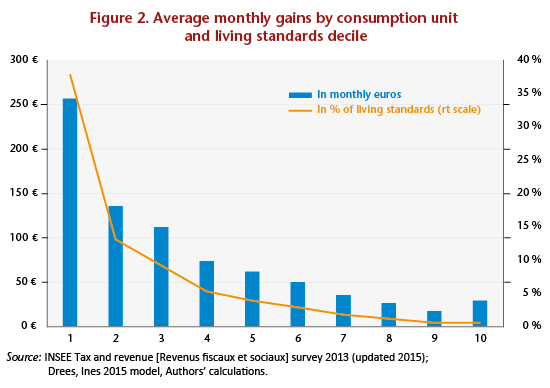
The measure, which is targeted at low-income households and not funded by an increase in household taxation or a decrease in social benefits, would have a positive impact on the bottom of the distribution of living standards (Figure 2) [5].

On average, households in the first decile of living standards should see their standard of living rise by 257 euros per month per consumption unit, i.e. a 38% increase in their average standard of living. The gain for households in the second decile should be roughly half as much, i.e. 137 euros per month per consumption unit, which represents a 13% increase in their average standard of living.
gra 2

Given that, unlike many benefits, the UBI is allocated not to households but to tax households, some members (not taxed jointly but cohabiting as unmarried couples not in PACS civil partnerships) of some households in the upper deciles of the distribution of living standards should receive the UBI (and the highest decile more than the ninth decile due to a composition effect). In other words, there are tax households with low gross incomes among households with high living standards[6].

Based on these assumptions, the median standard of living would be raised by 3.6%, and the poverty rate, i.e. the share of French households with resources under 60% of the median level, i.e. about 1,000 euros / month / consumption unit, would come to 8.5%, versus 13.4% at present. The median standard of living of the poorest households – those with a standard of living below the poverty line – would rise by 11%. The intensity of poverty, measured as the relative gap between the median standard of living of the poor and the poverty line, would also fall by a third, from 17% today to 11%.

Finally, the Gini coefficient of living standards, an indicator of inequality, would be reduced by 0.04 to a level of 0.26, thus moving France from a median situation in terms of the Gini at the European level to being among the least unequal countries – the European median of the Gini in 2015 was 0.30 (and the lowest 0.25).

Excluding the young people (aged 18-24) reported on their parents’ taxes, the net cost of the UBI would be on the order of 30 billion euros. By adding them, subject to a more detailed assessment, the net cost would be on the order of 49 billion. This is a long way from the 400 billion once bandied about, but it is still not negligible[7]. If the UBI were to be financed by a reform of personal taxation, this would lead to a considerable increase in the marginal rates of the highest deciles of the income distribution. Note that personal income tax brings in 74 billion euros annually. Another tax base, such as wealth, could also be used, but this would lead to a significant hike in wealth taxes. Property taxes and the ISF wealth tax currently bring in a little less than 30 billion euros. Moreover, the redistributive effects of the UBI – which are significant, in our assessment – would be amplified by an increase in taxation that is already progressive.

_________________________________________________________________________

Box:  The Ines micro-simulation model (Sources: INSEE, DREES)

Ines is the acronym for “Insee-Drees”, the two organizations that are jointly developing the model. The model is based on the INSEE’s Tax and Social Revenue surveys (ERFS), which include several hundred details on each individual and accurate and reliable data on income taken from tax returns. It can be used to simulate all recent legislative years using more recent ERFS years.

The model is used to carry out studies at annual intervals, but it is also used for in-depth studies in order to inform the economic and social debate in the areas of monetary redistribution, taxation and social protection. Finally, it is sometimes used to aid reflection in response to specific requests from various high government councils, supervisory ministries or control bodies (IGF financial inspectorate, Court of Auditors [Cour des comptes], Igas social inspectorate).

The Ines model simulates:

— Social charges and direct taxes: social contributions, CSG wealth tax, CRDS debt contribution and income tax (including the Prime pour l’emploi credit);

— Social benefits other than those corresponding to replacement income: personal aid for housing; the main social minima: the Revenu de solidarité active (RSA) income supplement; the Disabled adult allowance (AAH) and its complements; pension supplements and the Supplementary disability allowance (ASI); family benefits: the Family allowance (AF), the Family complement, the Back-to-school allowance (ARS) and high school scholarships, the Young child benefit (Paje) and its complements (Free choice of activity complement – CLCA – and Free choice of childcare complement – CMG), public subsidies for childcare in collective and family kindergartens, the Family support allowance (ASF) and the Disabled child education allowance (AEEH); and the Prime d’activité credit.

The main omissions relate to local taxes and subsidies (property tax, for example) and the Solidarity tax on wealth (IS). Retirement pensions, unemployment benefits and housing tax are not simulated but are presented in the data. Indirect levies are strictly speaking also outside the scope of the Ines model. The model simulates, using ranges, the different benefits to which each household is entitled and the taxes and levies that it has to pay. Ines draws on the INSEE’s Tax and Social Revenue surveys (ERFS), which bring together socio-demographic information from the Employment Survey, administrative information from the CNAF, the CNAV and the CCMSA, and details of the income reported to the tax authorities for the calculation of income tax.

Ines is a so-called “static” model: it does not take into account any changes in household behaviour, for example in terms of birth rates or labour market participation, which could be induced by changes in tax-benefit law. Since 1996, the model has been updated annually during the summer in order to simulate the most recent legislation and cover the preceding year. For example, in the summer of 2016, Ines was updated to simulate the legislation for 2015. Based on these updates, the INSEE and DREES teams contribute annually to the INSEE’s Social Portrait, in which they analyse the redistributive balance sheet for the tax and benefit measures enacted during the preceding year. The latest publication is entitled “Tax and benefit reforms in 2015 are leading to a slight redistribution from the richest 30% to the rest of the population” (André, Biotteau, Cazenave, Fontaine, Sicsic, Sireyjol).

______________________________________________________________


[1] Recall that the family quotient gives entitlement to a maximum tax reduction of 30,000 euros per year. The abolition of the family quotient would yield 5.5 billion euros (HCF, 2011) but would cost all the UBI paid to partners with a lower income who have chosen individualization.

[2] We have chosen not to take into account these tax optimization mechanisms within households, but it is understood that this means the evaluation proposed for the cost of the measure is underestimated.

[3] The source code and documentation for the INES micro-simulation model was opened to the public in June 2016 (https://adullact.net/projects/ines-libre). We have been using the 2015 open access version since 1 October 2016.

[4] In particular, the use of a micro-simulation model such as INES makes it possible to explore the consequences of different choices that can be made about the situation of the persons covered, the net redistribution effected and what has to be financed. A change in the rules for allocating or calculating a social benefit can have significant impacts on the net cost and the redistributive effects.

[5] The proposed measure significantly alters the distribution of living standards. Due to this, some households see their membership in a decile of living standards change positively or negatively. The deciles are maintained here at their pre-reform level.

[6] By way of illustration, the average age of the reference persons in households in the upper decile of the standard of living benefiting from the UBI is over 55. It can thus be assumed that these households are home to young adults who are fiscally independent but have few resources.

[7] The evaluation presented here is called “static”. It therefore does not take into consideration any possible changes in individual behaviour with respect to employment due to the impact of this measure.


France’s battered growth

By the Analysis and Forecasting Department

This text summarizes the 2016-2017 forecast for the French economy. Click here to consult the full version, in French.

The news on 28 October that French economic growth came to 0.2% in the third quarter of 2016 constitutes a cyclical signal that is consistent with our analysis of the state of France’s economy. This figure is close to our latest forecast (+0.3% forecast for the third quarter) and in line with our growth scenario up to 2018.

After three years of sluggish growth (0.5% on average over the period 2012-14), activity picked up moderately in France in 2015 (1.2%), driven by falling oil prices, the depreciation of the euro and a lowered level of fiscal consolidation. For the first time since 2011, the French economy has begun to create jobs in the private sector (98,000 for the year as a whole), which has been encouraged by tax measures that cut labour costs. Combined with an increase in the number of employees in the public sector (+49,000) and the creation of non-salaried jobs (+56,000), the number of unemployed according to the ILO fell in 2015 (-63,000, or -0.2 percentage point of the active population). Meanwhile, boosted by additional tax cuts on industrial equipment, business investment has revived in 2015 (+3.9% yoy).

French growth has been below that of the rest of the euro zone since 2014; in addition to the fact that it did better over the period 2008-2013, this is due to two major factors: first, France made greater fiscal adjustments than its European neighbours over the period 2014-16, and second, exports did not contribute much to growth, even though the fiscal approach to supply policy aimed to restore the competitiveness of French business. It seems, however, that since 2015 French exporters have chosen to improve their margins rather than to reduce their export prices, with no impact on their export volumes. While for a number of quarters now this behaviour has resulted in falling market share, this might still turn out to be an asset in the longer term due to strengthening the financial position of the country’s exporters, especially if these margins are reinvested in non-cost competitiveness and lead to upgrading the products manufactured in France.

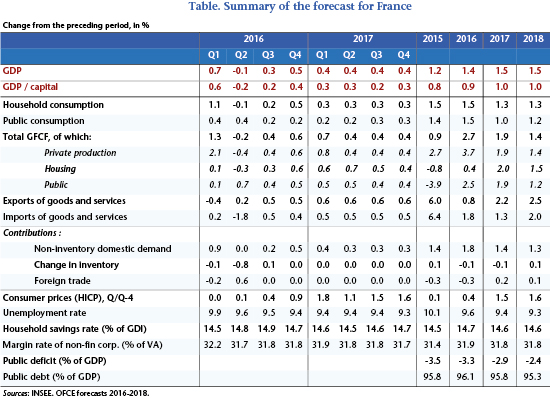
In 2016, despite a strong first quarter (+0.7%) driven by exceptionally strong domestic demand excluding stock (+0.9%), GDP growth will peak at 1.4% on average over the year (see table). The mid-year air pocket, which was marked by strikes, floods, terrorist attacks and the originally scheduled end of the investment tax reduction, partly explains the weak recovery in 2016. As a result of the pick-up in margin rates, the historically low cost of capital and the extension of the investment tax cut, investment should continue to grow in 2016 (+2.7% yoy). The creation of private sector jobs should be relatively dynamic (+149,000), due to support from the CICE competitiveness tax credit, the Responsibility Pact and the prime à l’embauche hiring bonus. In total, taking into account unwaged employees and the workforce in the public sector, 219,000 jobs will be created in 2016. The unemployment rate will fall by 0.5 point over the year, of which 0.1 point is linked to the implementation of the “training 500,000” programme, so at year end will come to 9.4% of the workforce. Meanwhile the public deficit will drop to 3.3% of GDP in 2016, after a level of 3.5% in 2015 and 4% in 2014.

In 2017, France’s economy will grow at a 1.5% rate, which will be slightly above its potential rate (1.3%), as the country’s fiscal policy will not hold down GDP for the first time in seven years. On the other hand, in contrast to the forecast last spring, France will have to confront two new shocks: the negative impact of Brexit on foreign trade and the terrorist attacks’ influence on the number of tourists. These two shocks will cut 0.2 percentage point off GDP growth in 2017 (following 0.1 point in 2016). The French economy will create 180,000 jobs, including 145,000 in the private sector, reducing the unemployment rate by “only” 0.1 point, due to the rebound in the labour force as people who benefit from the training programme gradually re-join the workforce. The renewed rise in oil prices and the depreciation of the euro will see inflation rising to 1.5% in 2017 (after 0.4% in 2016). Finally, the government deficit will be 2.9% of GDP in 2017, back below the 3% threshold for the first time in ten years. After stabilizing at 96.1% of GDP in 2015 and 2016, the public debt will fall slightly, down to 95.8% in 2017.

The French economy though battered by new shocks and with the wounds from the crisis far from having healed, is recovering gradually, as can be seen by the gradual improvement in economic agents’ financial position: business margins are up, household purchasing power has rebounded, the deficit is down and the public debt has stabilized.

france


François Hollande’s five years in office: Stagnation or recovery?

By OFCE

The five-year term of French President Francois Hollande has been marked by serious economic difficulties, but also by some signs of improvement in the last year of his mandate. Overall, France experienced low growth from 2012 to 2014, mainly due to the fiscal consolidation policy, with moderate growth after that (see: OFCE, Policy Brief, no2, September 5th, 2016).

The scale of the fiscal shock at the start of Hollande’s mandate, when the government underestimated the negative impact on growth, proved to be incompatible with a fall in unemployment during the first half of the mandate.

The effort to improve France’s public finances involved a major fiscal adjustment, even though the target of a 3% public deficit was put off till the end of Hollande’s term in office. According to the calculations of the European Commission, France’s structural balance (i.e. the balance adjusted for cyclical effects) will have improved by 2.5 points over the 2012-2016 period. This effort did not however prevent the public debt from reaching a historic peak and from diverging significantly from the level in Germany.

Fiscal consolidation in France and in Europe had a marked negative impact, amounting to 0.8 point per year on average between 2012 and 2017. The simultaneity of the austerity policies enacted in Europe amplified their recessionary impact by depressing domestic demand, but also external demand.

The economic policy of the governments led by Ayrault and Valls was initially marked by a significant period of rising taxation, on both companies and households, followed by a shift towards a supply policy in 2014. This policy, embodied in the Responsibility Pact and the CICE tax credit, is bearing fruit late in Hollande’s term, as business margins improve, although household purchasing power and short-term growth have been hurt.

After a period marked by a significant downturn in business margins, they picked up over the first four years of the five-year term by the equivalent of 1 point in added value thanks to tax measures, and one additional point due to lower oil prices. The profit margin in industry even reached a level comparable to the historical records of the early 2000s.

Based on our forecasts for the five-year mandate as a whole, ILO-measured unemployment will have increased by about 100,000 people, despite the creation of 720,000 jobs, due to the lack of growth, combined with an increase in the labour force.


Unemployment: beyond the (good) figures from France’s job centre

Analysis and Forecasting Department (France team)

The 60,000 person decline in March for the number of people registered in Category A at France’s Pôle emploi job centre is exceptional. One has to go back to September 2000 to find a fall of this magnitude. There is some natural volatility in the monthly statistics for job seekers, but the fact remains that the trajectory has changed noticeably. In the last year, the number registered in Category A at the job centre rose by 17,000. A year earlier, from March 2014 to March 2015, the increase was 164,000. Better yet, over the last six months the number registered fell by 19,000.

Nevertheless, the number of Category A job seekers is a relatively poor reflection of the multiple dynamics at work in the labour market. If, in addition to job seekers registered in Category A, we add those working reduced hours (categories B and C), the March upturn remains visible, but smaller. The number registered in categories A-B-C falls slightly in March (8700 people) but also over 3 months (down 23,900).

Once again, however, beyond the good results in March, given the continuing deterioration of the labour market and the emergence of more precarious situations with regard to employment over the last eight years, there will be no lasting improvement in households’ job situation until these “good figures” have accumulated over a medium-term horizon.

More relevant statistical sources …

These monthly figures provide only a partial representation of unemployment. They omit in particular people seeking employment who are not registered at the job agency. As for those registered in Category A, people are also counted who are not performing a real job search because they are close to retirement (see The elimination of the job search exemption: When governments voluntarily increase the jobless count!in French). In addition, the figures released by the job centre can be distorted by changes in administrative practices and by occasional technical problems that affect the management of the job centre’s files.

The quarterly figures provided by the INSEE are a more reliable source for the analysis of unemployment. According to the employment survey, a person is considered “unemployed within the meaning of the International Labour Office (ILO)” if he or she meets the following three conditions:

  • being unemployed, that is to say, not having worked at least one hour during the reference week of the survey;
  • being available to take a job within 15 days;
  • having actively sought work in the month preceding the survey or having found a job that begins within three months.

Based on these criteria, the unemployment rate in metropolitan France in the fourth quarter of 2015 stood at 10% of the active population (+871,000 people since Q4 2007).

…that help to better measure the precarity of the labour market

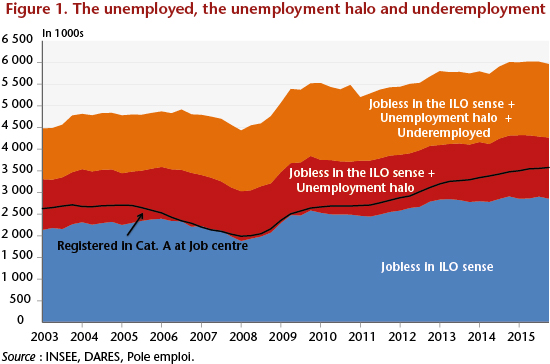
But this definition is still restrictive. It still fails to take into account situations at the margins of unemployment. Thus people who want to work but are considered inactive in the ILO sense, either because they are not readily available for work (within two weeks) or because they are not actively seeking a job, form what is called the unemployment “halo”. In the fourth quarter, this halo included 1.41 million people (+25% over the fourth quarter of 2007, i.e. an additional 279,000 people).

Similarly, the strict ILO definition does not include people who are working part-time but want to work more, or people who are in a situation of partial unemployment. In the fourth quarter of 2015, these situations of “underemployment” involved 1.7 million people (up 18% compared to the fourth quarter of 2007, i.e. by 254,000).

In total, by incorporating underemployment and the “halo” into the strict definition of ILO-measured unemployment, 5.9 million people are in a weakened position with regard to employment, 31% more than eight years ago, i.e. 18.8% of the workforce broadly speaking (Figure 1) [1].

G1_Post2604_anglais

Multiform unemployment, with a transforming labour market

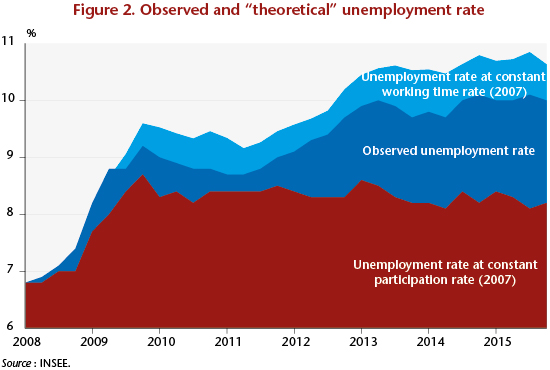
The analysis of the unemployment rate does not therefore include all the dynamics at play in the labour market. The increase in the number of people experiencing underemployment is partly explained by adjustments in the effective working time, via the policy on partial unemployment, the reduction of overtime and the use of working-time accounts, but also through the expansion of part-time work, including on an involuntary basis. While these adjustments increased underemployment, they also helped slow the rise in unemployment (in the strict sense) that started in mid-2008. Without these adjustments, in other words, if the hours worked had remained stable between 2007 and 2015, the ILO-based unemployment rate in France would have been 0.6 points higher in the fourth quarter of 2015 (Figure 2).

Along with these adjustments in working time, since the beginning of the crisis France has also experienced greater growth in the labour force (employed + unemployed) than in its overall population. This is attributable partly to the implementation of pension reforms that delay seniors’ exit from the workforce. Mechanically, without the creation of new jobs, this growth in the labour force has had the effect of pushing up the unemployment rate. In the case of France, the impact has been massive. Indeed, if the participation rate had remained at its 2007 level, the unemployment rate in France would be, all else being equal, 8.2%, i.e. 1.6 points lower than the unemployment rate observed in the fourth quarter of 2015.

G2_Post2604ang

It must nevertheless be noted that while these adjustments are important, the developments on which they are based are not fully due to the crisis. Indeed, there has been a tendency for working time to decrease since 1990. Between 1990 and 2002, the effective working time decreased on average by 0.9% per year. While this decline has certainly been less rapid since 2003, it is continuing (-0.2% per year). At the same time, the participation rate has been rising continuously, due to the combined effects of the increase in women’s participation in the labour market and the successive reforms of the pension system. The participation rate in France, which stood at 67.1% in 1990, reached 69.7% in 2007, and in the fourth quarter of 2015 had risen to 71.5%.