The impact on redistribution of the ECB’s monetary policy

By Jérôme Creel and Mehdi El Herradi

A few weeks before Christine Lagarde assumes the
presidency of the European Central Bank (ECB), it may be useful to examine the
balance sheet of her predecessors, not only on macroeconomic and financial
matters but also with respect to inequality. In recent years, the problem of
the redistributive effects of monetary policy has become an important issue,
both academically and at the level of economic policy discussions.

Interest in this subject has grown in a context
marked by the conjunction of two factors. First there has been a persistent
level of inequality in wealth and income
, which has been hard to reduce. Then there are the activities
of the central banks in the advanced economies following the 2008 crisis to
support growth, particularly through the implementation of so-called “unconventional”
measures [1]. These measures, mainly manifested in quantitative
easing (QE) programmes, are suspected to have increased the prices of financial
assets and, as a result, favoured wealthier households. At the same time, the
low interest rate policy could have resulted in a reduction in interest income
on assets with fixed yields, most of which are held by low-income households. On
the other hand, the real effects of monetary policy, particularly on changes in
the unemployment rate, could help keep low-income households in employment. The
ensuing debate, which initially broke out in the United States, also erupted at
the level of the euro
zone
after the ECB launched
its QE programme.

In a recent
study
focusing on 10 euro zone
countries between 2000 and 2015, we analysed the impact of the ECB’s monetary
policy measures – both conventional and unconventional – on income inequality. To
do this, we drew on three key indicators: the Gini coefficient, both before and
after redistribution, and an interdecile ratio (the ratio between the richest
20% and the poorest 20%).

Three main results emerge from our study. On the
one hand, a restrictive monetary policy has a modest impact on income
inequality, regardless of the indicator of inequality used. On the other hand,
this effect is mainly due to the southern European countries, especially in the
period of conventional monetary policy. Finally, we found that the
redistributive effects of conventional and unconventional monetary policies do
not differ significantly.

These results thus suggest that the monetary
policies pursued by the ECB since the crisis have probably had an insignificant
and possibly even favourable impact on income inequality. The forthcoming
normalization of the euro zone’s monetary policy could, on the contrary,
increase inequality. Although this increase may be limited, it is important
that decision-makers anticipate it.


[1] For an analysis of the expected impact of the
ECB’s unconventional policies, see Blot et al. (2015).


The euro is 20 – time to grow up

By Jérôme Creel and Francesco Saraceno [1]

At age twenty, the euro has gone through a difficult adolescence. The success of the euro has not been aided by a series of problems: growing divergences; austerity policies with their real costs; the refusal in the centre to adopt expansionary policies to accompany austerity in the periphery countries, which would have minimized austerity’s negative impact, while supporting activity in the euro zone as a whole; and finally, the belated recognition of the need for intervention through a quantitative easing monetary policy that was adopted much later in Europe than in other major countries; and a fiscal stimulus, the Juncker plan, that was too little, too late.

Furthermore, the problems facing the euro zone go beyond managing the crisis. The euro zone has been growing more slowly than the United States since at least 1992, the year the Maastricht Treaty was adopted. This is due in particular to the inertia of economic policy, which has its roots in the euro’s institutional framework: a very limited and restrictive mandate for the European Central Bank, along with fiscal rules in the Stability and Growth Pact, and then in the 2012 Fiscal Compact, which leave insufficient room for stimulus policies. In fact, Europe’s institutions and the policies adopted before and during the crisis are loaded down with the consensus that emerged in the late 1980s in macroeconomics which, under the assumption of efficient markets, advocated a “by the rules” economic policy that had a necessarily limited role. The management of the crisis, with its fiscal stimulus packages and increased central bank activism, posed a real challenge to this consensus, to such an extent that the economists who were supporting it are now questioning the direction that the discipline should take. Unfortunately, this questioning has only marginally and belatedly affected Europe’s decision-makers.

On the contrary, we continue to hear a discourse that is meant to be reassuring, i.e. while it is true that, following the combination of austerity policies and structural reforms, some countries, such as Greece and Italy, have not even regained their pre-2008 level of GDP, this bitter potion was needed to ensure that they emerge from the crisis more competitive. This discourse is not convincing. Recent literature shows that deep recessions have a negative impact on potential income, with the conclusion that austerity in a period of crisis can have long-term negative effects. A glance at the World Economic Forum competitiveness index, as imperfect as it is, nevertheless shows that none of the countries that enacted austerity and reforms during the crisis saw its ranking improve. The conditional austerity imposed on the countries of the periphery was doubly harmful, in both the long and short terms.

In sum, a look at the policies carried out in the euro zone leads to an irrevocable judgment on the euro and on European integration. Has the time come to concede that the Exiters and populists are right? Should we prepare to manage European disintegration so as to minimize the damage?

There are several reasons why we don’t accept this. First, we do not have a counterfactual analysis. While it is true that the policies implemented during the crisis have been calamitous, how certain can we be that Greece or Italy would have done better outside the euro zone? And can we say unhesitatingly that these countries would not have pursued free market policies anyway? Are we sure, in short, that Europe’s leaders would have all adopted pragmatic economic policies if the euro had not existed? Second, as the result of two years of Brexit negotiations shows, the process of disintegration is anything but a stroll in the park. A country’s departure from the euro zone would not be merely a Brexit, with the attendant uncertainties about commercial, financial and fiscal relations between a ​​27 member zone and a departing country, but rather a major shock to all the European Union members. It is difficult to imagine the exit of one or two euro zone countries without the complete breakup of the zone; we would then witness an intra-European trade war and a race for a competitive devaluation that would leave every country a loser, to the benefit of the rest of the world. The costs of this kind of economic disorganization and the multiplication of uncoordinated policies would also hamper the development of a socially and environmentally sustainable European policy, as the European Union is the only level commensurate with a credible and ambitious policy in this domain.

To say that abandoning the euro would be complicated and/or costly, is not, however, a solid argument in its favour. There is a stronger argument, one based on the rejection of the equation “euro = neoliberal policies”. Admittedly, the policies pursued so far all fall within a neoliberal doctrinal framework. And the institutions for the European Union’s economic governance are also of course designed to be consistent with this doctrinal framework. But the past does not constrain the present, nor the future. Even within the current institutional framework, different policies are possible, as shown by the (belated) activism of the ECB, as well as the exploitation of the flexibility of the Stability and Growth Pact. Moreover, institutions are not immutable. In 2012, six months sufficed to introduce a new fiscal treaty. It headed in the wrong direction, but its approval is proof that reform is possible. We have worked, and we are not alone, on two possible paths for reform, a dual mandate for the ECB, and a golden rule for public finances. But other possibilities could be mentioned, such as a European unemployment insurance, a European budget for managing the business cycle, or modification of the European fiscal rules. On this last point, the proposals are proliferating, including for a rule on expenditures by fourteen Franco-German economists, or the replacement of the 3% rule by a coordination mechanism between the euro zone members. Reasonable proposals are not lacking. What is lacking is the political will to implement them, as is shown by the slowness and low ambitions (especially about the euro zone budget) of the decisions taken at the euro zone summit on 14 December 2018.

The various reforms that we have just mentioned, and there are others, indicate that a change of course is possible. While some policymakers in Europe have shown stubborn persistence, almost tantamount to bad faith, we remain convinced that neither European integration nor the euro is inevitably linked to the policies pursued so far.


[1] This post is an updated and revised version of the article “Le maintien de l’euro n’est pas synonyme de politiques néolibérales” [Maintaining the euro is not synonymous with neoliberal policy], which appeared in Le Monde on 8 April 2017.


What can be deduced from the figures on inflation?

By Eric Heyer

In May, inflation in the euro area moved closer to the ECB target. The sharp rise in inflation, from 1.2% to 1.9% per annum in the space of one month, did not nevertheless provoke a reaction, since the main reason for it was well known and common to all the countries: the surge in oil prices. After having plummeted to 30 dollars a barrel at the beginning of 2016, the price per barrel now stands at around 77 dollars, the highest level since 2014. Even after adjusting for the exchange rate – the euro has appreciated against the dollar – the price of a barrel has increased by almost 40% (18 euros) over the last 12 months, directly causing prices in the net oil importing countries to rise at an accelerating pace. In addition to this common effect, for France the impact of the hike in indirect taxes on tobacco and fuels, which came into force at the beginning of the year, will, according to our estimates, add 0.4 point to the price index.

At the same time, the underlying inflation (or core inflation) index, excluding products with volatile prices (such as oil and fresh produce) as well as prices subject to state intervention (electricity, gas, tobacco, etc.), is still not picking up pace and is staying below 1%. The second-round effect of an oil shock, which passes through a rise in wages, does not seem to be very significant, since consumers are absorbing most of the shock by reducing their purchasing power. This explains part of the observed slowdown in household consumption at the beginning of the year as well as the general lack of reaction of the monetary authorities to the announcement of the inflation figures.

There remains the question of the weakness of trend inflation and its link with the state of the economy. Have we already caught up with the output gap that arose since the Great Depression of 2008 (an output gap of close to zero), or are there still production capacities that can be mobilized in the event of additional demand (positive output gap)? In the first case, this would mean that the link between growth and inflation has been significantly broken; in the second case, this would indicate that the low level of inflation is not surprising and that the normalization of monetary policy needs to be gradual.

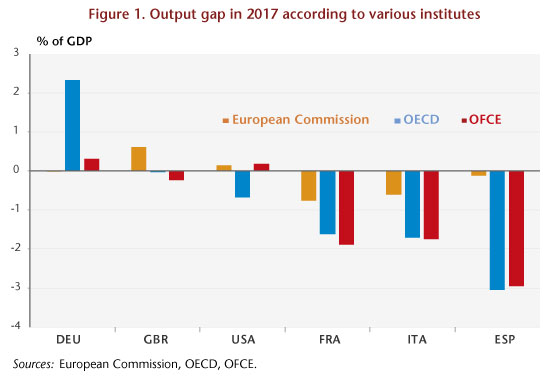
In 2017, even though the process of recovery was consolidating and spreading, most developed economies were still lagging behind their pre-crisis trajectory. Only a few seem to have already overcome the lag in growth. Thus, two categories of countries seem to be emerging: the first – in particular Germany, the United States and the United Kingdom – includes countries that have caught up with their potential level of production and are at the top of the cycle; the second – which includes France, Italy and Spain, for example – includes countries that are still experiencing a lag in production which, according to the economic analysis institutes, lies between 1 and 2 points of GDP for France and Italy and 3 points of GDP for Spain (Figure 1).

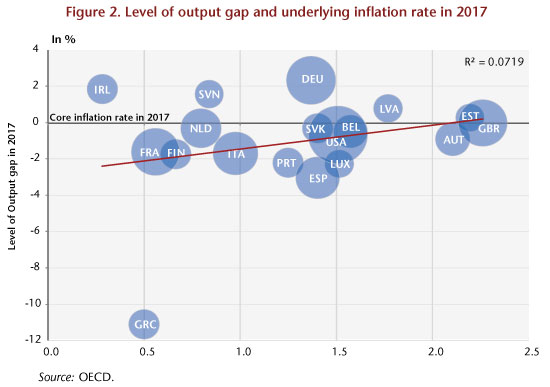
IMG1_post05-06_ENGThe presence of developed countries in both categories should logically result in the appearance of inflationary pressures in the countries listed in the first group and an inflation gap in those in the latter. However, these two phenomena were not apparent in 2017: as shown in Figure 2, the link between the level of the output gap and the underlying inflation rate is far from clear, casting doubt on the interpretation to be made with respect to the level of the output gap: to uncertainties relating to this notion is added that associated with the level of this gap in the past, in 2007 for example.

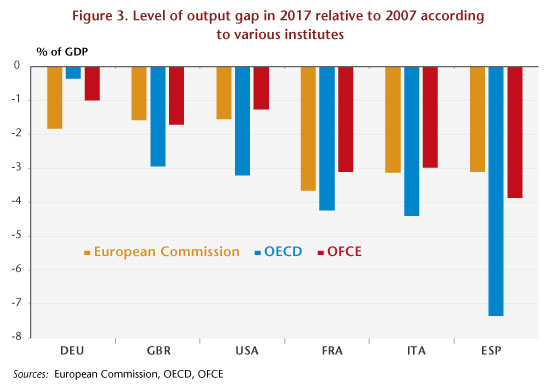
IMG2_post05-06_ENGGiven this high level of uncertainty, it seems appropriate to make a diagnosis based on how this output gap has varied since 2007. Such an analysis leads to a clearer consensus between the different institutes and to the disappearance of the first category of countries, those with no additional growth margin beyond their own potential growth. Indeed, according to these, in 2017 none of the major developed countries would have come back to its output gap level of 2007, including Germany. This gap would be around 1 GDP point for Germany, 2 GDP points for the United Kingdom and the United States, more than 3 GDP points for France and Italy and around 5 GDP points for Spain (Figure 3).

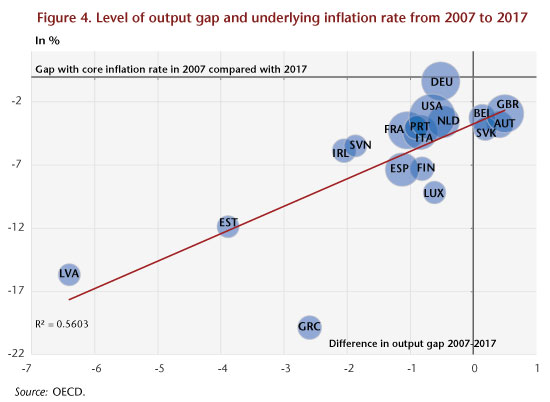
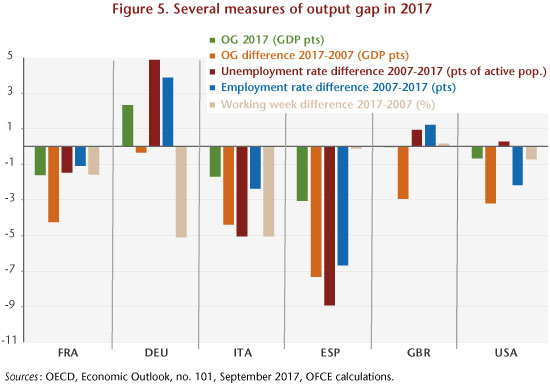
IMG3_post05-06_ENGThis analysis is more in line with the diagnosis of the renewal of inflation based on the concept of underlying inflation: the fact that the economies of the developed countries had not in 2017 recovered their cyclical level of 2007 explains that inflation rates were lower than those observed during the pre-crisis period (Figure 4). This finding is corroborated by an analysis based on criteria other than the output gap, notably the variation in the unemployment rate and the employment rate since the beginning of the crisis and in the rate of increase in working hours during this same period. Figure 5 illustrates these different criteria. On the basis of these latter criteria, the qualitative diagnosis of the cyclical situation of the different economies points to the existence of relatively high margins for a rebound in Spain, Italy and France. This rebound potential is low in Germany, the United States and the United Kingdom: only an increase in working time in the former or in the employment rate for the latter two could make this possible.

IMG4_post05-06_ENGIMG5_post05-06_ENG


Trump’s budget policy: Mortgaging the future?

By Christophe Blot

While the momentum for growth has lost steam in some countries – Germany, France and Japan in particular – GDP in the United States is continuing to rise at a steady pace. Growth could even pick up pace in the course of the year as a highly expansionary fiscal policy is implemented. In 2018 and 2019, the fiscal stimulus approved by the Trump administration – in December 2017 for the revenue component, and in February 2018 for the expenditure side – would amount to 2.9 GDP points. This level of fiscal impulse would come close to that implemented by Obama for 2008. However, Trump’s choice has been made in a very different context, since the unemployment rate in the United States fell back below the 4% mark in April 2018, whereas it was accelerating 10 years ago, peaking at 9.9% in 2009. The US economy should benefit from the stimulus, but at the cost of accumulating additional debt.

Donald Trump had made fiscal shock one of the central elements of his presidential campaign. Work was begun in this direction at the beginning of his mandate, and came to fruition in December 2017 with the passing of a major tax reform, the Tax Cuts and Jobs Act [1], which provided for a reduction in household income tax – in particular by reducing the maximum marginal income tax rate – and corporation tax, whose effective rate would fall from 21% to 9% by 2018 [2]. In addition to this initial stimulus, expenditure will also rise in accordance with the agreement reached with the Democrats in February 2018, which should lead to raising federal spending by USD 320 billion (1.7 GDP points) over two years. These choices will push up domestic demand through boosting household disposable income and corporate profitability, which should stimulate consumption and investment. The multiplier effect – which measures the impact on GDP of a one dollar increase in public spending or a one dollar cut in taxes – will nevertheless be relatively small (0.5) because of the US position in the cycle.

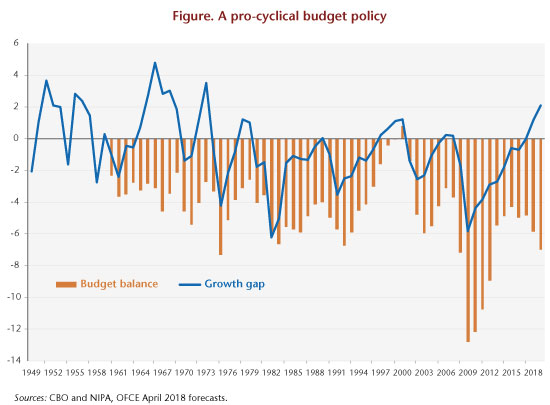
Moreover, the public deficit will expand sharply, to reach a historically high level outside a period of crisis or war (graph). It will come to 5.8% of GDP in 2018 and 7.0% in 2019, while the growth gap will become positive [3]. While the risk of overheating seems limited in the short term, the fact remains that the fiscal strategy being implemented could push the Federal Reserve to tighten monetary policy more quickly. However, an excessive rise in interest rates in a context of high public debt would provoke a snowball effect. Above all, by choosing to re-launch the economy in a favourable environment, the government risks being forced to make adjustments later when the economic situation deteriorates. This pro-cyclical stance in fiscal policy risks amplifying the cycle by accelerating growth today while taking the risk of accentuating a future slowdown. With a deficit of 7% in 2019, fiscal policy’s manoeuvring room will actually shrink.

IMG1_post28-05_ENG


[1] See the section on Budget policy: Crisis-free acceleration [“Politiques budgétaires : accélération sans crise”] in our April 2017 forecast for greater detail.

[2] See here for more on this.

[3] The growth gap expresses – as a % of potential GDP – the difference between observed GDP and potential GDP. Recall that potential GDP is not observed but estimated. The method of calculation used by the Congressional Budget Office (CBO) is explained here.


The ECB on neutral ground?

By Christophe Blot and Jérôme Creel

The involvement of the European Central Bank (ECB) in the fiscal management of the euro area member states has been a subject of ongoing controversy. Since the implementation of the ECB programme to purchase sovereign debt, it has been accused of profiting off of troubled states and taking the risk of socializing losses. The rise of these controversies results from the difficulty in understanding the relationship between the ECB, the national central banks (NCBs), and the governments. The European monetary architecture comes down to a sequence of delegations of power. Decisions on the conduct of monetary policy in the euro area are delegated to an independent institution, the European Central Bank (ECB). But, under the European subsidiarity principle, the implementation of monetary policy is then delegated to the national central banks (NCBs) of the euro area member states: the ECB and NCBs taken together are called the Eurosystem. While up to now this dimension of the organization of the euro area’s monetary policy has not attracted much attention, debate has recently arisen in the course of the implementation of the quantitative easing programme. According to commentators and journalists, some national central banks are profiting more than others from the policy of buying and supporting their national public debts, which are riskier than the debt in more “virtuous” countries[1]. The profiting banks are viewed as escaping the ECB’s control and not strictly applying the policy decided in Frankfurt.

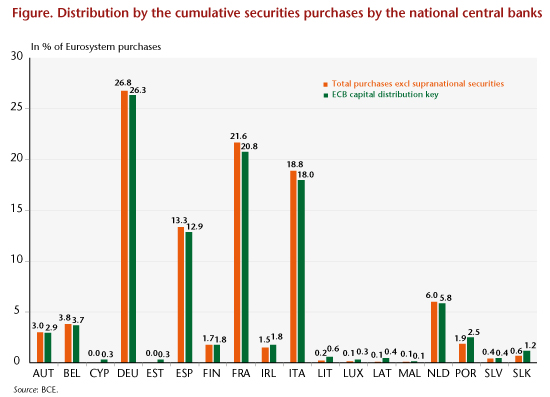
In a recent paper prepared as part of the European Parliament’s Monetary Dialogue with the ECB, we show that these concerns are unfounded for the simple good reason that, on average, since the beginning of the implementation of this policy, the theoretical distribution key has been respected (graphic). This distribution key stipulates that purchases of bonds by the Eurosystem are to be made pro rata to a state’s participation in the ECB’s capital. Remember that part of the purchases – 10 of the 60 billion in monthly purchases made under the programme – are made directly by the ECB[2]. The other purchases are made directly by the NCBs. As each central bank buys securities issued by its own government, the NCBs’ purchases of public bonds do not entail risk-sharing between member states. Any profits or losses are kept on the NCBs’ balance sheets or transferred to the national governments in accordance with the agreements in force in each country.

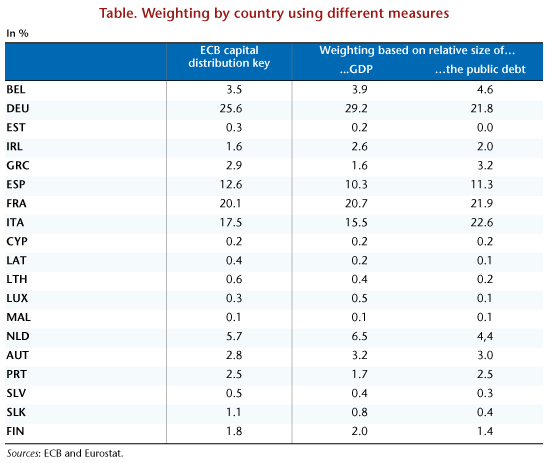
This distribution of public bond purchases, which is intended to be neutral in terms of risk management, isn’t entirely so, but not for the reasons that seem to have worried the European Parliament’s Committee on Economic and Monetary Affairs. This distribution favours the maintenance of very low rates of return on the debts of certain member states. In fact, by not basing itself on the financing needs of the member states or on the size of their public debts, it can produce distortions by reducing the supply of public bonds available on the secondary markets. Such may be the case in Germany, Spain and the Netherlands, whose shares of the European public debt are smaller than their respective shares in the ECB’s capital (table). Conversely, the purchases of Italian bonds are smaller with the current distribution key than they would be with a distribution key that took into account the relative size of the public debt. The ECB’s policy therefore has less impact on the Italian debt market than it does on the German market.

This orientation could also constrain the ECB’s decision about continuing quantitative easing beyond December 2017. Let’s agree that the ECB’s best policy would be to continue the current policy beyond December 2017, but to stop it once and for all in July 2018. Given the current distribution rules, this policy would be subject to all countries having exchangeable government bonds until July 2018, including those who issue public debt only rarely because they have low financing needs. It could be that it is impossible to continue this policy under the rules currently adopted by the ECB, because some countries do not have sufficient debt available. It would then be necessary to implement a different policy by drastically reducing the monthly purchases of short-term securities (say in January 2018), while possibly pursuing this policy for a longer time period (beyond the first half of 2018). The decision not to use risk-sharing in the management of European monetary policy is therefore far from being neutral in the way this policy is actually implemented.

graphique_post2510--ENG

Tab1_2510postENG


[1] Mario Draghi was questioned about the distribution of the public sector purchase programme (PSPP) at the press conference he held on 8 September 2017.

[2] There is risk-sharing on this sum: the gains or losses are shared by all the NCBs in proportion to their contribution to the ECB’s capital.


What factors are behind the recent rise in long-term interest rates?

By Christophe Blot, Jérôme Creel, Paul Hubert and Fabien Labondance

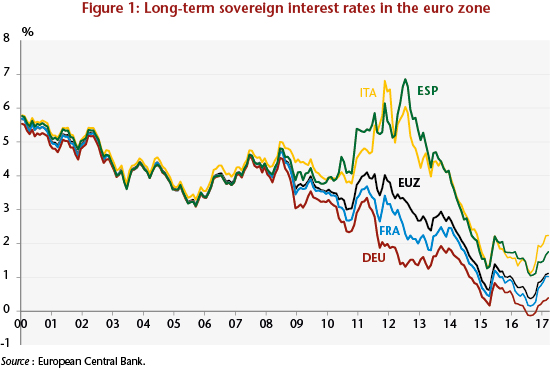
Since the onset of the financial crisis, long-term sovereign interest rates in the euro zone have undergone major fluctuations and periods of great divergence between the member states, in particular between 2010 and 2013 (Figure 1). Long-term rates began to fall sharply after July 2012 and Mario Draghi’s famous “whatever it takes”. Despite the implementation and expansion of the Public Sector Purchase Programme (PSPP) in 2015, and although long-term sovereign interest rates remain at historically low levels, they have recently risen.

graph 1

There may be several ways of interpreting this recent rise in long-term sovereign interest rates in the euro zone. Given the current economic and financial situation, it may be that this rise in long-term rates reflects the growth and expectations of rising future growth in the euro zone. Another factor could be that the euro zone bond markets are following the US markets: European rates could be rising as a result of rising US rates despite the divergences between the policy directions of the ECB and of the Fed. The impact of the Fed’s monetary policy on interest rates in the euro zone would thus be stronger than the impact of the ECB’s policy. It might also be possible that the recent rise is not in line with the zone’s fundamentals, which would then jeopardize the recovery from the crisis by making debt reduction more difficult, as public and private debt remains high.

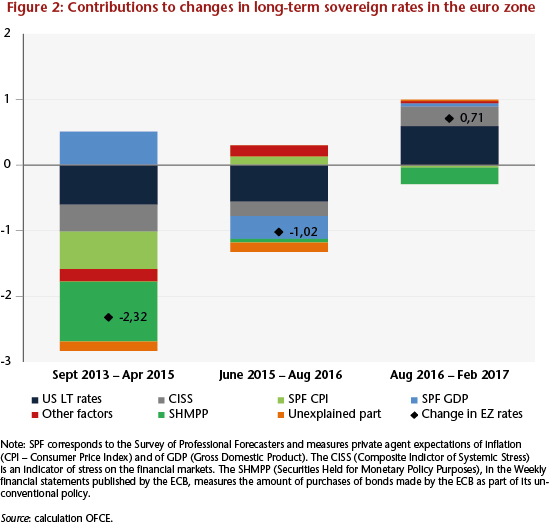
In a recent study, we calculate the contributions of the different determinants of long-term interest rates and highlight the most important ones. Long-term interest rates can respond to private expectations of growth and inflation, to economic fundamentals and to monetary and fiscal policy, both domestic (in the euro zone) and foreign (for example, in the United States). The rates may also react to perceptions of different financial, political and economic risks[1]. Figure 2 shows the main factors that are positively and negatively affecting long-term interest rates in the euro zone over three different periods.

Between September 2013 and April 2015, the euro zone’s long-term interest rate decreased by 2.3 percentage points. During this period, only expectations of GDP growth had a positive impact on interest rates, while all the other factors pushed rates down. In particular, the US long-term interest rate, inflation expectations, the reduction of sovereign risk and the ECB’s unconventional policies all contributed to the decline in euro zone interest rates. Between June 2015 and August 2016, the further decline of about 1 percentage point was due mainly to two factors: the long-term interest rate and the expectations of GDP growth in the United States.

Between August 2016 and February 2017, long-term interest rates rose by 0.7 percentage point. While the ECB’s asset purchase programme helped to reduce the interest rate, two factors combined to push it up. The first is the increase in long-term interest rates in the United States following the Fed’s tightening of monetary policy. The second factor concerned political tensions in France, Italy and Spain, which led to a perception of political risk and higher sovereign risk. While the first factor may continue to push up interest rates in the euro zone, the second should drive them down given the results of the French presidential elections.

graph 2


[1] The estimate of the equation for the determination of long-term rates was calculated over the period January 1999 – February 2017 and accounts for 96% of the change in long-term rates over the period. For details on the variables used and the parameters estimated, see the study.


Where are we at in the euro zone credit cycle?

By Christophe Blot and Paul Hubert

In December 2016, the European Central Bank announced the continuation of its Quantitative Easing (QE) policy until December 2017. The continuing economic recovery in the euro zone and the renewal of inflation are now raising questions about the risks associated with this programme. On the one hand, isn’t the pursuit of a highly expansionary monetary policy a source of financial instability? Conversely, a premature end to unconventional measures could undermine growth as well as the ECB’s capacity to achieve its objectives. Here, we study the dilemma facing the ECB [in French] based on an analysis of credit cycles and banking activity in the euro zone.

The ECB’s announcement gives us two signals about the direction of monetary policy. On the one hand, by delaying the end date of QE, the ECB is implicitly announcing that the normalization of monetary policy, in particular a hike in its key rate, will not take place before early 2018. The ECB will thus continue its expansionary policy of increasing the size of its balance sheet. On the other hand, the reduction in monthly purchases is also a sign that it is toning down its expansionary character. The announcement is similar to the “tapering” that began in January 2014 by the US Federal Reserve. Purchases of securities were cut back gradually, until they actually stopped at the end of October 2016.

The undeniably expansionary nature of monetary policy in the euro zone suggests that the ECB still considers it necessary to implement a stimulus in order to achieve its ultimate monetary policy objectives. The first of these is price stability, which is defined as inflation that is lower than but close to 2% per year. There are no signs of either runaway inflation or growth [1] [2]. The securities buyback programme should help to consolidate growth and push inflation towards the 2% target. At the same time, the liquidity issued by the central bank in its securities purchase programmes and the low level of interest rates (short and long term) are fuelling fears that monetary stability might have an adverse effect on financial stability[3].

The result leaves the ECB facing a dilemma. Putting a premature end to quantitative easing could keep the euro zone in a state of low inflation and low growth. Unnecessarily prolonging QE, while the US Federal Reserve has begun normalizing its monetary policy, could create a risk of financial instability, resulting in an uncontrolled surge in asset prices, credit, and more broadly the risk taken on by the financial system.

We assess this dual risk using indicators on the activity of the banking system of the euro zone as a whole and of the countries that make it up. Credit, whether granted to households or to non-financial enterprises, is central to bank assets and often at the heart of risks to financial instability[4]. Here we propose extending the analysis to the size of the balance sheet and to total loans granted – including credit to other monetary and financial institutions – which makes it possible to measure the risk associated with the banking system as a whole[5].

These different variables are related either to GDP, which makes it possible to capture the disconnection between banking activity and real activity, or to the capital and reserves of the banking system, which makes it possible to capture the leverage effect, i.e. the capacity of the system to absorb losses. Here we focus on quantities rather than prices, using indicators such as the ratio of credit granted on equity and the ratio of credit received on income. These are central to reflecting the transmission of monetary policy and to assessing the risk of financial instability.

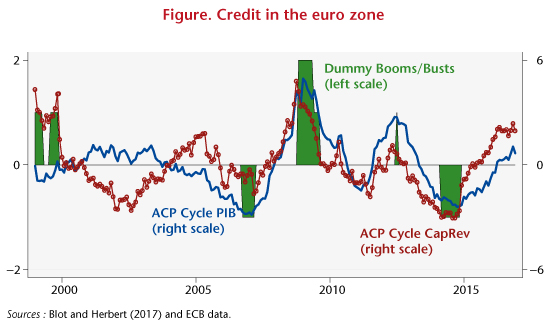
Graphe_post30-05_ENG

The graph shows the changes in the credit cycle, relative to GDP (blue line) and relative to the capital and reserves of the banking system (red line) [6]. The green areas indicate periods when credit deviates significantly above or below its long-term trend. In general, the analysis of credit and of the size of the banking system’s balance sheet points to a recovery in activity but it does not suggest either a credit boom or an excessive contraction in the euro zone in the recent period. While credit is evolving in a relatively more favorable direction relative to its trend in France and Germany, the cycle does not indicate an excessive increase. The Netherlands and Spain are distinguished by a low level of credit relative to GDP. For the Netherlands, this trend is confirmed by the indicators relative to the banking system’s capital and reserves, while in Spain, outstanding loans relative to capital and reserves are at a historically high level, suggesting an excessive level of risk-taking given the economic situation.

[1] Translation errorDespite the recent rebound in inflation, which is largely linked to the rise in oil prices and inflation expectations, inflationary pressures are still moderate, and getting inflation back to the 2% target is not sufficiently sure to warrant a change in the direction of monetary policy.

[2] Unemployment is still high, fuelling deflation.

[3] A recent analysis by Borio and Zabai (2016) of the effectiveness of unconventional monetary policy suggests that its effectiveness could decrease even as the risks involved increase. The role of asset prices has been studied by Andrade et al. (2016), showing that asset prices had reacted, as expected, following the measures taken by the ECB, and by Blot et al. (2017) on an assessment of the risk of bubbles.

[4] See Jorda et al., 2013 and 2015.

[5] Translation errorThe Basel III legislation is based on risk indicators calculated at the level of banking establishments, while our approach is based on macroeconomic indicators.

[6] Translation errorThese cycles are obtained using a principal component analysis (PCA) of several types of trend / cycle breakdowns: the Hodrick-Prescott filter, the Christiano-Fitzgerald filter, and the moving average.


How negative can interest rates get?

By Christophe Blot and Paul Hubert

On 11 June 2014, the European Central Bank decided to set a negative rate on deposit facilities and on the excess reserves held by credit institutions in the euro zone. This rate was then lowered several times, and has been -0.40% as of March 2016. This raises questions about the reasons why agents, in this case the commercial banks, agree to pay interest on deposits left with the ECB. In an article on the causes and consequences of negative rates, we explain how the central bank has come to impose negative rates and how far they can go, and then we discuss the costs of this policy for the banks.

To conduct its monetary policy, the ECB requires commercial banks in the euro zone to have an account with the Bank, which is used to meet the minimum reserve requirements[1]  and to participate in operations to provide liquidity. This account can also be used to perform clearing transactions between commercial banks. The required reserves are remunerated at a rate set by the ECB. Beyond this amount, in normal circumstances the banks do not receive any other compensation. Moreover, the ECB also provides a deposit facility allowing the banks to deposit cash with the ECB for a period of 24 hours, with remuneration paid at a deposit facility rate.

Prior to 2008, the commercial banks held only the reserves that they needed to meet the minimum reserve requirements (see the graph). Any stock of excess reserves[2] was very small: less than 1 billion euros on average until 2008. The same was true for the balance of deposit facilities, which was 321 million euros on average. Since the crisis, the ECB has replaced the interbank market and has intervened to provide a large amount of liquidity. Through the banks’ participation in various ECB programmes to purchase securities (quantitative easing, QE), they also receive liquidities that are placed in their reserve account, to such an extent that by September 2016 the accumulated stock of excess reserves and deposit facilities reached 987 billion euros. The negative rates do not apply to all monetary policy operations but only to the portion of the cash left on deposit by the banks (total assets of the euro zone banks are 31 trillion euros). At the current rate, the direct annual cost to the banks is thus 3.9 billion euros.

Given that the banks are not required to hold these excess reserves, it is reasonable to ask why they accept to bear this cost. To answer this question, it is necessary to examine the possibilities for trade-offs with other assets that could be used as a substitute for the excess reserves. The reserves are in fact money[3] issued by the central banks solely for the commercial banks and are therefore a very liquid asset. But the rates on the money market are also negative, to such an extent that it is a matter of indifference to the banks whether they have excess reserves and place their liquidities on the interbank market for a week or buy Treasury securities issued by the French or German government, for example, with yields that are also negative.


graph

Actually, the best substitute for the reserves would be to hold the cash directly. The substitution could therefore take place within the monetary base if the banks called for the conversion of their excess reserves and deposit facilities into cash, which has the same properties in terms of liquidity and zero nominal interest. Currently this would mean converting 987 billion euros of reserves into banknotes, nearly doubling the amount outstanding, as the volume of notes in circulation in September 2016 was 1,096 billion euros.

The fact that these agents can have an asset that is not interest-bearing is the argument for why nominal rates cannot be negative. In practice, because there are costs to holding currency in the form of notes, this trade-off does not take place when the threshold for negative rates is exceeded. The nominal rate can therefore be negative. It is clear however that there is a threshold at which holding cash would be preferable. The cost of holding large amounts of cash is not known precisely, but it seems that it is not insignificant, and in any case is higher than the 0.4% currently charged by the ECB.

It seems that in practice there has not yet been any such substitution, since the volume of outstanding notes in circulation has not risen particularly since negative rates were first set (graph). Jackson (2015) has made an assessment indicating that the various costs of holding money in the form of notes and coins could be up to 2%, which would act as an effective lower bound (ELB) for a reduction in rates.

Beyond the costs that negative rates represent for banks, the expected benefits of such a policy need to be considered, as well as the overall context in which they have been set. Together with negative rates, the ECB is using its targeted long-term refinancing operations (TLTRO II) to enable the banks to finance themselves at negative rates, and is thus urging them doubly (via the cost of their excess reserves and via the rate at which they are financed) to grant credit to the real economy.


[1] Credit institutions are in practice required to leave reserves in this account in the amount of a certain fraction of deposits collected from the non-financial sector. See here for more details.

[2] Amount of reserves beyond the required reserves.

[3] Together with the banknotes issued, these form what is called the monetary or money base, M0.


The ECB is extending its QE programme but mixes up its communications

By Paul Hubert

On Thursday, March 10, after the meeting of its Governing Council, the European Central Bank (ECB) announced a series of additional measures for the quantitative easing of monetary policy. The aim is to prevent the onset of deflation and to boost growth in the euro zone. The key innovation lies in the measure for bank financing at negative rates. While the measures were well received by the markets at the time of the announcement, a lapse in Mario Draghi’s communications during the press conference following the Board of Governors meeting greatly undercut some of the impact expected from the decisions taken.

What decisions were taken?

– The three key rates set by the ECB were lowered. The main refinancing rate went down from 0.05% to 0%, while the marginal lending rate was cut from 0.30% to 0.25%. Finally, the deposit facility rate, which compensates the excess reserves that banks hold on the ECB’s balance sheets, is down from -0.30% to -0.40%. It thus now costs a bank more to have cash on the ECB’s balance sheet.

Quantitative easing (QE) has been extended in terms of its scale – securities purchases rose from €60 bn to €80 bn per month – but especially in terms of the types of securities eligible for purchase. While heretofore the ECB has bought government bonds (sovereign and/or local authority bonds), it will now buy high-quality corporate bonds, based on rating agency criteria. This measure is a direct response to the drying up of the supply of government securities and is expected to directly influence the conditions for corporations active on the bond markets.

– The most significant innovation concerns the new Targeted Longer-Term Refinancing Operations (TLTRO), which are intended to reboot the channels of bank lending and to provide financing to banks on the condition that they finance the real economy. These loans to banks will be at a zero or even negative rate, based on various criteria, including the amount of loans that the banks provide to households and businesses. In other words, the ECB will pay banks meeting these criteria, so that they in turn lend.

What is the expected impact?

The effect to be expected from these measures depends on the situation of the credit market. Numerous studies show that in normal times these measures have a positive effect on the economy. However, this holds true only if it is the supply of credit that is currently constricted in the euro zone. Conversely, if the problem lies in the demand for credit on the part of consumers and businesses who have poor prospects in terms of income and profits, then these measures will have little effect. In granting banks such favourable conditions, it is easy to imagine that the ECB is betting on increasing the solvent demand for credit, that is to say, that the ECB is providing banks with strong incentives to lend to households and individuals that might have appeared non-creditworthy in previous conditions. Another expected effect of the lower deposit facility rates and the increase in QE will pass through the channel of a lower exchange rate for the euro, which will promote euro zone exports and increase imported inflation, and therefore overall inflation in the euro zone. This channel is potentially even more important given that the US Federal Reserve has initiated a period of monetary tightening.

Nevertheless, a more relevant economic policy would be to make use of fiscal policy to support demand, especially as the conditions for State financing are at historically low levels: the French state in 2016 is earning money from issuing debt of less than 4 years. Monetary policy would then have all the more effect.

Why announce that there’s no manoeuvring room left?

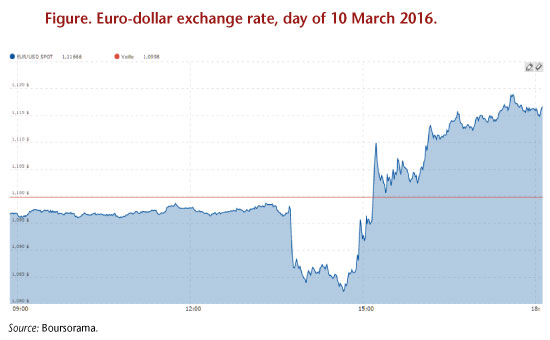
At the press conference following the meeting of the Governing Council, Mario Draghi announced that the ECB didn’t expect “to reduce rates further”, which had the effect of completely changing the financial markets’ interpretation of the decisions announced just before that. While the aim of these very expansionary decisions is to further ease monetary and financial conditions and to lower the exchange rate for the euro, the announcement that future changes in the ECB’s monetary policy could only be in a more restrictive direction transformed investor expectations.

As one of the main channels for the transmission of monetary policy involves expectations, several studies conducted on data from the US [1], Britain [2] and the euro zone [3] show that a central bank’s communications need to be consistent with its decisions, otherwise the impact expected from monetary policy will be limited. This is called the “signal effect” of monetary policy. Mario Draghi’s short statement is one such example. The following graph shows the exchange rate of the euro vis-à-vis the dollar during the course of 10 March. The sharp drop at mid-day corresponds to the publication of the decisions taken by the Board of Governors, while the equally sharp rise corresponds to the contradictory message issued a few minutes later at the press conference. We thus see that as a series of highly expansionary measures – one of whose goals is to push down the euro – was announced, the euro eventually rose vis-à-vis the US dollar as if restricting measures had been put in place.

This does not necessarily mean that these decisions will have no effect, but that some of the effect will be lessened, or even disappear. Some transmission channels other than the signal effect remain operative. While the exchange rate channel has now been limited by the restrictive effect generated by the channel of expectations, we will see in the weeks and months to come whether capital movements induced by the decisions taken will have the effect expected on the euro exchange rate.
Graphe_post11-03_ENG

[1] Hubert, Paul (2015), “The Influence and Policy Signalling Role of FOMC Forecasts”, Oxford Bulletin of Economics and Statistics, 77(5), 655-680.

[2] Hubert, Paul, and Becky Maule (2016), “Policy and Macro Signals as Inputs to Inflation Expectation Formation”, Bank of England Staff Working Paper, No. 581.

[3] Hubert, Paul (2015), “ECB Projections as a Tool for Understanding Policy Decisions”, Journal of Forecasting, 34(7), 574-587, or Hubert, Paul (2016), “Disentangling Qualitative and Quantitative Central Bank Influence”, OFCE Working Paper, No. 2014-23.


Give Recovery a Chance

By iAGS team, under the direction of Xavier Timbeau

The ongoing recovery of the Euro Area (EA) economy is too slow to achieve a prompt return to full employment. Despite apparent improvement in the labour market, the crisis is still developing under the covers, with the risk of leaving long-lasting “scars”, or a “scarification” of the social fabric in the EA. Moreover, the EA is lagging behind other developed economies and regardless of a relatively better performance in terms of public debt and current account, the current low rate of private investment is preparing a future of reduced potential growth and damaged competitiveness. So far, the Juncker Plan has not achieved the promised boost to investment. The internal rebalancing of the EA may fuel deflationary pressure if it is not dealt with through faster wage growth in surplus countries. Failure to use fiscal space where it is available will continue to weigh down on internal demand. Monetary policy may not succeed in the future in avoiding a sharp appreciation of the Euro against our trade partners’ currencies. Such an appreciation of the real effective exchange rate of the Euro would lock the EA in a prolonged period of stagnation and low inflation, if not deflation.

A window of opportunity has been opened by monetary policy since 2012. Active demand management aimed at reducing the EA current account combined with internal rebalancing of the EA is needed to avoid a worrying “new normal”. Financial fragmentation has to be limited and compensated by a reduction of sovereign spreads inside the euro area. Active policies against growing inequalities should complement this approach. Public investment and the use of all policy levers to foster a transition toward a zero carbon economy are ways to stimulate demand and respect the golden rules of public finance stability.

For further information, see iAGS 2016 report