2024-2025 World Economic Outlook: EUROPE TAKES OFF
OFCE Analysis and Forecasting Department, Éric Heyer (dir.) and Xavier Timbeau (dir.) [1]
This text is the summary of the Outlook for the World Economy realized in the spring of 2024 by the international team and published in a French version (OFCE Policy brief, n° 125). Concerning the analysis and forecast for the French Economy, the 2024-2025 Outlook is published in an English version .
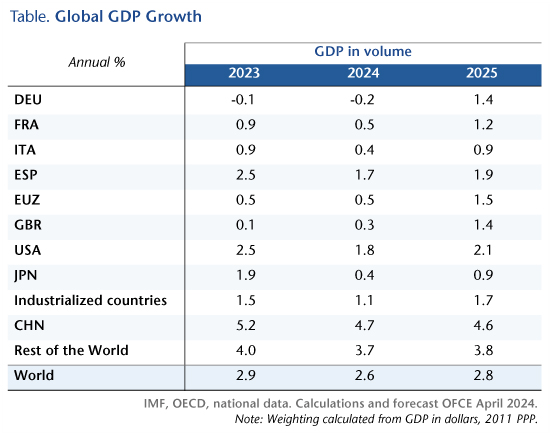
While the United States still escapes the slowdown, the economic situation in the European countries remains deteriorated, accentuating the gap that has appeared from the start of the Covid crisis. Beyond the differences in potential growth between countries, these differences are notably linked to the impact of the energy crisis, which is greater in Europe than in the US, and to the direction of fiscal policy since 2020. These differences are not expected to narrow in the short term. Surveys and the first economic data available at the start of the year draw a picture of contrasts between the major industrial countries, leading us to forecast a further contraction in Germany’s GDP for the first quarter (-0.2%), a slightly positive growth in the United Kingdom. At the same time, Spain and the United States are likely to remain on course in the short term.
In industrialized countries, particularly in Europe, growth is set to rebound to 1.7% in 2025, Activity would be supported by the easing of monetary policy. The convergence of inflation towards the 2% target would effectively lead central banks to cut interest rates from mid-2024. Conversely, the level of budget deficits and public debt will lead many governments to take consolidation measures.
In emerging countries, growth will remain stable in 2024 and 2025. In China, growth should resist despite the crisis in the real estate sector. The economic indicators point to some acceleration in production, and we forecast annual growth of 4.7% in 2024. In India, activity would slow down compared with 2023, rising by around 6.5%. In emerging Asian countries (excluding China), growth is expected to continue at the same pace as in 2023. In Latin America, we forecast a slowdown to 1,1 %, before a rebound to 2 % in 2025. Global growth would reach 2.8% in 2025, 0.2 point above its 2024 level.
[1] This analysis is based on the work of the international team, which is led by Christophe Blot and composed of Céline Antonin, Amel Falah, Sabine Le Bayon, Catherine Mathieu, Hervé Péléraux, Christine Rifflart, Benoît Williatte. The forecast is based on information available as of 5 April 2024.
With the latest national accounts published on 22 December 2022 showing a 0.3% fall in GDP in Q3 of 2022, following a 0.1% rise in the previous quarter, concerns are growing that the British economy may be entering a recession. In an inflationary context that has been exacerbated since early 2021, in particular due to the rise in energy prices, successive governments, led by Johnson, Truss and then Sunak, have introduced measures to support the economy in order to cushion the shock to purchasing power and temper its negative impact on activity.
On 17 November, the Sunak government, which took office on 24 October, presented a budget that contrasts sharply with the orientation of its predecessor, led by Liz Truss, who resigned after only 44 days in office. Indeed, the former government’s announcement of a sweeping budgetary plan to support households and businesses in the face of the energy crisis and to lower taxes over a five-year period left doubts about its viability in the absence of financing, sending panic through the markets.
For the medium term, the budget presented by the current British Chancellor Jeremy Hunt takes a line opposite to that promoted by the former government and relies instead on austerity to prolong the effort at fiscal consolidation undertaken after the Covid-19 shock and to guarantee control of the public finances over the next five years in a context of rising interest rates. The government is nonetheless caught between conflicting objectives: between support for households and business in the short term to mitigate the effects of the inflationary shock, and the desire to guarantee the medium-term stability of public finances. The plan announced on 17 November is thus divided into three parts.
A State buffering inflation
A first set of short-term measures has been taken to support households faced with rising prices, particularly for energy. The government continued the measure taken by the previous government for this winter, namely capping gas and electricity prices. Thus, during the winter of 2022/2023, households will see their energy bills limited to an average of £2,500 per year, which represents a saving of £900 borne by the public purse, at a total cost of £24.8 billion. This cost is of course uncertain as it depends on the price of energy on the international markets. The provisions will be less generous in the 2023/2024 financial year[1], when the cap rises to £3,000 per annum, reducing household support by £500 and cutting the measure’s overall cost to £12.8 billion according to the budget. Raising the cap should thus save £14 billion in 2023/2024 compared to the Truss government’s announcement of £26.8 billion in tax shields for the year.
The government plans to plough 90% of this £14 billion savings in 2023/2024 back into support schemes for the most vulnerable households, with payments to 8 million households: means-tested benefit recipients will receive payments of £900, pensioners £300, and recipients of disability allowance £150. The government has also decided to follow the Low Pay Commission’s recommendation of a 9.7% rise in the minimum wage in April 2023, and social benefits and state pensions will rise in line with inflation in October 2022, i.e. by 10.1%.
On the other hand, in order to support the productive sector, the government has maintained the Truss government’s support scheme for companies facing rising energy costs, while cutting the scheme back. The measures, introduced for six months between 1 October 2022 and 31 March 2023, should cost £18.4 billion (compared with £29 billion planned by the previous government).
The government had not yet decided on 17 November 2022 whether to renew the business support measures for the 2023/2024 financial year, and an evaluation was to be carried out to inform future decisions. On 9 January 2023, Sunak’s government clarified its intentions regarding the sustainability of the “energy shield” for businesses: it will be maintained during the 2023/2024 financial year but will be considerably reduced compared to current provisions. This is due to their cost, which Jeremy Hunt considers unsustainable for the country’s public finances. So £5.5 billion is budgeted for the 2023/2024 financial year.
In total, the energy shield and support for vulnerable households and businesses will receive £43.2 billion in 2022/2023 and £30.6 billion in 2023/2024. Adding in the measures already taken by the Johnson government since March 2022, the public commitment comes to £64.2 billion in 2022/2023 and £45.3 billion in the following year. On a calendar basis, this support amounts to £48.2 billion in 2022 (or 2.2 percentage points of 2019 GDP) and £50 billion in 2023, making the UK one of the most generous countries on the continent of Europe in terms of supporting the economy in the face of an inflationary shock[2], although slightly later than others.
The State – Guarantor of the sustainability of the public finances
In addition to this short-term support for the economy, which implies a highly expansionary policy, the new government has expressed its concern to ensure a “sustainable” trajectory for the public purse, i.e. one that leads to both a fall in the debt/GDP ratio over a five-year period and a reduction in the deficit to below 3% of GDP. In order not to contradict the support measures decided for the 2022/2023 and 2023/2024 financial years, when there is a high risk of the British economy entering a recession, the government has taken care to start tightening fiscal policy only in 2024/2025.
The fiscal austerity plan provides additional resources that rise progressively to £55 billion in 2027/2028, which is split between 45% in tax increases (£25 billion in 2027/2028) and 55% in spending cuts (£30 billion). For households, the government plans to lower the 45% income tax threshold from £150,000 to £125,140 in April 2023, to freeze income and inheritance tax rates at current levels for a further two years until April 2028, to quadruple tax credits on dividends and capital gains from 2024/2025, and to limit the previous government’s reductions in property transaction duty to 31 March 2025.
The 19% corporation tax cut envisaged by Liz Truss is cancelled, and the rate will rise to 25% in April 2023, as announced before Truss took office. The rate of social security contributions will remain at the current level between April 2023 and April 2028. In addition, energy companies’ excess profits will be taxed more heavily, with the current arrangements extended to March 2028 and the tax rate increased from 25% to 35% on 1 January 2023 (£14 billion expected in the 2023/2024 financial year). In addition, a 45% tax on the profits of electricity producers will be introduced in January 2023 (£4 billion expected in 2023/2024). The government nevertheless remains concerned about inflationary pressures on production and has planned a cumulative support to business of £13.6 billion until 2027/2028, mainly by means of local taxes.
On the expenditure side, the government plans to implement a savings plan based mainly on slowing down the growth in public spending, which should not exceed inflation by more than 1 point. However, the effort will be implemented from the 2025/2026 financial year onwards, while some spending on priority public services (health, social protection and schools) will rise over the next two financial years.
Calming the markets
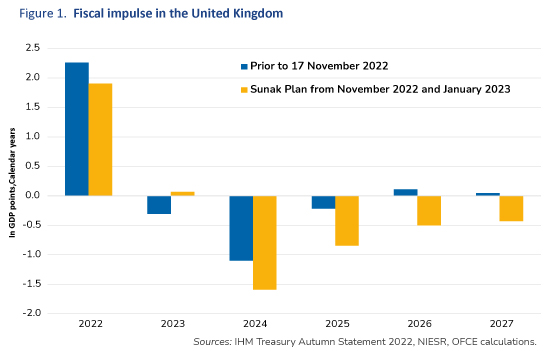
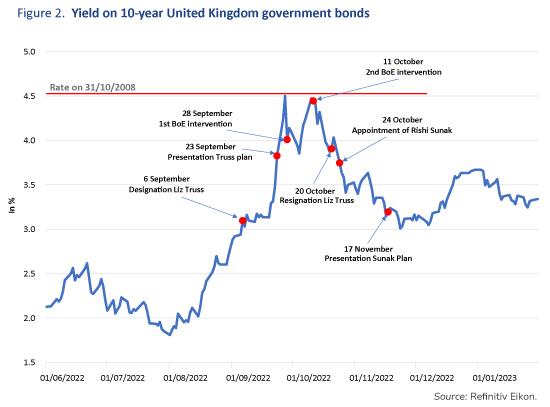
In terms of the fiscal impulse, the calendar year 2022 looks to be the most expensive ever in response to the emergency created by the spectacular rise in inflation (Figure 1). In 2023, the redeployment of almost all the resources freed up by the reduction in the energy shield to the most vulnerable households and the maintenance of a “business shield” will make it possible to ensure the government’s overall commitment to the emergency plan, without however generating any significant additional stimulus. On the other hand, in 2024, the withdrawal of short-term aid schemes and the entry into force of the fiscal savings plan will generate a very negative fiscal impulse of -1.2 points of GDP. By 2027, the provisions announced by the Sunak government will see a negative fiscal impulse of around 0.5 percentage points of GDP each year.
However, it is hypothetical whether these projections will be attained over a five-year horizon. First, a new budget will be presented on 15 March. Second, a general election will be held by the end of 2024. There is therefore great uncertainty about the implementation of this plan. Nevertheless, the November 2022 announcements achieved the objective of calming the financial markets, as by 1 December 2022 the yield on 10-year government bonds had fallen back to its level prior to the Truss government’s autumn budget statements (Figure 2). In the meantime, the pound, after depreciating by 5% between 6 and 28 September 2022, also returned to its level of early September.
[1] In the United Kingdom, the financial year starts on 1 April and ends on the following 31 March.
[2] See “From hot to cold”, Analysis and Forecasting Department, Perspectives 2022-2023 pour l’économie mondiale et la zone euro [in French], 12 October 2022, pp. 35-41.
War in Ukraine and rising international tension: What impact on GDP?
The invasion of Ukraine launched by Russia on 24 February 2022[1] dealt a major shock to the European economy, which was already suffering from other constraints (supply problems[2], recruitment difficulties, rising energy prices, inflation). Beyond the massive impact on the economies of the countries directly affected by the war, in particular the aggressed country itself (human losses, destruction of capital, diversion of resources from production, among others), the rise in geopolitical tensions can have economic effects even in countries not (directly) involved in the fighting. In the face of this, these countries may boost their military spending, adopt wait-and-see investment behaviour, increase precautionary savings, or suffer unanticipated shocks to import prices and capital flows (in or out). In a study available online [in French], we have attempted to quantify the effects of these ongoing tensions on GDP growth in the six economies most closely followed by the OFCE: France, the United States, the United Kingdom, Germany, Italy and Spain. In addition, we have tried to measure the impact on world trade and global industrial production.
Caldara and Iacoviello (2022) have recently proposed a quantitative indicator of geopolitical risk. The authors construct an indicator for the level of tension at the global level, which they have developed for 43 countries, including the main players on the international scene. The study also sets out the statistical method used to quantify the causal impact of the developments observed in 2022. This publication comes at just the right time for the forecaster.
2022: A historic year for international relations
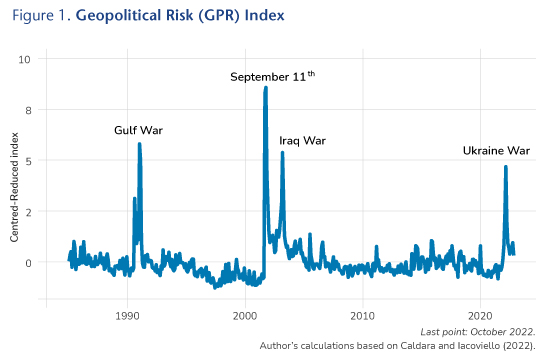
For Caldara and Iacoviello (2022), geopolitical risk is associated with the impact of international crises, and more specifically with violence that affects the peaceful course of international relations. According to the authors, geopolitical risk refers to threats, or materializations of threats or the escalation of a pre-existing conflict. Such conflicts may be related to war, terrorism or any other type of tension between states or political actors. It should be noted that the term risk used by the authors for this type of phenomenon has a broad meaning that goes beyond the measurement of uncertainty or the probability that a random event will occur. The geopolitical risk index measures not only potential conflicts (which is consistent with a probabilistic definition of risk) but also conflicts that are actually taking place[3].
Since the 1980s, this index exhibits major changes, notably during the Gulf War, September 11th, the war in Iraq and more recently the invasion of Ukraine (see Figure 1). Moreover, between 2003 and 2022, there were occasional peaks in tension following the various terrorist attacks that took place in Europe (with France in the front line) but also in the United States, as well as other conflicts (war in Libya, for example).
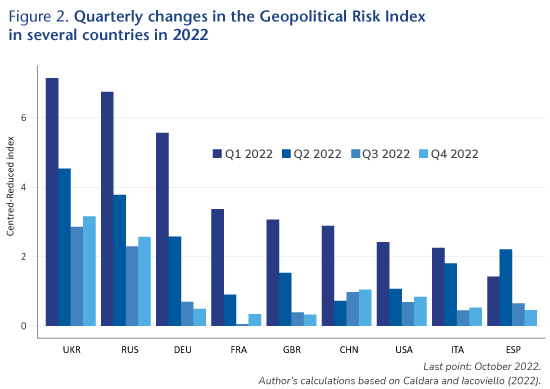
Of course, shocks do not affect all countries equally. Figure 2 shows recent changes in the geopolitical risk index in a selection of countries since the beginning of 2022. Unsurprisingly, the risk rose the most in Ukraine and Russia. In the wake of the invasion of Ukraine, geopolitical risk has risen sharply in Germany, which is especially dependent on Russian hydrocarbons. The other European countries seem – logically – more exposed to the current tensions than China and the United States.
Germany’s growth strongly affected by the rise in tension
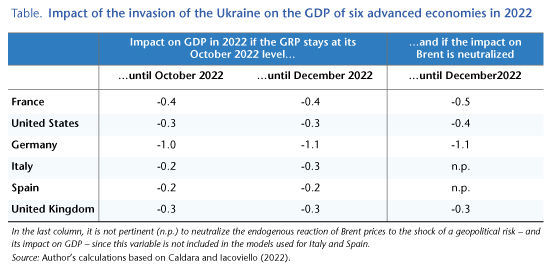
The study estimates the responses of several economic variables (GDP, investment, interest rates, market capitalization) caused by a geopolitical risk shock[4]. In our main results, the geopolitical shock induces an endogenous fall in oil prices and interest rates. In this context, a geopolitical risk shock operates as a demand shock. When this negative effect on energy prices occurs – which is not the case for all countries – we have neutralized this endogenous effect, which does not seem to be operational in the current context, particularly in Europe, in order to make more robust quantitative assessments.
According to our estimates, if the global geopolitical risk index remains at its October 2022 level until the end of the year, the rise in geopolitical tensions observed in 2022 will have accounted for a 0.7 point drop in world merchandise trade (in volume terms) and a 0.6 point drop in world industrial production. In addition, Germany will have lost up to 1.1 percentage points of GDP in 2022 due to the year’s rising geopolitical tensions. Elsewhere, the effects are smaller but significant: between 0.4 and 0.5 points of GDP in France, and 0.3 and 0.4 points in the US, Italy and the UK. Finally, Spain’s GDP loss would be about 0.2 points (Table 1)[5].
These results provide a basis for reflection but should be taken with caution. Each international crisis is unique, and it is difficult to assess one exclusively in terms of a quantitative indicator. In particular, the current crisis has major consequences for Europe’s energy supply, especially in terms of gas, which produces a different crisis from what would spontaneously emerge from a statistical model based on observations in the past[6].
[1] Caution: When it is said that Russia’s invasion of Ukraine dates from 24 February 2022, this is done for ease of language. It should not be forgotten that parts of Ukraine’s territory, including the Crimea, have been under Russian control since 2014. What we are currently experiencing, far from being the beginning of a conflict, is above all the crossing of a milestone in a conflict that has persisted for many years.
[3] The reader interested in a more comprehensive presentation can refer to the original article for greater detail.
[4] The estimates are made using the local projection method of Jordà. See Òscar Jordà, 2005, “Estimation and Inference of Impulse Responses by Local Projections”, American Economic Review, vol. 95, no. 1, pp. 161-82. https://doi.org/10.1257/0002828053828518.
[5] Obviously, while most of the increase in international tension can be attributed to the consequences of Russian decisions, it is not possible to exclude other sources of international tension, particularly in connection with the future of Taiwan and Sino-American relations.
[6]Geerolf (2022) discusses the implications of modelling an energy supply shock specifically in the context of a Russian cut-off of the gas supply.
In the first quarter of 2022, US GDP fell by 0.4%, ending the recovery that had begun in the summer of 2020. The international economic environment had deteriorated significantly due to a combination of negative shocks. The global economic recovery has been accompanied by supply difficulties and a sharp upturn in energy prices, amplified since February 2022 by Russia’s invasion of Ukraine. The conflict has led to heightening geopolitical tensions and fuelled greater uncertainty[1]. Finally, rising inflation has led central banks, particularly the Federal Reserve, to raise interest rates. So is the decline in US GDP at the beginning of the year a sign of a recession, or will it simply put the brakes on growth?
After the steep downturn observed in 2020, the US economy rebounded sharply, and by the second quarter of 2021 GDP exceeded the level of activity seen at the end of 2019. Growth for 2021 as a whole stood at 5.7% and was strongly driven by domestic demand, in particular household consumption, which shot up by 7.9%[2]. The support plans implemented first by the Trump administration and then by Biden more than compensated for the loss of primary household income due to the pandemic, and generally boosted consumption, particularly of durable goods[3]. The dynamism of demand in the US and globally then ran up against supply constraints as new waves of COVID transmission struck. Although the spread of the virus in most countries was not accompanied by the kind of strict prophylactic measures taken in the spring of 2020, the situation nevertheless worsened, clogging up global supply chains and holding back labour supply[4]. This contrast between US demand, supported by highly expansionary fiscal policies, and constrained global supply has pushed prices up. In the US, the consumption deflator excluding energy and food prices rose to 3.3% in 2021, with much higher increases for some goods: 13.2% for cars, for example. Another sign of the imbalance in US growth: the sharp increase in import volumes (+14% over the year compared with a 4.5% increase in exports) has led to a deterioration in the trade balance in goods and services, with a deficit of $1,280 billion in 2021 (or 5.6% of GDP) compared with $905 billion (4.2% of GDP) two years earlier. The contraction of GDP observed in the first quarter of 2022 could be the manifestation of an overheating economy, as domestic demand has remained buoyant: +0.5 points. It is foreign trade’s negative contribution (-1 point) that accounts for the 0.4% fall in GDP.
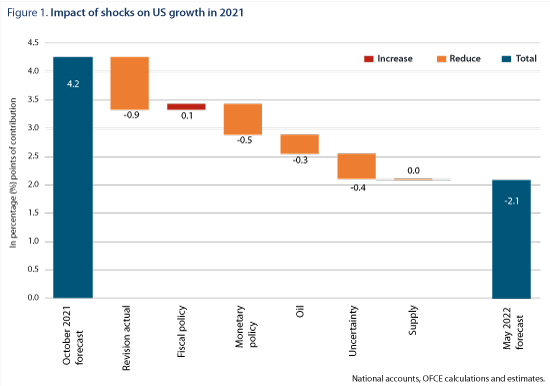
The rest of 2022 will be marked mainly by more negative shocks. While our October forecast anticipated growth of 4.2%, this figure had to be revised downwards significantly (Figure 1) to 2.1%. Although the US is an oil producer, the rise in price nevertheless is having a negative effect due to reduced household purchasing power and higher production costs for business[5]. Assuming that geopolitical tensions remain at the level observed in April until the end of the year, the uncertainty shock will cut growth by 0.4 points[6]. As for supply constraints, these should not have a major recessionary impact in the United States but will undoubtedly contribute to maintaining pressure on prices. The reduction in the growth forecast is also due in part to a stronger-than-expected tightening of monetary policy. Indeed, in the October 2021 scenario, we anticipated that inflation would gradually fall back to the Federal Reserve’s target, implying a much slower normalisation of monetary policy. In the face of the larger and longer-lasting inflationary shock, the Federal Reserve has tightened monetary policy. The last three meetings of the Federal Open Market Committee(FOMC) have resulted in consistent rate hikes, from 0.25% in January to 1.75% in June. This should continue in the second half of the year, with the rate increasing by 1.5 points on average over the year, which would have an effect on growth of up to 0.5 points from 2022. In total, these shocks should therefore cut the forecast for growth by 1.2 points. This effect is being compounded by the fact that actual growth in the third and fourth quarters of 2021 was less strong than we had anticipated: 0.6% and 1.7% respectively, compared with the October 2021 forecast of 1.4% and 2.3%. Finally, these shocks will not be offset by fiscal policy[7].
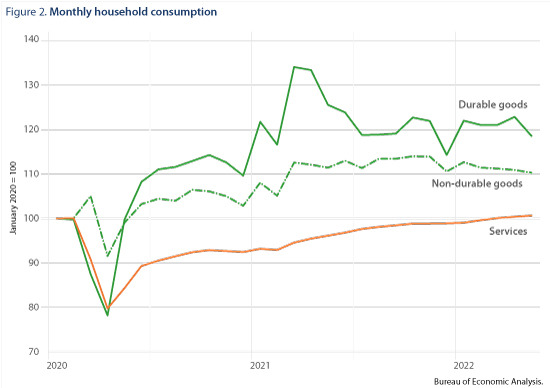
Given the figure for growth in the first quarter of 2022, quarterly growth during the following three quarters of around 0.3-0.4% should be compatible with annual growth of 2.1%[8]. The economic indicators for the months of April to June confirm a slowdown in US activity in a context of still high inflation. The monthly figures for household consumption, which rose in April (+0.3%) but fell in May (-0.4%), already suggest further slowing. This performance once again continues to be driven by purchases of durable goods, which peaked in March 2021 and have since fallen by 5.6% (Figure 2). Business confidence surveys have confirmed the slowdown, but levels are still above long-term averages. Moreover, industrial output continued to rise in April and May. Finally, on the employment and unemployment front, the figures for June provide a good picture of the second quarter. The unemployment rate stagnated at 3.6%, after having fallen by more than 11 points between April 2020 and March 2022. Employment in turn has risen on average from the first quarter, but the level in June 2022 was lower than in March. These elements therefore point to moderate or even negative growth, particularly if the contribution of foreign trade is again negative. At worst, however, this would be a technical recession[9].
[4] China was a notable exception because of its “zero Covid” strategy, resulting in local lockdowns.
[5] A recent review of the literature does suggest that higher oil prices reduce household consumption and investment. See A. M. Herrera, M. B. Karaki & S. K. Rangaraju, 2019, “Oil price shocks and US economic activity”, Energy policy, No. 129, pp. 89-99.
[7] The estimate of the impact of fiscal policy reflects the revision of the fiscal impulse compared to the scenario envisaged in October 2021. The fiscal impulse was negative due to the end of various one-off measures enacted to address the health crisis. The revision is mainly due to the analysis of the measures included in the 2022 budget by the Biden administration.
[8] The performance in Q1 may well already partly capture the impact of the various shocks.
[9] A technical recession refers to a situation when GDP declines over two consecutive quarters. However, a recession depends on a set of indicators.
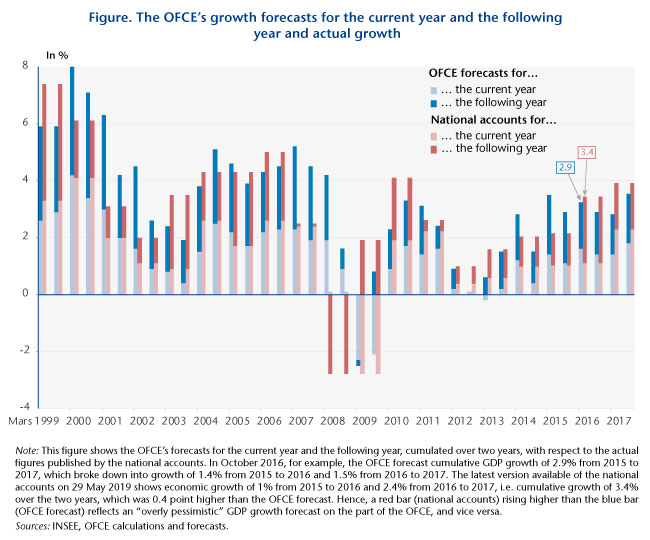
In the spring of 2019, the OFCE forecast real GDP growth of 1.5% for 2019 and 1.4% for 2020 (i.e. cumulative growth of 2.9%). At the same time, the average forecast for the two years compiled by Consensus Forecasts[1] was 1.3% each year (i.e. 2.6% cumulative), with a standard deviation around the average of 0.2 points. This difference has led some observers to describe the OFCE forecasts as “optimistic as usual”, with the forecasts of the Consensus or institutes with less favourable projections being considered more “realistic” in the current economic cycle.
A growth forecast is the result of a research exercise and is based on an assessment of general trends in the economy together with the impact of economic policies (including budget, fiscal and monetary policies) and exogenous shocks (such as changes in oil prices, social disturbances, poor weather, geopolitical tensions, etc.). These evaluations are themselves based on econometric estimations of the behaviour of economic agents that are used to quantify their response to these shocks. It is therefore difficult to comment on or compare the growth figures issued by different institutes without clearly presenting their analytical underpinnings or going into the main assumptions about the trends and mechanisms at work in the economy.
However, even if the rigour of the approach underlying the OFCE’s forecasts cannot be called into question, it is legitimate to ask whether the OFCE has indeed produced chronic overestimations in its evaluations. If such were the case, the forecasts published in spring 2019 would be tainted by an optimistic bias that needs to be tempered, and the OFCE should readjust its tools to a new context in order to regain precision in its forecasts.
No systematic overestimation
Figure 1 shows the cumulative forecasts of French GDP by the OFCE for the current year and the following year and then compares these with the cumulative results of the national accounts for the two years. In light of these results, it can be seen that the OFCE’s forecasts do not suffer from a systematic bias of optimism. For the forecasts conducted in 2016 and 2017, the growth measured by the national accounts is higher than that anticipated by the OFCE, which, while revealing an error in forecasting, does not constitute an overly optimistic view of the recovery.
The opposite can be seen in the forecasts in 2015 for 2015 and 2016; the favourable impact of the oil counter-shock and of the euro’s depreciation against the dollar during the second half of 2014 was indeed slower to materialize than the OFCE expected. The year 2016 was also marked by one-off factors such as spring floods, strikes in refineries, the tense environment created by the wave of terrorist attacks and the announcement that certain tax depreciation allowances for industrial investments would end.
In general, there is no systematic overestimation of growth by the OFCE, although some periods are worth noting, such as the years 2007 and 2008 when the negative repercussions of the financial crisis on real activity were not anticipated by our models during four consecutive forecasts. Ultimately, of the 38 forecasts conducted since March 1999, 16 show an overestimate, or 40% of the total, with the others resulting in an underestimation of growth.
Forecasts relatively in line with the final accounts
Furthermore, the accuracy of the forecasts should not be evaluated solely in relation to the provisional national accounts, as INSEE’s initial estimates are based on a partial knowledge of the real economic situation. They are revised as and when the annual accounts and tax and social information updates are constructed, which leads to a final, and therefore definitive, version of the accounts two-and-a-half years after the end of the year[2].
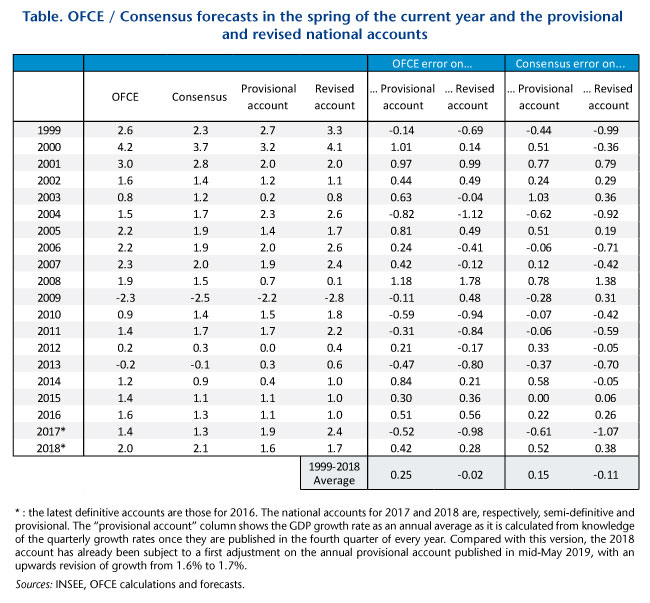
Table 1 compares the forecasts made by the OFCE and the participating institutions in the spring of each year for the current year and assesses their respective errors first vis-à-vis the provisional accounts and then vis-à-vis the revised accounts. On average since 1999, the OFCE’s forecasts have overestimated the provisional accounts by 0.25 points. The forecasts from the Consensus appear more precise, with an error of 0.15 point vis-à-vis the provisional accounts. On the other hand, compared to the definitive accounts, the OFCE’s forecasts appear to be right on target (the overestimation disappears), while those from the Consensus ultimately underestimate growth by an average of 0.1 points.
Statistical analysis conducted over a long period thus shows that, while there is room for improvement, the OFCE’s forecasts are not affected by an overestimation bias when assessing their accuracy with respect to the final accounts.
[1] The Consensus Forecast is a publication of Consensus Economics that compiles the forecasts of the world’s leading forecasters on a large number of economic variables in about 100 countries. About 20 institutes participate for France.
[2] At the end of January 2019, the INSEE published the accounts for the 4th quarter of 2018, which provided a first assessment of growth for 2018 as a whole. At the end of May 2019, the accounts for the year 2018, calculated based on the provisional annual accounts published mid-May 2019, were revised a first time. A new revision of the 2018 accounts will take place in May 2020, and then a final one in 2021 with the publication of the definitive accounts. For more details on the National Accounts revision process, see Péléraux H., « Comptes nationaux : du provisoire qui ne dure pas », [The national accounts : provisional accounts that don’t last], Blog de l’OFCE, 28 June 2018.
The imperative of sustainability economic, social, environmental
It was during the climax of the so-called Eurozone sovereign debt crisis that we engaged into the independent Annual Growth Survey – the project was first discussed at the end of the year 2011 and the first report was published in November 2011. Our aim, in collaboration with the S&D group at the European Parliament, has been to challenge and question the European Commission contribution to the European Semester, and to push it toward a more realistic macroeconomic policy, that is to say less focused on the short term reduction of public debt and more aware of the social consequences of the crisis and the austerity bias. For 7 years, we argued against a brutal austerity failing to deliver public debt control, we warned against the catastrophic risk of deflation. We also alerted on the social consequences of the deadly combination of economic crisis, increased labor market flexibility and austerity on inequalities, especially at the lower part of the income distribution. We cannot claim to have changed alone the policies of the Union, but we acknowledge some influence, although insufficient and too late to prevent the scars let by the crisis.
Today, there is a need to take this initiative a major step forward. The adoption of the UNSDGs calls for a new approach to economic governance and to economic growth. The measurement of economic performance needs to evolve into the measurement of well-being on all three accounts of sustainable development – economic, social and environmental. A broad range of policies have to be mobilized coherently to this effect, which must move fiscal policy from a dominant to an enabling and supportive role. Moreover, those policies need to be anchored on a consistent and inclusive long-term strategy, and should be monitored closely to check that they deliver sustainability.
So far, the EU has not properly embraced this agenda, and the still prevailing European Semester process is an inadequate process to lead the EU towards achieving the UNSDGs. In the same way as the iAGS challenged the dominant orthodoxy in the macroeconomic field, the iASES 2019 – independent Annual Sustainable Economy Survey, the new name of the iAGS – is our contribution to support a strategy towards sustainability and show the way.
The iASES 2019 scrutinizes the general outlook of the EU economy. The coming slowdown largely results from the gradual attenuation of the post-Great Recession recovery momentum and the convergence of growth rates towards a lower potential growth path. The slowdown of growth coincides with a revival of political turmoil – Brexit, Italy’s public finances, the trade war and turbulences in some emerging countries. The upturn will come to an end at some point, and the euro area is not yet prepared for that, as imbalances persist and the institutional framework remains incomplete[5]. The euro area has moved into a large trade surplus, which may not be sustainable. Nominal convergence remains an important issue that should be addressed by political willingness to coordinate wage development more actively, beginning with surplus countries. Moreover, the incomplete adoption of a Banking Union may be insufficient to ensure banking stability in case of adverse shocks. The ECB could have to come to the rescue with extended unconventional policies, complemented with automatic stabilisation measures working across borders within EMU.
The social situation has slightly improved in the EU since the worse of the crisis and, on average, the unemployment rates across European countries are back at their pre-crisis levels. However, differences across countries and sections of the population are still huge. Policy makers need to be aware of possible trade-offs and synergies between economic, social and environmental goals in general and the Sustainable Development Goals (SDGs) in particular[6]. In line with the SDGs and intended goals of the European Pillar of Social rights iASES aims at promoting policies – expanding social investments, pro-active industrial policies, reducing working time, increasing collective bargaining to limit primary formation of inequalities – that address these goals and overcome the direct and indirect negative consequences of unemployment.
Climate change is arguably the most serious challenge that we collectively face. Computing carbon budgets can be useful to warn policy-makers about the effort to be delivered in order to put society on the road to environmental sustainability. The iASES evaluates the “climate debt” which is the amount of money that will have to be invested or paid by countries for them not to exceed their carbon budget, leading to three key policy insights. There are few years left for major European countries before exhausting their carbon budget under the +2°C target. Consequently, the carbon debt should be considered as one of the major issues of the decades to come since in the baseline scenario it represents about 50% of the EU GDP to stay below +2°C[7]. Framing the climate question in the words of debt is deliberate as the concept of excessive deficit applies today totally to the procrastination we demonstrate there.
[1] Directed by Xavier Timbeau with Guillaume Allègre, Christophe Blot, Jérôme Creel, Magali Dauvin, Bruno Ducoudré, Adeline Gueret, Lorenzo Kaaks, Paul Malliet, Hélène Périvier, Raul Sampognaro, Aurélien Saussay, Xavier Timbeau.
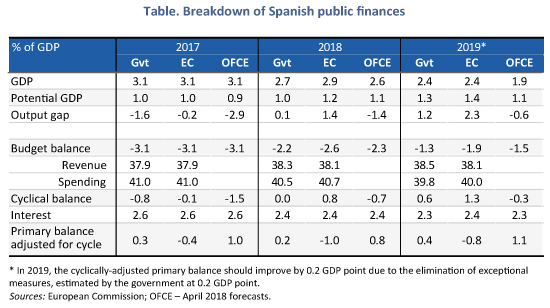
With a deficit of 3.1% of GDP in 2017, Spain has cut its deficit by 1.4 points from 2016 and has been meeting its commitments to the European Commission. It should cross the 3% threshold in 2018 without difficulty, making it the latest country to leave the excessive deficit procedure (EDP), after France in 2017. The 2018 budget was first presented to the European Commission on April 30 and then approved by Spain’s Congress of Deputies on May 23 amidst a highly tense political situation, which on June 1 led to the dismissal of Spain’s President Mariano Rajoy (supported by the Basque nationalist representatives of the PNV Party who had approved the 2018 budget a few days earlier). It should be passed in the Senate soon by another majority vote.The expansionary orientation of the 2018 budget, backed by the government of the new Socialist President Pedro Sanchez, does not satisfy the Commission, which considers the adjustment of public finances insufficient to meet the target of 2.2% of GDP included in the 2018-2021 Stability and Growth Pact (SGP). According to the hypotheses of the previous government, not only would the deficit fall below 3% but the nominal target would be respected.
Admittedly, while, given the strong growth expected in Spain in 2018, the public deficit will easily be below 3% in 2018 and therefore meet the requirements set in the EDP, the new budget act is not in line with the fiscal orthodoxy expected by Brussels. The lack of a People’s Party majority in Congress led ex-President Mariano Rajoy into strategic alliances with Ciudadanos and the PNV to get the 2018 budget adopted (with the hope, in particular, of avoiding early parliamentary elections), at the price of significant concessions:
– An increase in civil servants’ salaries of 1.75%[1] in 2018 and at least 2.5% in 2019, with a larger increase if GDP grows by more than 2.5% (estimated cost of 2.7 billion euros in 2018 and 3.5 billion in 2019 according to the outgoing government);
– Lower taxes for low-income households (via the increase in the minimum tax threshold from 12,000 to 14,000 euros income per year, tax credits for childcare expenses, assistance for disabled people and large families, and a reduction in tax on gross wages between 14,000 and 18,000 euros) (cost 835 million in 2018 and 1.4 billion in 2019);
– The revaluation of pensions by 1.6% in 2018 and by 1.5% in 2019 (cost of 1.5 and 2.2 billion), in addition to a rise of up to 3% in the old age and non-taxpayer minimum, and between 1% and 1.5% for the lowest pensions (cost 1.1 billion in 2018).
According to the former government, these measures will cost a little more than 6 billion euros in 2018 (0.5% of GDP) and nearly 7 billion in 2019 (0.6% of GDP). The revaluation of pensions should be partly covered by the introduction of a tax on digital activities (Google tax) in 2018 and 2019, with revenues of 2.1 billion euros expected. In the end, spending, which was expected to fall by 0.9 GDP point in 2018 based on the undertakings made in the previous 2017-2020 SGP, would fall by only 0.5 GDP point in the 2018-2021 SGP (to 40.5% of GDP) (Table). But above all, despite the tax cuts just introduced, the extra revenue expected from the additional growth should represent 0.1 GDP point (to 38.3% of GDP). In fact, the budget’s redistributive character, combined with the downward revision of the impact of the Catalan crisis on the economy (0.1% of GDP according to the AIReF [2]) led all the institutes (Bank of Spain, the Government, the European Commission) to raise their 2018 growth forecasts from last winter by 0.2 or 0.3 GDP point to bring it slightly below 3% (2.6% for the OFCE according to our April forecasts [3]).
Nevertheless, beyond the shared optimism about Spanish growth, the calculations of the cost of the new measures differ between the Spanish authorities and the Commission. According to the government, the increase in growth should, as we have said, boost tax revenues and neutralize the expected cost of new spending. In 2018, the 0.9 percentage point reduction in the deficit (from 3.1% to 2.2%) would therefore be achieved by the 0.8 GDP point growth in the cyclical balance, combined with the 0.2 point fall in debt charges, with the structural balance remaining stable (fiscal policy would become neutral rather than restrictive as set out in the earlier version of the Pact). But this scenario is not shared by Brussels[4], for whom the cost of the measures, and in particular of the increase in civil servants’ salaries, is underestimated. Expenditures are expected to be 0.2 GDP point higher and revenue 0.2 GDP point higher than the government has announced. According to the Commission, the cyclical balance is expected to improve by 0.9 GDP point, but the fiscal impulse would worsen the structural balance by 0.6 GDP point. In these conditions, the deficit would bypass the 3% mark, but fiscal policy would clearly become expansionary and the 2.2% target would not be hit. The public deficit stood at 2.6% in 2018 (Figure 1).
This more expansionary orientation of the 2018 budget results above all from the political considerations of the former Rajoy government and its effort to deal with the impossibility of governing (facts have demonstrated the fragility of this position). Nevertheless, the timing is ideal – because the only budget commitment required in 2018 is to cross the 3% deficit threshold in order to get out of the corrective arm of the SGP. The year 2018 therefore makes it possible to implement a generous fiscal policy, while crossing the 3% mark, without exposing the country to sanctions. The situation will be more delicate in 2019, when EU rules aimed at reducing a debt that is still well above 60% of GDP will be applied, notably by adjusting the structural balance (Figure 2).
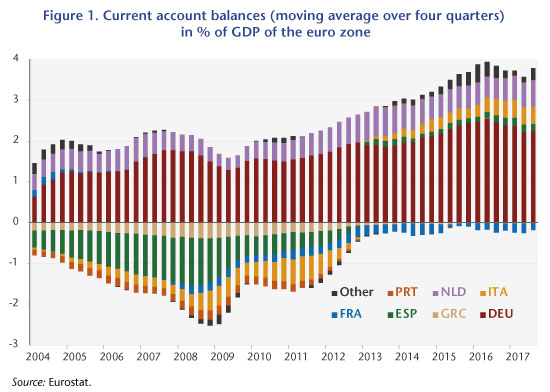
Current account imbalances are at the heart of the process that led to the crisis in the euro zone starting in 2009. The initial years of the euro, up to the crisis of 2007-2008, were a period that saw widening imbalances between the countries of the so-called North (or the core) and those of the South (or the periphery) of Europe, as can be seen in Figure 1.
The trend towards diverging current account balances slowed sharply after 2009, and external deficits disappeared in almost all the euro zone countries. Despite this, there is still a significant gap between the northern and southern countries, so there cannot yet be any talk about reconvergence. Moreover, the fact that the deficits have fallen (Italian and Spanish) but not the surpluses (German and Dutch) has radically changed the ratio of the euro zone to the rest of the world: while the zone’s current account was close to balanced between 2001 and 2008, a significant surplus has formed since 2010, reaching 3.3% of GDP in 2016. In other words, the imbalance that was internal to the euro zone has shifted into an external imbalance between the euro zone and the rest of the world, in particular the United States and the United Kingdom. This imbalance is feeding Donald Trump’s protectionism and putting pressure on exchange rates. While the nominal exchange rate internal to the euro zone is not an adjustment variable, the exchange rate between the euro and the dollar can adjust.
It seems unlikely that the euro zone can maintain a surplus like this over the long run. Admittedly, the pressures for the appreciation of the euro are now being contained by the particularly accommodative monetary policy of the European Central Bank (ECB), but when the time comes for the normalization of monetary policies, it is likely that the euro will appreciate significantly. In addition to having a deflationary impact, this could rekindle the crisis in the zone by once again deepening the Southern countries’ external deficits due to their loss in competitiveness. This will in turn give new grounds for leaving the euro zone.
In a recent study [1], we seek to quantify the adjustments that remain to be made in order to resolve these various current account imbalances, both within the euro zone and vis-à-vis the rest of the world. To do this, we estimate equilibrium real exchange rates at two levels. First, from the point of view of the euro zone as a whole, with the idea that the adjustment of the real exchange rate will pass through an adjustment of the nominal exchange rate, notably the euro vis-à-vis the dollar: we estimate the long-term target of euro / dollar parity at USD 1.35 per euro. Next, we calculate equilibrium real exchange rates within the euro zone, because while the nominal exchange rate between the member countries does not change because of the monetary union, relative price levels allow adjustments in the real exchange rate. Our estimates indicate that substantial misalignments remain (see Figure 2), with the average (in absolute terms) misalignment relative to the level of the euro being 11% in 2016. The relative nominal differential between Germany and France comes to 25%.
In the current situation, claims by some euro zone countries are not accumulating on others in the zone, but there is accumulation by some euro zone countries on other countries around the world. This time the exchange rate (actual, weighted by accumulated gross assets) can serve as an adjustment variable. The appreciation of the euro would therefore reduce the euro zone’s current account surplus and depreciate the value of assets, which are probably accumulated in foreign currency. France however now appears as the last country in the euro zone running a significant deficit. Relative to the zone’s other countries, it is France that is contributing most (negatively) to the imbalances with Germany (positively). If the euro appreciates, it is likely that France’s situation would further deteriorate and that we would see a situation where the net internal position accumulates, but this time between France (on the debtor side) and Germany (creditor). This would not be comparable to the situation prior to 2012, since France is a bigger country than Greece or Portugal, and therefore the question of sustainability would be posed in very different terms. On the other hand, reabsorbing this imbalance by an adjustment of prices would require an order of magnitude such that, given the relative price differentials that would likely be needed between France and Germany, it would take several decades to achieve. It is also striking that, all things considered, since 2012, when France undertook a costly reduction in wages through the CICE tax credit and the Responsibility Pact, and Germany introduced a minimum wage and has been experiencing more wage growth in a labour market that is close to full employment, the relative imbalance between France and Germany, expressed in the adjustment of relative prices, has not budged.
Three consequences can be drawn from this analysis:
The disequilibrium that has set in today will be difficult to reverse, and any move to speed this up is welcome. Ongoing moderation in rises in nominal wages in France, stimulating the growth of nominal wages in Germany, restoring the share of German added value going to wages, and continuing to boost the minimum wage are all paths that have been mentioned in the various iAGS reports. A reverse social VAT, or at least a reduction in VAT in Germany, would also be a way to reduce Germany’s national savings and, together with an increase in German social security contributions, would boost the competitiveness of other countries in the euro zone;
The pre-crisis internal imbalance has become an external imbalance in the euro zone, which is leading to pressure for a real appreciation of the euro. The order of magnitude is significant: it will weigh on the competitiveness of the different countries in the euro zone and will lead to the problems familiar prior to 2012 resurfacing in a different form;
The appreciation of the euro caused by the current account surpluses in certain euro zone countries is generating an externality for the euro zone countries. Because their current accounts respond differently to a change in relative prices, Italy and Spain will see their current account balance react the most, while Germany’s will react the least. In other words, the appreciation of the euro, relatively, will hit the current accounts of Italy and Spain harder than Germany’s and will lead to a situation of internal imbalance much like what existed prior to 2012. This externality together with the reduced sensitivity of Germany’s current account to relative prices argues for a reduction in imbalances by boosting Germany’s internal demand, i.e. by a reduction in its national savings. The tools to do this could include boosting public investment, lowering direct personal taxes, or raising the minimum wage more quickly relative to productivity and inflation.
[1] Sébastien Villemot, Bruno Ducoudré, Xavier Timbeau: “Taux de change d’équilibre et ampleur des désajustements internes à la zone euro“ [Equilibrium exchange rate and scale of internal misalignments in the euro zone], Revue de l’OFCE, 156 (2018).
The participation rate and working hours: Differentiated impacts on the unemployment rate
In the course of the crisis, most European countries reduced actual working hours to a greater or lesser extent through partial unemployment schemes, the reduction of overtime or the use of time savings accounts, but also through the expansion of part-time work (particularly in Italy and Spain), including on an involuntary basis. In contrast, the favourable trend in US unemployment has been due in part to a significant fall in the labour force participation rate.
Assuming that a one-point increase in the participation rate leads, holding employment constant, to a rise in the unemployment rate, it is possible to measure the impact of these adjustments (working hours and participation rates) on unemployment by calculating an unemployment rate at constant employment and checking these adjustments. Except in the United States, the countries studied experienced an increase in their active population (employed + unemployed) that was larger than that observed in the general population, due among other things to the implementation of pension reforms. Mechanically, without job creation, this demographic growth would have the effect of pushing up the unemployment rate in the countries concerned.
If the participation rate had remained at its 2007 level, the unemployment rate would be lower by 2.3 points in France, 3.1 points in Italy and 2 points in the United Kingdom (see figure). On the other hand, without the sharp contraction in the US labour force, the unemployment rate would have been more than 3.2 percentage points higher than that observed at the end of 2017. It also seems that Germany has experienced a significant reduction in its unemployment rate since the crisis, even as its participation rate rose. Given the same participation rate, Germany’s unemployment rate would be … 0.9%. However, changes in participation rates are also the result of structural demographic factors, to such an extent that the hypothesis of a return to 2007 rates can be considered arbitrary. For the United States, part of the fall in the participation rate can be explained by changes in the structure of the population. The figure for under-employment can also be considered too high.
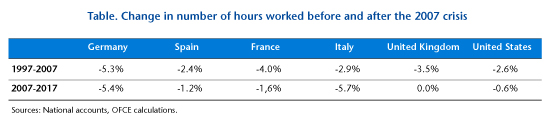
The lessons are very different with respect to the duration of work. It seems that if working hours had stayed at their pre-crisis levels in all the countries, the unemployment rate would have been 3.7 points higher in Germany and 2.9 points higher in Italy. In France, Spain, the United Kingdom and the United States, working time has fallen only slightly since the crisis. If working hours had remained the same as in 2007, the unemployment rate would have been slightly higher in all of these countries.
Note that the trend for working time to fall largely preceded the 2007 economic crisis (table). While this pre-crisis trend has continued in Germany and even been accentuated in Italy, working time has fallen to a lesser extent in France, Spain and the United States. In the United Kingdom, the reduction in working hours that was underway before 2007 has been cut short.
What can be deduced from the figures on inflation?
In May, inflation in the euro area moved closer to the ECB target. The sharp rise in inflation, from 1.2% to 1.9% per annum in the space of one month, did not nevertheless provoke a reaction, since the main reason for it was well known and common to all the countries: the surge in oil prices. After having plummeted to 30 dollars a barrel at the beginning of 2016, the price per barrel now stands at around 77 dollars, the highest level since 2014. Even after adjusting for the exchange rate – the euro has appreciated against the dollar – the price of a barrel has increased by almost 40% (18 euros) over the last 12 months, directly causing prices in the net oil importing countries to rise at an accelerating pace. In addition to this common effect, for France the impact of the hike in indirect taxes on tobacco and fuels, which came into force at the beginning of the year, will, according to our estimates, add 0.4 point to the price index.
At the same time, the underlying inflation (or core inflation) index, excluding products with volatile prices (such as oil and fresh produce) as well as prices subject to state intervention (electricity, gas, tobacco, etc.), is still not picking up pace and is staying below 1%. The second-round effect of an oil shock, which passes through a rise in wages, does not seem to be very significant, since consumers are absorbing most of the shock by reducing their purchasing power. This explains part of the observed slowdown in household consumption at the beginning of the year as well as the general lack of reaction of the monetary authorities to the announcement of the inflation figures.
There remains the question of the weakness of trend inflation and its link with the state of the economy. Have we already caught up with the output gap that arose since the Great Depression of 2008 (an output gap of close to zero), or are there still production capacities that can be mobilized in the event of additional demand (positive output gap)? In the first case, this would mean that the link between growth and inflation has been significantly broken; in the second case, this would indicate that the low level of inflation is not surprising and that the normalization of monetary policy needs to be gradual.
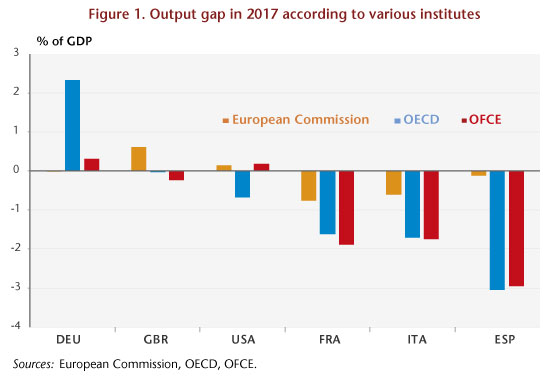
In 2017, even though the process of recovery was consolidating and spreading, most developed economies were still lagging behind their pre-crisis trajectory. Only a few seem to have already overcome the lag in growth. Thus, two categories of countries seem to be emerging: the first – in particular Germany, the United States and the United Kingdom – includes countries that have caught up with their potential level of production and are at the top of the cycle; the second – which includes France, Italy and Spain, for example – includes countries that are still experiencing a lag in production which, according to the economic analysis institutes, lies between 1 and 2 points of GDP for France and Italy and 3 points of GDP for Spain (Figure 1).
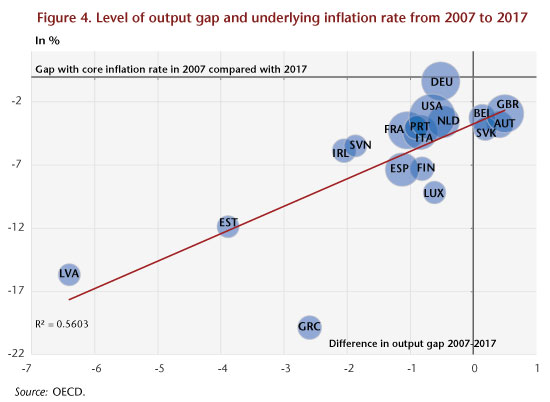
The presence of developed countries in both categories should logically result in the appearance of inflationary pressures in the countries listed in the first group and an inflation gap in those in the latter. However, these two phenomena were not apparent in 2017: as shown in Figure 2, the link between the level of the output gap and the underlying inflation rate is far from clear, casting doubt on the interpretation to be made with respect to the level of the output gap: to uncertainties relating to this notion is added that associated with the level of this gap in the past, in 2007 for example.
Given this high level of uncertainty, it seems appropriate to make a diagnosis based on how this output gap has varied since 2007. Such an analysis leads to a clearer consensus between the different institutes and to the disappearance of the first category of countries, those with no additional growth margin beyond their own potential growth. Indeed, according to these, in 2017 none of the major developed countries would have come back to its output gap level of 2007, including Germany. This gap would be around 1 GDP point for Germany, 2 GDP points for the United Kingdom and the United States, more than 3 GDP points for France and Italy and around 5 GDP points for Spain (Figure 3).
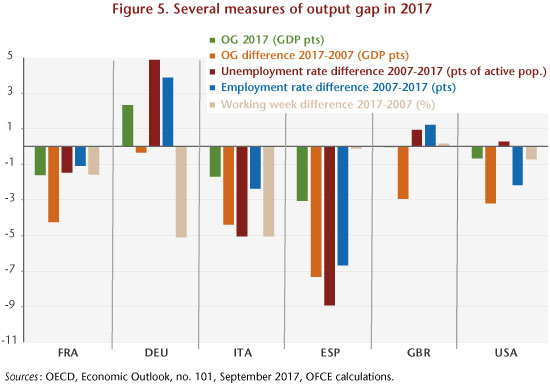
This analysis is more in line with the diagnosis of the renewal of inflation based on the concept of underlying inflation: the fact that the economies of the developed countries had not in 2017 recovered their cyclical level of 2007 explains that inflation rates were lower than those observed during the pre-crisis period (Figure 4). This finding is corroborated by an analysis based on criteria other than the output gap, notably the variation in the unemployment rate and the employment rate since the beginning of the crisis and in the rate of increase in working hours during this same period. Figure 5 illustrates these different criteria. On the basis of these latter criteria, the qualitative diagnosis of the cyclical situation of the different economies points to the existence of relatively high margins for a rebound in Spain, Italy and France. This rebound potential is low in Germany, the United States and the United Kingdom: only an increase in working time in the former or in the employment rate for the latter two could make this possible.
 Nevertheless, beyond the shared optimism about Spanish growth, the calculations of the cost of the new measures differ between the Spanish authorities and the Commission. According to the government, the increase in growth should, as we have said, boost tax revenues and neutralize the expected cost of new spending. In 2018, the 0.9 percentage point reduction in the deficit (from 3.1% to 2.2%) would therefore be achieved by the 0.8 GDP point growth in the cyclical balance, combined with the 0.2 point fall in debt charges, with the structural balance remaining stable (fiscal policy would become neutral rather than restrictive as set out in the earlier version of the Pact). But this scenario is not shared by Brussels
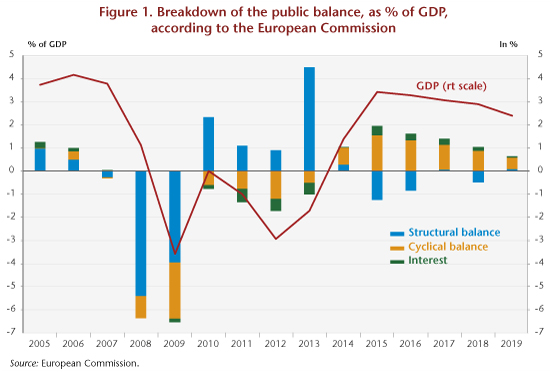 This more expansionary orientation of the 2018 budget results above all from the political considerations of the former Rajoy government and its effort to deal with the impossibility of governing (facts have demonstrated the fragility of this position). Nevertheless, the timing is ideal – because the only budget commitment required in 2018 is to cross the 3% deficit threshold in order to get out of the corrective arm of the SGP. The year 2018 therefore makes it possible to implement a generous fiscal policy, while crossing the 3% mark, without exposing the country to sanctions. The situation will be more delicate in 2019, when EU rules aimed at reducing a debt that is still well above 60% of GDP will be applied, notably by adjusting the structural balance (Figure 2).
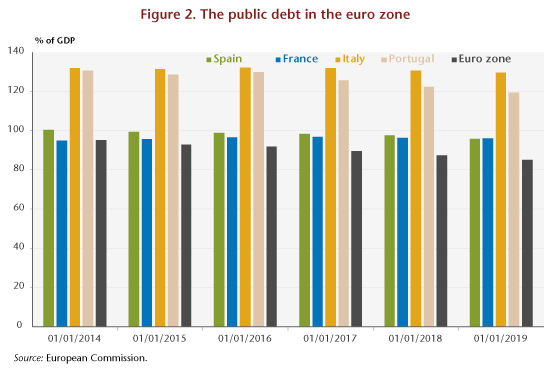
 The trend towards diverging current account balances slowed sharply after 2009, and external deficits disappeared in almost all the euro zone countries. Despite this, there is still a significant gap between the northern and southern countries, so there cannot yet be any talk about reconvergence. Moreover, the fact that the deficits have fallen (Italian and Spanish) but not the surpluses (German and Dutch) has radically changed the ratio of the euro zone to the rest of the world: while the zone’s current account was close to balanced between 2001 and 2008, a significant surplus has formed since 2010, reaching 3.3% of GDP in 2016. In other words, the imbalance that was internal to the euro zone has shifted into an external imbalance between the euro zone and the rest of the world, in particular the United States and the United Kingdom. This imbalance is feeding Donald Trump’s protectionism and putting pressure on exchange rates. While the nominal exchange rate internal to the euro zone is not an adjustment variable, the exchange rate between the euro and the dollar can adjust.
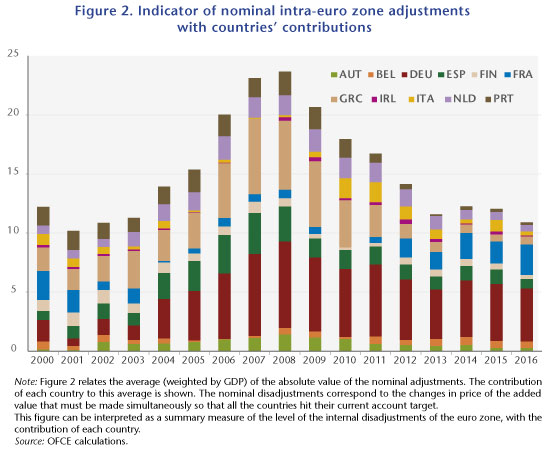 In the current situation, claims by some euro zone countries are not accumulating on others in the zone, but there is accumulation by some euro zone countries on other countries around the world. This time the exchange rate (actual, weighted by accumulated gross assets) can serve as an adjustment variable. The appreciation of the euro would therefore reduce the euro zone’s current account surplus and depreciate the value of assets, which are probably accumulated in foreign currency. France however now appears as the last country in the euro zone running a significant deficit. Relative to the zone’s other countries, it is France that is contributing most (negatively) to the imbalances with Germany (positively). If the euro appreciates, it is likely that France’s situation would further deteriorate and that we would see a situation where the net internal position accumulates, but this time between France (on the debtor side) and Germany (creditor). This would not be comparable to the situation prior to 2012, since France is a bigger country than Greece or Portugal, and therefore the question of sustainability would be posed in very different terms. On the other hand, reabsorbing this imbalance by an adjustment of prices would require an order of magnitude such that, given the relative price differentials that would likely be needed between France and Germany, it would take several decades to achieve. It is also striking that, all things considered, since 2012, when France undertook a costly reduction in wages through the CICE tax credit and the Responsibility Pact, and Germany introduced a minimum wage and has been experiencing more wage growth in a labour market that is close to full employment, the relative imbalance between France and Germany, expressed in the adjustment of relative prices, has not budged.
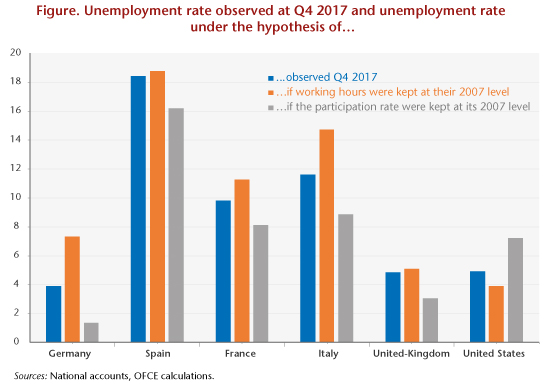
 The presence of developed countries in both categories should logically result in the appearance of inflationary pressures in the countries listed in the first group and an inflation gap in those in the latter. However, these two phenomena were not apparent in 2017: as shown in Figure 2, the link between the level of the output gap and the underlying inflation rate is far from clear, casting doubt on the interpretation to be made with respect to the level of the output gap: to uncertainties relating to this notion is added that associated with the level of this gap in the past, in 2007 for example.
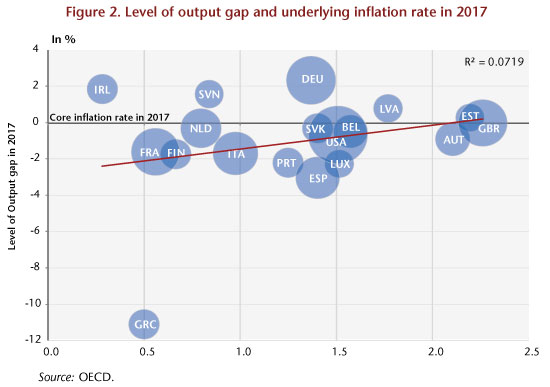 Given this high level of uncertainty, it seems appropriate to make a diagnosis based on how this output gap has varied since 2007. Such an analysis leads to a clearer consensus between the different institutes and to the disappearance of the first category of countries, those with no additional growth margin beyond their own potential growth. Indeed, according to these, in 2017 none of the major developed countries would have come back to its output gap level of 2007, including Germany. This gap would be around 1 GDP point for Germany, 2 GDP points for the United Kingdom and the United States, more than 3 GDP points for France and Italy and around 5 GDP points for Spain (Figure 3).
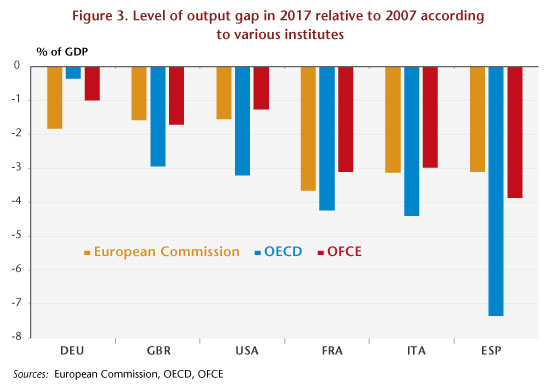 This analysis is more in line with the diagnosis of the renewal of inflation based on the concept of underlying inflation: the fact that the economies of the developed countries had not in 2017 recovered their cyclical level of 2007 explains that inflation rates were lower than those observed during the pre-crisis period (Figure 4). This finding is corroborated by an analysis based on criteria other than the output gap, notably the variation in the unemployment rate and the employment rate since the beginning of the crisis and in the rate of increase in working hours during this same period. Figure 5 illustrates these different criteria. On the basis of these latter criteria, the qualitative diagnosis of the cyclical situation of the different economies points to the existence of relatively high margins for a rebound in Spain, Italy and France. This rebound potential is low in Germany, the United States and the United Kingdom: only an increase in working time in the former or in the employment rate for the latter two could make this possible.